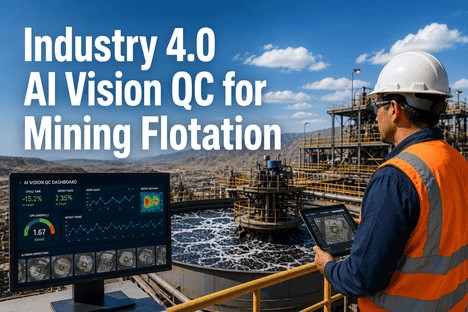
The 09:47 prediction changed how the quality manager runs the shift. The AI vision dashboard fired an amber alert on Cell 3 — predicted grade risk 82% within the 12:00 to 14:00 window. The froth looked stable to the operator. The air flow was within the normal range. But the model detected a froth colour index shift of 12% since 08:30, combined with a froth velocity increase of 14% and a froth stability index decline of 7%. Historical pattern match: 89% similarity to the last three grade deviation events. The quality manager investigated at 10:00, found the frother line on Cell 3 was partially restricted, and adjusted the reagent dosage at 10:12. By 11:30, the risk score was back to green. The 12:00 lab assay confirmed the grade held at 26.3% Cu. Forty-eight tonnes of concentrate that would have been produced off-grade stayed within specification. Without the AI vision prediction, the quality manager would have discovered the condition at 14:00, when the next lab assay arrived. Two hours of off-grade material — 48 tonnes at approximately $4,200 in low-grade stockpile value loss — written off as scrap with the cause logged as unknown. This is what AI vision quality does that the lab cannot: it compresses the quality cycle time from 90 minutes to 25 minutes, turning the lab assay from a detection tool into a confirmation tool.
AI Vision Quality · Cycle Time Compression · Real-Time Cpk · Grade Prediction
Every Hour You Wait for the Lab Assay Is an Hour of Off-Grade Concentrate You Cannot Recover. AI Vision Quality Closes That Gap.
iFactory's AI vision quality platform monitors every flotation cell in real time — predicting concentrate grade from froth features, tracking Cpk with a forward-looking trajectory, and alerting quality leaders 1-3 hours before off-spec material is produced — cutting scrap by 30-50% and compressing quality cycle time by 10-20%.
90
Minutes — Average quality cycle time from condition change to corrective action in conventional flotation operations using lab assays
10-20%
Cycle time reduction achieved when AI vision replaces periodic sampling with continuous real-time froth analysis and grade prediction
0.85-0.96
R-squared range for validated deep learning models predicting concentrate grade from froth image features in operating flotation circuits
$1.7M
Annual scrap cost for a typical 40,000 tpd copper concentrator at 4% off-grade rate — before AI vision intervention
The Quality Cycle Time Chain: Where the Minutes Go and How AI Vision Recovers Them
Quality cycle time in flotation is the elapsed time between a process condition change that affects concentrate grade and the corrective action that restores the grade to specification. In a conventional workflow, that cycle consists of six sequential steps — each adding delay that allows off-grade material to accumulate in the circuit. AI vision quality collapses this chain by performing steps two through five in parallel, continuously, and in milliseconds.
Condition Change Occurs
Feed grade shifts, reagent line fouls, aeration drifts. The froth surface changes immediately — but no instrument detects it at this point.
AI Vision: Detects at T+0
Camera captures froth change in real time. Model extracts colour, bubble size, velocity, and stability features instantly.
Operator Collects Sample
Scheduled sample collection at the cell launder. Typically every 60 minutes. The condition may have started 45 minutes before the sample is taken.
AI Vision: Predicts at T+<1
Deep learning model predicts concentrate grade from froth features. Uncertainty bounds calculated. Alert fires if grade crosses threshold.
Lab Processes Sample
Sample transported, dried, prepared, and analysed by XRF. Result available 30-45 minutes after collection. The condition is now 60+ minutes old.
AI Vision: Alerts at T+2
Dashboard updates with predicted grade, Cpk trajectory, and driver contribution. Quality manager receives mobile alert simultaneously.
Lab Result Reviewed
Result transcribed, logged, and reviewed. Quality manager identifies off-grade condition that has been running for 60+ minutes.
AI Vision: Driver at T+2
Root cause identified — froth colour, bubble size, velocity, stability, or texture. Corrective action target clear without investigation.
Corrective Action Decided
Root cause investigation begins — which cell, which parameter, which shift. Decision made. Action at T+90 total cycle time.
AI Vision: Action at T+25
Quality manager investigates with driver contribution data. Confirms cause at cell. Adjusts parameter. Total cycle: 25 minutes.
Off-Grade Material: 30-60 t
In the 90-minute cycle, 30-60 tonnes of off-grade concentrate produced. Scrap value lost: $3,000-$6,000 per event.
Off-Grade Avoided: 0 t
Corrective action completed before grade drifted below specification. Concentrate remains in spec. Zero tonnage diverted to low-grade.
The Quality Cycle Time Arithmetic
A 40,000 tpd copper concentrator at 0.7% feed grade with 88% recovery produces approximately 17 tonnes of concentrate every 10 minutes. Each off-grade event that runs 90 minutes before correction generates 153 tonnes of off-spec material. At a 15% price differential between target-grade and low-grade concentrate, each event costs approximately $13,500 in diverted value. With an average of 18 events per month (industry benchmark: 3-5% of operating hours in off-grade condition), the monthly scrap cost exceeds $240,000. AI vision quality, by compressing the cycle time to 25 minutes, reduces the per-event off-grade tonnage from 153 tonnes to approximately 42 tonnes — saving $9,500 per event and over $170,000 per month.
Five Froth Features That Predict Grade Deviation — and How AI Vision Reads Each One
Concentrate grade deviation is the output. The input is one of five distinct froth characteristics that the AI vision model learns to correlate with grade during training on historical data. Each feature has a measurable visual signature that changes before the grade measurably shifts — giving the quality manager a prediction window of 20 minutes to 3 hours, depending on the driver.
Froth Feature
What the AI Vision Model Detects and How It Correlates with Grade
Prediction window: 20-40 min
Darkening of the froth surface by 8-12% indicates increasing mineral content or changing oxidation state. Whiter froth signals dilution or gangue entrainment. The colour index is extracted from the froth image in HSV colour space and correlated against historical assay data. It is the fastest-responding visual indicator of grade change.
Prediction window: 30-60 min
Smaller, uniform bubbles correlate with high mineralization and good grade. Coarsening of the bubble structure signals aeration efficiency loss or reagent imbalance. The Mask R-CNN model segments individual bubbles from the froth image and computes the size distribution. R-squared of 0.78 for grade prediction from bubble size alone in validated coal flotation studies.
Prediction window: 20-50 min
Froth velocity is inversely correlated with concentrate grade — slower-moving froth indicates higher mineral loading and better recovery. Velocity deviations of 15% or more from the running mean correlate with grade excursions. The model tracks froth velocity by optical flow analysis between consecutive camera frames and flags accelerating froth as a grade risk indicator.
Prediction window: 30-60 min
Stable froth with slow bubble collapse indicates well-mineralised bubble surfaces. Rapid collapse — measured as bubble burst rate per unit area — signals imminent stability failure. The froth stability index is derived from the rate of change in bubble surface area over time. This is the earliest detectable precursor of grade deviation, often visible 30-60 minutes before grade impact.
Prediction window: 15-25 min
Finer froth texture correlates with higher concentrate grade. Coarse, watery, or broken texture signals dilution or gangue recovery. The model extracts texture features using GLCM-based analysis — contrast, correlation, energy, and homogeneity — from froth images. Texture disruption is visible to AI vision 15-25 minutes before a human operator would notice the change on the cell surface.
How AI Vision Quality Compresses Cycle Time: From Sequential Sampling to Continuous Prediction
The structural change that AI vision brings to flotation quality management is not just faster detection. It replaces a fundamentally sequential process — sample, transport, prepare, analyse, review, decide — with a continuous parallel process that operates every 10 seconds on every cell. The diagram above shows the cycle time reduction per step. Here is the technology stack that makes it possible.
Multi-spectral cameras installed above each flotation cell capture froth images at 1-2 second intervals. Illumination systems ensure consistent image quality across shifts. The imaging configuration — camera position, lens, lighting angle — is validated per cell based on froth surface geometry and access constraints.
Deep learning models — CNNs for froth feature extraction, Mask R-CNN for bubble segmentation, optical flow for velocity — process each frame to extract colour index, bubble size distribution, froth velocity, stability index, and texture features. All five features are computed in under 500 milliseconds per frame.
Extracted froth features are fused with process data — air flow rate, reagent dosage, pulp level, feed grade — and fed into a trained regression model. LSTM networks capture temporal patterns in the feature sequence. The model outputs a grade prediction with quantified uncertainty bounds every 10 seconds per cell.
Quality Dashboard: Four Views That Change How You Manage Cycle Time
The quality manager dashboard for AI vision inspection is built around a single operating principle: the quality manager should never discover off-grade concentrate at the end of a shift. Every alert, forecast, and trend line is positioned to give actionable information before the off-grade event — not after.
Dashboard Panel 01
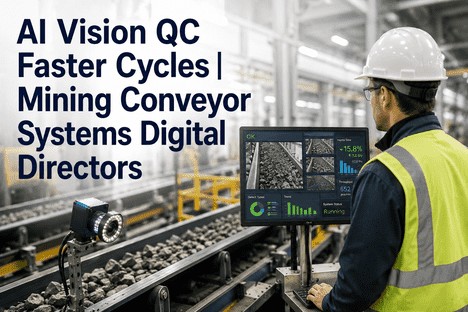
Live Cell Quality Risk — All Cells, One Screen
Every flotation cell displays a real-time quality risk score (0-100%) based on the composite prediction from all five froth features. Green below 40%, amber 40-70%, red above 70%. Cells are sorted by risk score — highest risk at the top. The quality manager sees the complete circuit health on a single glance, without opening individual cell views.
Quality manager action: Scan risk scores at shift start. Investigate amber cells. Intervene on red cells immediately.
Dashboard Panel 02
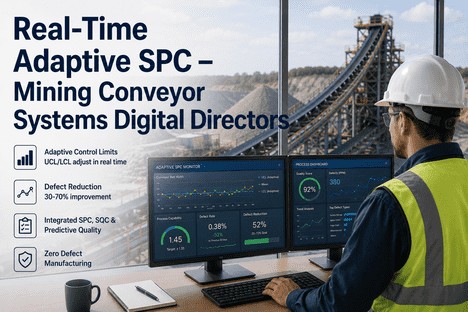
Real-Time SPC with Predicted Cpk Trajectory
Live control chart plotting predicted grade every 10 seconds against specification limits. Current Cpk displayed with a predicted trajectory line extending 2-4 hours forward. When predicted Cpk crosses 1.15 (amber) or 1.0 (red), an automatic alert fires. The quality manager sees where Cpk is heading — not where it was at the last assay.
Quality manager action: When predicted Cpk crosses 1.15, investigate the dominant driver. Intervene before Cpk reaches 1.0.
Dashboard Panel 03
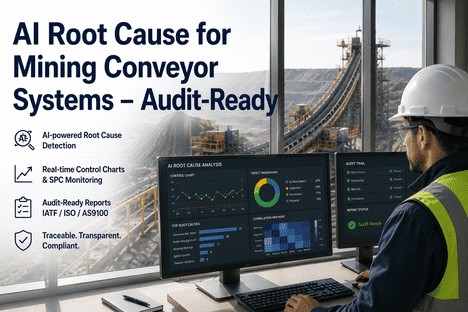
Driver Contribution — Root Cause at a Glance
When a quality risk forecast fires, the dashboard displays each froth feature's percentage contribution to the predicted grade deviation. A 60% froth colour contribution points to a reagent or feed grade issue. A 50% stability index contribution points to aeration or frother dosage. The quality manager does not need to guess which variable caused the condition — the model identifies it.
Quality manager action: Direct corrective action to the dominant driver. No trial-and-error parameter adjustment.
Dashboard Panel 04
Intervention Log and Off-Grade Avoided Counter
Every alert, investigation, and corrective action is timestamped and logged — cell, predicted driver, risk score, action taken, and outcome. The off-grade avoided counter aggregates the cumulative value of concentrate that stayed in spec because the quality manager acted on a predictive alert. The counter becomes the direct ROI evidence for the AI vision deployment.
Quality manager action: Review intervention record in shift handover. Include off-grade avoided metrics in quality reports.
Cpk in Motion: How the Prediction Window Changes Quality Management Decisions
The Cpk prediction window is the element that shifts quality management from reactive to proactive. Instead of seeing Cpk where it was at the last lab assay and deciding whether that value is acceptable, the quality manager sees Cpk where it is going and decides whether intervention is needed before it reaches the off-grade threshold.
Cpk Prediction Trajectory — Cell 3 Concentrate Grade: Three Possible Futures
Current: Cpk 1.12
Marginal capability. Above the off-grade threshold (1.0) but below capable (1.33). Any additional disturbance pushes into off-grade territory.
No Intervention: Cpk 0.94
Declining at 0.08/hour. Crosses 1.0 at 13:00. Reaches 0.94 by 14:00. Off-grade concentrate produced for 60+ minutes. Estimated 38 tonnes diverted to low-grade.
Intervention: Cpk 1.22
Reagent adjusted at 10:12. Model detects froth improvement at 10:45. Predicted Cpk recovery to 1.22 by 11:00. Zero off-grade tonnes produced.
The gap between "No Intervention" and "Intervention" is the value of the AI vision prediction window. At a 15% concentrate price differential, each avoided off-grade event saves $3,000-$6,000 in diverted material value. With 15-20 such events per month across a 40,000 tpd circuit, the monthly savings from Cpk prediction alone exceeds $75,000.
"
I have been a quality manager in flotation for 11 years. I know the froth. I know when the colour is wrong, when the bubbles are too big, when the froth is moving too fast. But I cannot watch every cell every second. The AI vision quality dashboard told me at 09:47 that Cell 3 would go off-grade at 12:00. I did not believe it at first — the froth looked fine to me. But I checked the trend and saw the colour index had shifted 12% since 08:30. I adjusted the reagent at 10:12. By 11:30, the risk score was back to green. The lab assay at 12:00 confirmed the grade held at 26.3% Cu. Without that prediction, I would have found out at 14:00 when the next assay arrived — two hours of off-grade concentrate that I would have written up as 'cause unknown.' That prediction changed how I manage quality on every shift since.
— Quality Manager, Copper Flotation Circuit, South America
90-Day Deployment Path: From Camera Installation to Live Grade Predictions
The deployment is structured so that the quality team builds confidence in the AI vision predictions through observed accuracy before the system becomes the primary quality record. Shadow mode — where the model runs in parallel with existing inspection — is the critical validation phase that ensures operator and quality manager trust.
Camera Installation and Data Collection
Multi-spectral cameras positioned above each flotation cell. Lighting configured for consistent image quality. Historical froth images and lab assay data loaded into the training pipeline. No production disruption.
Model Training and Shadow Mode
AI model trained on 30+ days of froth images matched to assay results. Runs in shadow mode — predictions compared against lab assays but no alerts fired. Quality team reviews daily comparison reports. False positive and false negative rates documented.
Live Prediction Activation
Model validated against 15+ off-grade events or a minimum of 30 shadow-mode days. Dashboard activated with live risk scores and Cpk trajectory. Alert thresholds calibrated based on shadow mode false positive rate. Quality team reviews first week of live alerts.
Scale and Optimise
Deployment expanded to additional cells. Alert thresholds refined from 30 days of live data. Quality team integrates AI vision predictions into standard operating procedures. ROI documented through off-grade avoided counter.
Conclusion
Off-grade concentrate in flotation is not detected by the quality control lab. It is detected by the customer — when the concentrate shipment is assayed at the smelter and the grade falls short of the specification, triggering a penalty, a rejection, or a renegotiation. The lab assay at the concentrator is the quality manager's best available tool for in-process quality measurement, but it operates on a 45-minute delay. In those 45 minutes, the flotation circuit can produce 30 to 60 tonnes of off-grade material. That material is scrap — whether it is sent to the low-grade stockpile at a fraction of value or blended into on-spec shipments at a quality discount.
AI vision quality inspection breaks this cycle by predicting concentrate grade in real time from froth images — compressing the quality cycle time from 90 minutes to 25 minutes and turning the lab assay from a detection tool into a confirmation tool. The deep learning models do not need to be perfect. They need to be accurate enough and fast enough that the quality manager can investigate, intervene, and prevent an off-grade event before it happens. A model with an R-squared of 0.90 that predicts grade every 10 seconds prevents more off-grade material than a 99% accurate lab assay that reports the result 45 minutes after the sample was taken.
iFactory's AI vision quality platform is built for quality managers who are ready to move from reactive quality control to predictive quality assurance. Book a Demo to see how the platform performs on your circuit data, or talk to an expert about configuring AI vision quality inspection for your cell layout, reagent regime, and concentrate specification targets.
Frequently Asked Questions
The Lab Assay Tells You What Happened 45 Minutes Ago. AI Vision Tells You What Is Happening Right Now. The Difference Is Off-Grade Prevented vs Off-Grade Discovered.
iFactory's AI vision quality platform monitors five froth features across every flotation cell — colour index, bubble size, froth velocity, stability index, and texture — predicting concentrate grade in real time, tracking Cpk with forward-looking trajectory, and alerting quality leaders before off-spec material is produced. Deployed in copper, zinc, lead, and iron ore flotation circuits globally.