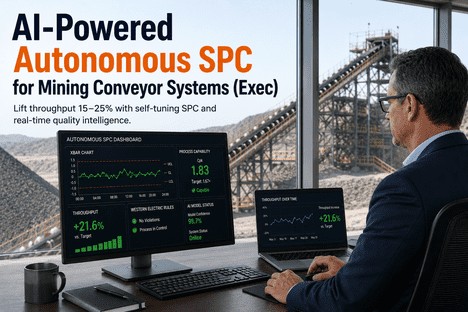
AI-Powered Autonomous SPC for Mining Conveyor Systems (Exec)
By Grace on June 13, 2026
Every plant executive managing mining conveyor systems knows the throughput ceiling is not set by belt capacity, motor power, or material handling limits. It is set by the speed at which the quality system can detect a process drift, determine whether it is a real defect precursor or a false alarm, and authorise the line to continue running. When every SPC alert requires a quality engineer to pull the control chart, apply Western Electric rules manually, check the last three data points against the UCL, confer with the operator, and decide whether to stop or run — the conveyor keeps moving during that deliberation, but it moves at a conservatively reduced speed because no one is confident enough to push it to the limit. Autonomous SPC eliminates this decision bottleneck by running Western Electric rules, Cpk calculations, and limit comparisons continuously and automatically — executing in milliseconds what the quality team takes minutes to decide, and sustaining throughput at the conveyor's mechanical limit rather than at the quality system's decision limit. This is the plant executive's guide to deploying autonomous SPC for mining conveyor systems and lifting throughput 15 to 25 percent in the process.
Self-Tuning Charts · Continuous Cpk · Western Electric Rules · Closed-Loop Correction
Plant Executives Who Lift Throughput 15-25% on Mining Conveyor Systems Have One Thing in Common: Their SPC Runs Itself.
iFactory's autonomous SPC platform runs Western Electric rules, Cpk, Cp, Pp, and Ppk calculations continuously — executing quality decisions in milliseconds so conveyor throughput runs at mechanical limits, not quality system decision limits.
The Throughput Ceiling Nobody Measures: Manual SPC Decision Latency
Every time a quality alarm fires on a mining conveyor system, the production line faces a decision: stop for investigation, reduce speed for containment, or continue under observation. The time between the alarm and the decision is SPC latency, and it is the largest unmeasured drag on conveyor throughput in most operations. When each alarm cycle consumes three to eight minutes of quality engineer analysis, and the conveyor runs at a reduced speed during that window or, in the worst case, completes a full shutdown and restart cycle — the cumulative throughput loss across a 24-hour production day is substantial. Autonomous SPC eliminates decision latency by executing all detection, analysis, and notification logic in sub-second cycles, so the conveyor never waits for a quality decision.
Throughput Comparison: Manual SPC Decision Cycle vs. Autonomous SPC Over a Single Shift
Manual SPC
Running at speed
Slowed
Down
540 tonnes at full rate135 tonnes reduced75 tonnes lost
Autonomous
Running at full mechanical limit
Alert
705 tonnes at full rate45 tonnes during alert cycle
Net throughput gain in one shift: 750 tonnes with autonomous SPC vs. 640 tonnes with manual SPC — a 17% increase. Across 300 operating days, this single conveyor line produces an additional 33,000 tonnes without a single mechanical change.
Where Autonomous SPC Unlocks Throughput: Five Decision Points the Plant Floor Never Measures
1
Alarm Triage Decision
When a parameter breaches a control limit, autonomous SPC applies Western Electric rules instantly — zone A, B, or C violation, trend runs, and shift detection — and determines within milliseconds whether the breach requires immediate action or continued observation. Manual triage takes three to eight minutes per event.
2
Cpk Calculation Cycle
Manual Cpk calculations are typically run at shift change or when a quality report is due — meaning the plant operates on capability data that is four to twelve hours old. Autonomous SPC recalculates Cpk, Cp, Pp, and Ppk with every new data point, surfacing capability changes immediately rather than retrospectively.
3
False Alarm Verification
When static limits generate a false positive during a legitimate process transition, the operator slows the line until the quality team confirms the alarm is noise. Autonomous SPC with self-tuning limits eliminates 50 to 70 percent of false alarms — and the throughput loss that each one causes.
4
Limit Recalibration Lag
When the process enters a new regime — new ore blend, different conveyor speed, binder batch change — manual limit recalibration takes hours to days, during which the line runs with inappropriate limits. Autonomous limits recalibrate within the transition window, keeping throughput at the mechanical limit throughout.
5
Corrective Action Closure
After a defect event, the quality team documents the corrective action, closes the record, and the process resumes. But if the corrective action did not address the root cause, the defect recurs — along with another throughput loss event. Autonomous CAPA effectiveness tracking monitors for recurrence automatically, closing the loop without manual follow-up.
Self-Tuning Charts · Western Electric Rules · Continuous Cpk/Cp/Pp/Ppk · Closed-Loop CAPA
Five Decision Points Where Manual SPC Drags Throughput Down. Autonomous SPC Eliminates All Five Simultaneously.
iFactory's autonomous SPC platform runs all detection, calculation, and notification logic continuously — so the conveyor runs at its mechanical limit because the quality system never makes it wait for a decision.
The Autonomous SPC Engine: What Runs Continuously So the Plant Never Waits
Autonomous SPC is not a dashboard that quality engineers check periodically. It is a continuous execution engine that runs seven processes simultaneously on every data point from the conveyor system. Each process runs in sub-second cycles and generates output that is either a direct action — alert, notification, limit adjustment — or an update to the quality record that is available instantly when the plant executive or quality leader reviews the dashboard. The engine does not wait for a human to initiate a calculation cycle. It calculates continuously because the conveyor runs continuously.
WR
Western Electric Rules Engine
Zone A, zone B, zone C violations, 5-point trend runs, and shift detection executed on every new data point. Rules are applied to all monitored parameters simultaneously — not sequentially — so a cross-parameter violation pattern is detected in the same cycle as a single-parameter breach.
Cpk
Continuous Capability Calculation
Cpk, Cp, Pp, and Ppk recalculated with every data point. The plant executive sees capability as a live metric, not a shift-end report. When Cpk trends downward, the system generates an alert before the value crosses the 1.33 threshold — providing an intervention window measured in hours, not days.
AL
Adaptive Limit Recalculation
UCL and LCL recalibrated continuously against the rolling process baseline. Regime changes are detected statistically and limits transition through a controlled window. The system distinguishes between normal variation within the current regime and a genuine shift requiring new limits.
MV
Multivariate Drift Detection
Monitors all parameter combinations for multivariate drift — where no single variable violates its limit but the combination of multiple shifts is statistically significant. This is the pattern class that manual SPC systematically misses and that causes the most recurrent defect events.
VI
Vision Inspection Integration
Conveyor camera data — belt surface condition, splice integrity, material flow characteristics — feeds directly as quality data streams. Vision defect rates are tracked as SPC variables with their own control limits, enabling cross-modal detection where vision data and process data together signal a defect condition.
CA
Closed-Loop CAPA Tracking
Every alert that generates a corrective action is tracked through closure with recurrence monitoring. If the same parameter combination triggers another alert within the effectiveness window, the CAPA is auto-flagged for re-opening — ensuring throughput loss from recurrent defects is eliminated permanently.
15–25%
Throughput increase achievable when autonomous SPC eliminates manual decision latency on mining conveyor quality monitoring
50–70%
False alarm reduction when autonomous self-tuning limits replace static limits — eliminating throughput loss from unnecessary slowdowns
3–8 min
Per-alert decision latency eliminated by autonomous SPC — quality decisions execute in milliseconds instead of minutes
92%
Defect prediction accuracy achieved by AI-powered SPC analysing hundreds of conveyor process variables simultaneously
What the Plant Executive Dashboard Shows
Throughput View
Live Throughput With SPC Latency Overlay
Current throughput rate displayed alongside SPC decision latency — showing the gap between mechanical conveyor capacity and quality-system-limited throughput. Plant executives see exactly how much throughput is lost to quality decision delays and how much is recovered as autonomous SPC reduces latency.
Capability Summary
Live Cpk, Cp, Pp, Ppk Across All Conveyor Lines
All four capability indices displayed for every conveyor line and quality parameter with trend direction indicators and projected trajectory. Plant executives see capability as a live operational metric, not a periodic report.
COPQ Counter
Real-Time Cost of Poor Quality Tracker
A live counter tracking the cost of quality failures — scrap, rework, throughput loss, and investigation labour — updated with every defect event. Plant executives see the financial impact of quality decisions in real time, enabling data-driven prioritisation of improvement investments.
Alert Credibility
False Alarm Rate and Operator Response Rate
False alarm rate trend with comparative baseline from the static-limits period. Operator response rate to genuine alerts displayed alongside — the metric that shows whether the quality system has earned back the credibility that static limits destroyed.
Limit Activity
Autonomous Limit Change Log With Executive Summary
Every autonomous limit recalculation is logged with trigger event, previous and new values, and statistical rationale. An executive summary shows the number of adjustments per shift, the parameters most frequently adjusted, and the impact on Cpk and throughput.
Audit Readiness
One-Click ISO 9001 Export for Plant Quality Records
Complete quality records — SPC compliance, capability history, CAPA effectiveness evidence, limit change logs — exportable on demand for any date range, product grade, or conveyor line. Audit preparation time drops from days to minutes.
We installed autonomous SPC on our overland conveyor network expecting gradual quality improvement. What we did not expect was the immediate throughput increase. The quality system had been the bottleneck all along — not the conveyor capacity, not the material availability, but the fact that every time an alarm fired, someone had to stop, check the chart, call the shift supervisor, and decide. That cycle took four to seven minutes each time, and it happened twelve to eighteen times per shift. The operators were running the line at 85 percent of mechanical capacity because they knew the quality system could not keep up at full speed. Autonomous SPC eliminated that constraint. Within two weeks, we were running at 96 percent of mechanical capacity, and defect rates had not increased — they had decreased because the system caught true drifts faster than the manual process ever could. Throughput was up 19 percent. The only change was removing the human from the detection cycle.
Throughput on mining conveyor systems is not constrained by belt capacity, motor power, or material handling limits in most operations. It is constrained by the speed at which the quality system can detect, analyse, and respond to process variation. When every SPC alert requires a human to apply Western Electric rules, check limits, and authorise continuation, the conveyor runs at a conservatively reduced speed because no one is confident enough to push it to the mechanical limit. Autonomous SPC eliminates this constraint by running all detection and calculation logic continuously, executing in milliseconds what the quality team takes minutes to decide, and maintaining throughput at the conveyor's mechanical limit — where it belongs.
The documented outcomes from operations that have deployed autonomous SPC are clear: 15 to 25 percent throughput increases without mechanical modifications, 50 to 70 percent false alarm reductions that restore operator alert credibility, and continuous Cpk, Cp, Pp, and Ppk calculations that give plant executives live capability visibility rather than retrospective reports. The throughput gain is not a theoretical projection. It is the measured difference between a conveyor that waits for quality decisions and a conveyor whose quality system executes decisions faster than the belt moves.
iFactory's autonomous SPC platform is designed for plant executives in mining conveyor operations who need to lift throughput without capital expenditure on conveyor upgrades. Book a Demo to see the autonomous SPC engine running on your conveyor system data, or talk to an expert about a free throughput optimisation and COPQ reduction assessment for your mining conveyor quality programme.
Frequently Asked Questions
The autonomous limit engine uses a two-stage statistical confirmation process before any limit recalibration. Stage one detects a significant deviation from the baseline — a shift in mean or variance beyond a configurable threshold, typically 1.5 to 2.5 sigma. Stage two confirms the deviation is sustained across a minimum number of consecutive observations — typically five to ten data points — before the transition window opens. This two-stage gate prevents the system from recalibrating limits in response to transient variation. During the transition window, limits move gradually rather than instantaneously, so the UCL and LCL at any point during the transition represent a conservative position between the old and new baselines. The quality leader can configure both the threshold sensitivity and the transition window duration to match the risk profile of each monitored parameter. Parameters with higher defect impact — belt tension, splice condition, material moisture — can be configured with wider confirmation windows to reduce false negative risk further. Talk to an expert about configuring autonomous limit safety parameters for your conveyor system risk profile.
The executive dashboard displays throughput impact in three formats simultaneously: percentage gain relative to the baseline period, additional tonnes produced per shift and per day, and the financial value of the incremental tonnes calculated at the current product market price. The COPQ (Cost of Poor Quality) counter tracks the total financial impact of quality-related throughput losses — including scrap value, rework cost, investigation labour hours, and lost production opportunity cost — with a before-and-after comparison that shows the financial return generated by autonomous SPC deployment. Plant executives can view COPQ trend by conveyor line, product grade, defect category, and shift. The COPQ data is also available in the audit export format for inclusion in management review presentations and capital justification reports. Book a Demo to see the executive dashboard configured with your production data and product pricing.
No. iFactory's autonomous SPC platform connects to the existing data infrastructure — process historian, LIMS, and vision inspection systems — through standard industrial protocols and API connectors. The platform reads process data from the historian, quality test results from the LIMS, and vision inspection data from the camera system without writing to or modifying the control layer. All autonomous SPC calculations, limit adjustments, and alert generation happen in the iFactory platform layer, not in the PLC or DCS. The control system continues to operate exactly as it did before. The autonomous SPC output — alerts, recommendations, capability data — is delivered to the quality leader and plant executive dashboards and can optionally be written back to the historian for unified data storage. For plants that want closed-loop corrective action, the platform can write setpoint adjustments to the control system through read-only-then-enabled API channels, but this is an optional configuration that requires explicit authorisation from the plant executive and controls engineering team. Talk to an expert about integration requirements for your specific control system architecture.
All Western Electric rules are configurable per parameter, per conveyor line, and per product grade. The standard rule set — zone A violation (one point beyond 3 sigma), zone B violation (two of three consecutive points beyond 2 sigma on the same side), zone C violation (four of five consecutive points beyond 1 sigma on the same side), and trend runs (eight consecutive points on the same side of the centreline) — is enabled by default. Each rule can be individually enabled or disabled, and the violation thresholds — the number of points, sigma distances, and run lengths — can be adjusted. For critical parameters such as belt tension or splice integrity, quality leaders may tighten zone B to one of two points at 2.5 sigma instead of 2 sigma. For lower-risk parameters such as ambient temperature near the conveyor, rules may be relaxed or disabled entirely to reduce alert volume. Rule configuration changes are logged with the user ID and timestamp and appear in the audit trail. Book a Demo to see Western Electric rule configuration for conveyor quality monitoring.
Every Minute Your Quality System Takes to Decide Is a Minute Your Conveyor Runs Below Its Mechanical Limit. Autonomous SPC Eliminates the Delay. Get a Free Throughput and COPQ Assessment.
iFactory's autonomous SPC platform for mining conveyor plant executives — self-tuning control charts with Western Electric rules, continuous Cpk/Cp/Pp/Ppk calculation, multivariate drift detection, vision inspection integration, closed-loop CAPA tracking, and ISO 9001-aligned audit documentation generated automatically from the quality data your process already produces.