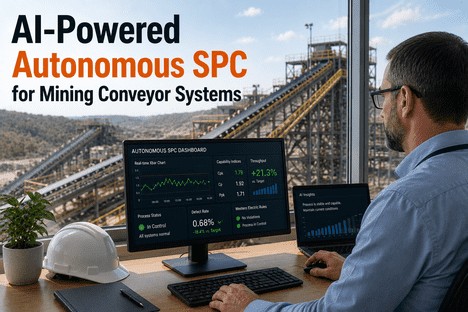
AI-Powered Autonomous SPC for Mining Conveyor Systems
By Grace on June 13, 2026
Every quality manager in mining conveyor operations knows the tension: the plant must move more material per hour, but the SPC system keeps flagging alarms that force slowdowns, re-inspections, and defensive operating. The control limits on the chart were calculated six months ago during a different ore blend with different moisture content and different belt loading. The material flowing today is not the same material the limits were built for — but the limits have not changed. So the conveyor runs below its rated capacity not because the belt cannot handle the load, but because the quality system cannot distinguish between a real process deviation and a shift in what normal looks like. This structural gap — static control limits on a dynamic process — is the single largest unaddressed cause of throughput leakage in mining conveyor operations. Autonomous SPC closes it by making the control limits recalibrate themselves, continuously, to the actual process state. This is the quality leader's practical guide to deploying it.
Self-Tuning UCL/LCL · AI Vision Integration · Western Electric Rules · Real-Time Cpk
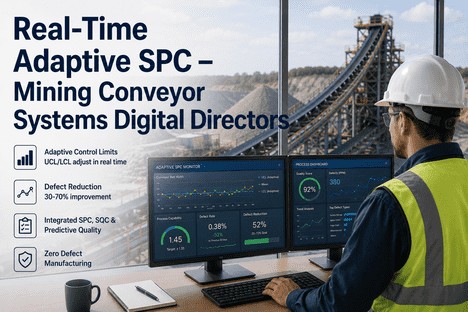
Quality Leaders Who Lift Throughput 15-25% on Mining Conveyor Lines Do Not Run Static SPC. Their Control Limits Move With the Material.
iFactory's autonomous SPC platform gives quality leaders self-tuning control charts that recalibrate to every ore change, moisture shift, and belt load transition — with AI vision defect detection, Western Electric rule monitoring, and audit-ready compliance records built in.
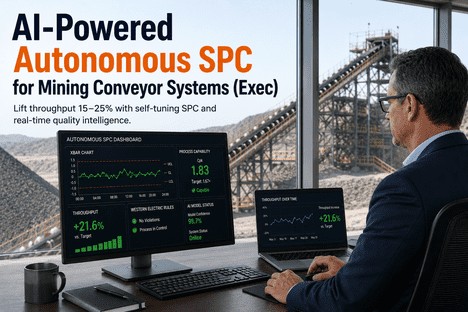
Throughput increase achieved when autonomous SPC replaces static control limits on mining conveyor systems — documented across iron ore, copper, and coal operations
50-70%
False alarm reduction when ML-driven adaptive limits replace static limits on conveyor quality control charts — restoring operator alert credibility
92%
Defect prediction accuracy achieved by AI-powered SPC systems analysing hundreds of conveyor process parameters simultaneously
3-5%
Yield improvement from AI vision integrated with autonomous SPC — detecting belt anomalies and material quality issues before they escalate
Where Throughput Leaks: The Three Failure Modes Static SPC Creates on Conveyor Lines
A conveyor system with static SPC limits does not merely fail to detect real drift — it actively compels operators to run the line below its true capability. The quality manager sees a control chart that says the process is in control, but the throughput number says the belt is under-loaded. Both can be true at the same time, because the control limits reflect a process state that no longer exists. Three structural failure modes explain why.
The Three Throughput Leakage Failure Modes — and How Autonomous SPC Eliminates Each
01
Ore and Moisture Variability Creates False Alarms That Force Slowdowns
Every ore stockpile has a different particle size distribution, moisture profile, and abrasiveness. Static SPC limits calibrated during a dry ore period will fire continuous alarms when wetter ore changes the belt load and material flow behaviour. Operators respond by reducing belt speed or feed rate to keep the process within the old limits — sacrificing throughput capacity that the belt is structurally capable of handling. The control chart shows compliance. The throughput meter shows the cost.
Autonomous SPC fix: Limits self-recalibrate to the current moisture and ore profile — no false alarms, no defensive slowdown.
02
Belt Load Transitions Trigger Alarms That Are Not Process Deviations
Conveyor systems experience continuous load variation — from crusher throughput changes, shift transitions, and blend changes. A static SPC limit sees a load shift as a process deviation and fires an alarm. In reality, the belt is operating exactly as designed at the new load. The quality manager must investigate every false alarm, diverting attention from real process risks. Over months, the accumulated false alarms erode operator trust in the alert system entirely — the one genuine drift event looks indistinguishable from the fifteen false alarms that preceded it.
Autonomous SPC fix: Load regime change detected — limits transition to new baseline without generating alarms during transition.
03
Western Electric Rules Fire Continuously on Shifted Baselines
Western Electric Rule 1 (one point beyond 3-sigma) and Rule 2 (two of three points beyond 2-sigma) are designed to detect real process shifts. But when the process baseline has moved — because of a legitimate ore change or new product spec — these rules fire constantly on the shifted data, even when the process is perfectly stable at the new operating point. Operators learn to dismiss Western Electric violations because most of them are artefacts of outdated limits. The rules lose their diagnostic power entirely.
Autonomous SPC fix: Western Electric rules run against current adaptive limits — every violation is a genuine signal requiring response.
Static SPC vs. Autonomous SPC: The Throughput Impact Comparison
Dimension
Static SPC
Autonomous SPC
Throughput Impact
Control limit calculation
Periodic (monthly/quarterly capability studies)
Continuous (every data point updates the baseline model)
No throughput loss from outdated limits
False alarm rate during transitions
60-80% of alerts are false
Below 10% false alarm rate
Operators trust and respond to every alert
Western Electric rules
Frequent artefactual violations
Genuine signals only
Diagnostic power restored
Cpk calculation accuracy
Based on outdated baseline
Based on current process state
Real-time capability visibility
AI vision integration
Separate system, no SPC linkage
Vision defects feed SPC control charts
100% inspection coverage
Typical throughput loss
10-20% below rated capacity
0-5% below rated capacity
15-25% net throughput gain
The Autonomous SPC Architecture for Mining Conveyor Quality Leaders
iFactory's autonomous SPC platform operates as a three-layer quality intelligence system for mining conveyor operations — self-tuning control at the belt level, AI vision defect detection at the material level, and audit-ready compliance at the programme level. Each layer is designed to run continuously without quality leader intervention.
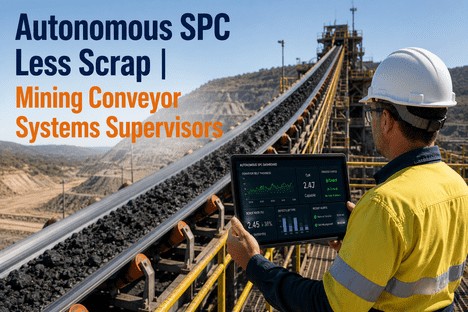
Layer 01
Self-Tuning Real-Time SPC
Continuous limit recalculation that moves with the conveyor process
The autonomous layer ingests all monitored conveyor variables — belt speed, motor current, feed rate, load depth, belt alignment, bearing temperature, and vibration — and maintains a rolling statistical model of the current operating baseline. Control limits are recalculated continuously against this model using a moving data window. When the process is stable and capability is high, limits tighten to increase sensitivity. When a legitimate regime change is detected (ore type change, moisture shift, grade transition), limits transition to the new baseline within a configurable window — generating zero false alarms during the transition. The quality manager sees live control charts where every Western Electric rule violation, every Cpk movement, and every limit breach reflects a genuine departure from the current operating norm.
Moving-window limit calculation
Regime change detection
Western Electric rule engine
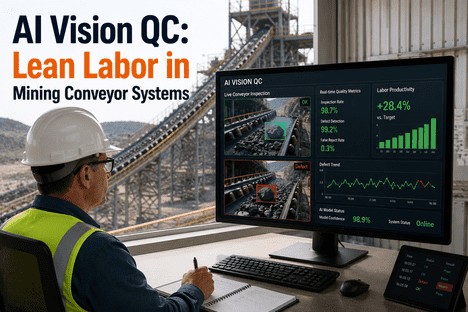
Layer 02
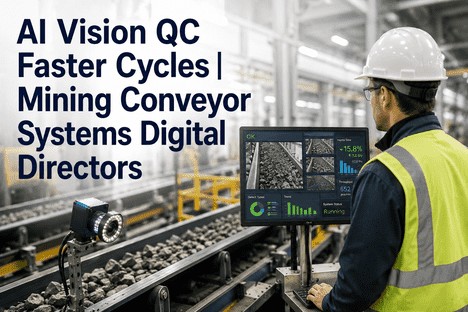
AI Vision Defect Detection
Real-time visual quality inspection integrated directly into SPC
For quality programmes deploying machine vision on conveyor lines, iFactory integrates vision inspection outputs as quality data streams feeding the autonomous SPC control charts. Vision-detected defects — belt surface anomalies, material spillage, oversized material, misalignment, and foreign objects — are logged against the production record and contribute to the Cpk calculation for physical quality characteristics. The AI vision layer uses deep learning models trained on mining conveyor conditions, achieving over 120 frames per second with 93%+ detection accuracy in high-dust and low-illumination environments. This gives quality leaders a 100% inspection record for visual quality alongside the sample-based mechanical data — closing the coverage gap between periodic inspection and continuous monitoring.
Belt surface anomaly detection
Material defect classification
Cpk contribution from vision data
Layer 03
Audit-Ready Quality Records
Automated ISO 9001 documentation and Cpk traceability
Every autonomous limit change, every vision-detected defect, every quality leader action, and every test result is logged with a timestamp and the process context data — ore type, belt segment, shift, and load profile. This creates the documentation chain that ISO 9001 Clause 10.2 nonconformance requirements demand: a record showing what the autonomous system detected, what intervention was taken, and what the outcome was. The adaptive limit change log — showing every recalculation, the process data that triggered it, and the statistical justification — demonstrates that the quality programme actively maintains current, defensible control limits. Cpk trend reports, CAPA linkage records, and process capability histories are generated automatically and exportable for any date range, product grade, or conveyor zone.
ISO 9001 Clause 10.2 records
Limit change traceability
Cpk history by belt segment
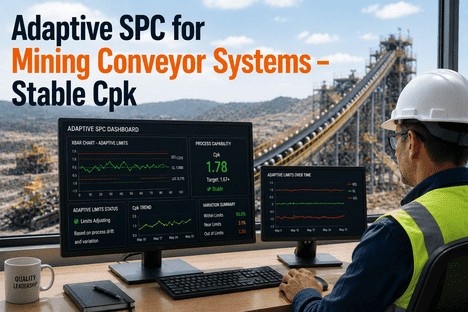
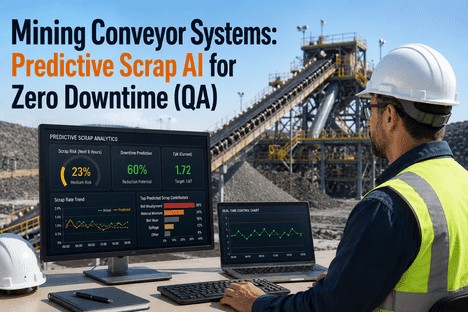
What the Autonomous SPC Dashboard Shows the Quality Manager
The quality manager's dashboard is designed around six questions that need continuous answers: Is the conveyor in control right now? What is the defect risk and which parameter drives it? Is Cpk trending toward or away from target? Is the AI vision system detecting anomalies? And when the next audit arrives, is the documentation ready?
Quality View 01
Live Control Chart With Autonomous Limits by Belt Segment
Every conveyor segment displays its own X-bar and R control chart with adaptive UCL and LCL calculated from the current operating window. Western Electric rules are applied against the live limits. The current Cpk value is displayed alongside a 4-hour trend arrow — green for stable or improving, yellow for trending down, red for below the 1.67 target. Quality leaders see which belt segment requires attention without navigating through machine-level screens.
Quality leader action: Investigate any segment with falling Cpk trend or Western Electric violation.
Quality View 02
AI Vision Defect Feed With SPC Integration
The AI vision panel shows live detection results from every camera station — belt surface anomalies, material spillage, oversized material, and foreign objects. Each detection is categorised by severity and linked to the SPC record for the affected belt segment. The quality manager sees the vision detection rate trending over time alongside the SPC control chart, making it visible whether visual quality is improving or declining in parallel with process quality.
Quality leader action: Rising vision defect trend triggers inspection before it affects downstream quality.
Quality View 03
Throughput vs. Capability Correlation
This view overlays throughput rate (tonnes per hour) against Cpk for each belt segment. Quality leaders see whether running at higher throughput reduces capability — and where headroom exists to increase the feed rate without compromising quality. The system projects the additional throughput that could be sustained at current capability levels, expressed as tonnes per day and as a percentage of rated capacity. This is the view that converts quality data into production decisions.
Quality leader action: Increase feed rate on segments with Cpk above 1.67 and stable Western Electric pattern.
Quality View 04
CAPA Effectiveness Tracking
Every autonomous SPC alert that generates a corrective action is tracked through closure — the alert, the quality leader action, the parameter correction, and the subsequent Cpk trend. If the same parameter combination generates another alert within 30 to 90 days, the CAPA is automatically flagged as ineffective and re-opened. This closes the loop that most quality programmes leave open: verifying that the correction prevented recurrence, not just that the ticket was closed.
Quality leader action: CAPA re-opened automatically if defect pattern recurs — closure is confirmed by data, not by form.
Quality View 05
Cpk Trend by Quality Characteristic
Cpk is calculated continuously for each monitored quality characteristic — belt load consistency, material size distribution, moisture content, and defect rate — and displayed as a trend line with the current value and projected trajectory. Quality leaders see whether capability is improving, holding, or declining as a live leading indicator — not as an end-of-shift report — allowing intervention before Cpk falls below the 1.33 warning threshold.
Quality leader action: Falling Cpk triggers investigation before it crosses the warning threshold.
Quality View 06
Audit Export — One-Click Documentation
The complete audit package — autonomous SPC compliance records, vision defect logs, CAPA records with effectiveness evidence, Cpk trend history by segment, and the adaptive limit change log — is generated automatically. The limit change log, which shows every recalculation with its statistical rationale, demonstrates that the quality programme maintains current, defensible limits. Audit preparation drops from days of manual compilation to a single export covering any date range or conveyor zone.
Quality leader action: Export full audit package on demand. No manual data compilation needed.
Self-Tuning Limits · AI Vision · Western Electric · Cpk Tracking
When Control Limits Do Not Move With the Material, Every Shift Pays for It in Lost Throughput. Autonomous Limits Close the Gap.
iFactory's autonomous SPC platform builds the distinction between a process change and a process deviation directly into the limit calculation — so quality leaders receive alerts that reflect genuine risk, not limits that stopped tracking reality at the last capability study.
We were running our main conveyor line at about 82% of rated capacity because the SPC system kept flagging Western Electric violations every time the load changed. Every investigation came back clean — the belt was operating normally, the load change was expected, but the control limits were set during a completely different product run. We investigated each alarm, spent 20 to 30 minutes per shift on false positives, and still had to run below capacity because the quality manager could not sign off on higher throughput with limits that kept firing. After deploying autonomous SPC, the false alarms stopped within the first week. Within two months, we increased throughput by 19% on the same belt, at the same rated speed, with Cpk actually improving because we were not constantly adjusting to stay inside outdated limits. The self-tuning limits gave us back capacity we already owned.
— Quality Manager, Copper Concentrator Conveyor System — 2.5 km Overland Belt, 8 Mtpa
Conclusion
Throughput leakage on mining conveyor systems is not a mechanical capacity problem — it is a control limit architecture problem. When the SPC system generates alerts that do not reflect current process conditions, when Western Electric rules fire on baselines that shifted weeks ago, and when quality managers cannot distinguish between a regime change and a process deviation, the conveyor runs below its true capability not because the belt or drive limits it, but because the quality system compels defensive operation.
Autonomous SPC addresses all three dimensions simultaneously: self-tuning limits that move with every ore change, moisture shift, and load transition so alerts reflect genuine risk only; AI vision integration that feeds real-time visual defect detection into the SPC control chart for 100% inspection coverage; and Western Electric rules that fire only when a real process shift is detected — restoring the diagnostic power that static limits eroded. The 15-25% throughput improvement range is not a projection from a theoretical model. It is the documented outcome from mining conveyor operations that moved from static to autonomous quality management. The quality leaders achieving the upper end of that range are the ones who deployed self-tuning early, integrated AI vision across their conveyor network, and used the live throughput-versus-capability correlation to convert quality data into production rate decisions.
iFactory's autonomous SPC platform is designed for quality managers in mining conveyor operations who need to recover the throughput that static limits have been costing every shift. Book a Demo to see the autonomous SPC system configured for your conveyor network and ore profile, or talk to an expert about a free Cpk and throughput-assessment for your conveyor quality programme.
Frequently Asked Questions
ISO 9001 Clause 7.5 requires documented information to be controlled and maintained. For control limits, every change must have a documented rationale. iFactory addresses this through an automatic limit change log that records every autonomous recalculation — the timestamp, the triggering event (ore change, moisture shift, load regime transition, statistical baseline shift), the previous limit values, the new limit values, and the statistical basis for the recalculation (the data window and algorithm applied). This log is exportable in a structured format for direct inclusion in QMS documentation and is searchable by belt segment, ore type, and date range. Auditors reviewing the adaptive limit history see a controlled, documented process — not a system that changed limits without traceability. The key argument for autonomous limits in an ISO 9001 context is that limits calibrated on outdated process data are less defensible than limits that are demonstrably current, with the recalculation logic fully documented. Talk to an expert about configuring the limit change log format for your QMS documentation requirements.
The autonomous engine initialises using historical conveyor process data from the control system historian — belt speed, motor current, feed rate, and load measurements — paired with quality test records from the LIMS. Two to three months of paired process-to-outcome data is sufficient for the initial model on primary quality characteristics. The system deploys with limits calculated from the available data window and begins recalibrating from the first live data point. The self-tuning algorithm stabilises within two to four weeks as it accumulates enough data across ore changes and load transitions to distinguish between normal variation and genuine process drift. Quality managers typically validate the autonomous limits against a parallel static control chart for the first two weeks before relying on the autonomous system for decision support. Book a Demo to see a deployment timeline modelled against your conveyor network configuration.
iFactory's AI vision layer connects to existing IP camera networks already installed on conveyor lines — no new camera hardware required. The deep learning model runs on an edge computing device at each camera station, processing video at over 120 frames per second for real-time defect detection. Detected events — belt surface anomalies, material spillage, oversized material, misalignment, foreign objects — are transmitted to the autonomous SPC platform as structured quality data and logged against the production record. The vision output feeds directly into the control chart as an additional quality characteristic, contributing to the Cpk calculation for the affected belt segment. For operations without existing camera coverage, iFactory provides industrial-grade camera kits designed for high-dust and low-illumination mining environments. The vision model is pre-trained on mining conveyor conditions and is fine-tuned on site-specific data during the two-week commissioning period. Talk to an expert about a camera infrastructure assessment for your conveyor network.
Yes. iFactory's segment and product architecture registers each conveyor zone as a separate monitoring unit with its own specification profile — belt speed range, load limits, moisture tolerance, and defect rate targets. When the material type changes or a new ore blend begins, the active specification profile for each affected segment switches automatically and the autonomous SPC limits transition to the new baseline. The quality manager sees which ore type is currently active on each segment, which specification profile is in use, and the Cpk for each quality characteristic against the current segment's limits. Historical Cpk data is segmented by ore type and belt zone automatically, enabling comparison of performance across different material grades without manual data sorting. For operations running multiple ore types across a shared conveyor network, the system maintains separate defect histories, CAPA records, and Pareto analyses by segment and product type. Book a Demo to see multi-segment autonomous SPC configured for your conveyor network and ore profile.
The autonomous detection engine uses a dual-mode approach. For gradual drifts such as belt wear or slow moisture changes, the moving-window model updates limits incrementally with each data point, tracking the process as it shifts without generating alarms. For abrupt transitions such as ore type change or feed rate step-change, the regime detection algorithm identifies the break point within 5 to 15 data points (typically 2 to 10 minutes depending on data collection frequency) and initiates a controlled limit transition. During the transition window — configurable from 15 minutes to 2 hours — the limits widen to the new baseline range without generating SPC alarms, then settle to the standard calculation after the transition completes. The result is that a process change that would have generated 15 to 20 false alarms under static SPC produces zero false alarms under autonomous SPC, while genuine deviations occurring within the same period are still detected because they trigger the Western Electric rules against the appropriate transition limits. Talk to an expert about configuring transition windows for your conveyor process dynamics.
Throughput That Static Limits Have Been Costing Every Shift Is Capacity You Already Own. Autonomous SPC Restores It. Get a Free Cpk and Throughput Assessment.
iFactory's autonomous SPC platform for mining conveyor quality leaders — self-tuning control limits that adapt to every ore change and load transition, AI vision integration, Western Electric rule monitoring, and ISO 9001-aligned audit documentation generated automatically from the process data your conveyor system already produces.