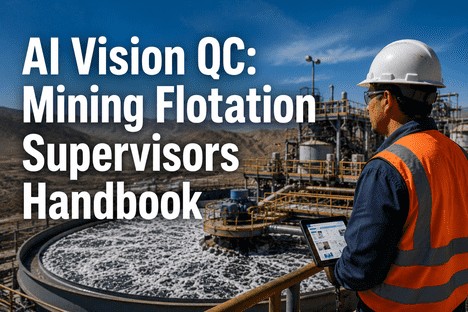
AI Vision QC: Mining Flotation Supervisors Handbook
By Grace on June 9, 2026
The shift supervisor stands at the control room window, watching the froth on cell 4. The colour is different from the morning shift — slightly darker, with smaller bubbles clustering near the launder. The supervisor calls the operator to take a froth sample and send it to the lab. Forty-five minutes later, the assay result confirms what the supervisor suspected from the froth appearance: the concentrate grade has dropped. The reagent addition rate needs adjustment. But forty-five minutes have passed, and in those forty-five minutes the circuit has been producing off-grade concentrate. This is the cycle time problem in flotation quality control — not that the lab results are wrong, but that the time between observing a froth condition and acting on the quality data is measured in hours when the process changes in minutes. AI vision quality inspection for mining flotation changes this by measuring froth characteristics optically at every cell, in real time, and delivering quality data to the supervisor's dashboard within the same second the froth image is captured.
AI Vision Quality · Froth Image Analysis · Real-Time Grade Inference · Cycle Time Optimisation
You See the Froth Change at 09:00. The Lab Result Arrives at 09:45. AI Vision Delivers It at 09:00 — While You Can Still Act.
iFactory's AI vision quality platform captures froth images at every flotation cell and analyses bubble size, froth colour, velocity, stability, and texture in real time — inferring concentrate grade and recovery instantly, and cutting the quality feedback cycle from 45 minutes to under 3 seconds.
Cycle time compression from quality observation to corrective action when AI vision replaces manual froth sampling and lab assay waiting time
45 min
Average time from froth sample collection to lab assay result — during which the circuit continues producing at unknown quality
6
Froth parameters measured simultaneously by AI vision on every cell — bubble size, froth velocity, colour, stability, texture, and depth
3 sec
Time from froth image capture to quality data on the supervisor dashboard — instant feedback that enables corrective action within the same process minute
The 6 Froth Parameters AI Vision Measures — and What Each Tells You About Quality
Froth surface characteristics are the visible expression of everything happening inside the flotation cell — reagent conditioning, aeration efficiency, particle attachment, and mineral liberation. Experienced operators read these froth features intuitively, but no human can measure them consistently across six cells, eight hours, and every shift. AI vision measures all six parameters on every cell, every second, with the same consistency at 06:00 as at 02:00.
Bubble Size Distribution
2.8 mm
Mean bubble diameter and distribution width. Smaller bubbles indicate better aeration and higher surface area for particle collection. Distribution widening signals changes in frother concentration or air distribution.
Speed at which froth moves across the cell surface toward the launder. Velocity correlates directly with mass pull rate. Increasing velocity signals rising recovery — and potentially entrainment if too high. Decreasing velocity indicates froth mobility issues.
Correlates with: Mass pull rate, air recovery, concentrate removal efficiency
Froth Colour
Dark grey
Froth colour is the visual signature of mineral composition at the surface. Darker froth typically indicates higher concentrate grade in base metal flotation. Colour shifts signal changes in feed mineralogy, reagent conditioning, or pulp chemistry.
Correlates with: Concentrate grade, mineral type, pulp chemistry conditions
Froth Stability
82%
Froth stability index — a measure of bubble persistence and froth structure integrity. High-stability froth holds mineralised bubbles at the surface for longer, improving recovery. Sudden stability drops indicate reagent imbalance or feed disturbance.
Surface texture indicates the loading state of bubbles — whether they carry a heavy, medium, or light mineral load. Highly textured froth (irregular, dimpled surface) indicates heavily loaded bubbles and efficient collection. Smooth, glossy froth indicates low loading and potential recovery loss.
Correlates with: Bubble loading, particle attachment efficiency, collection zone performance
Froth Depth
180 mm
Froth depth measured from the cell lip. Deeper froth provides more drainage zone for entrained gangue particles to return to the pulp — improving concentrate grade but reducing recovery if too deep. Shallow froth increases mass pull but can reduce grade through entrainment.
Correlates with: Concentrate grade, entrainment rate, mass pull, recovery
Cycle Time Compression: From 45 Minutes to 3 Seconds — the Quality Feedback Loop
The difference between manual froth sampling and AI vision quality inspection is not a technology choice. It is a time choice. Every minute the supervisor waits for a lab assay result is a minute the circuit operates on estimated quality at best — and on no quality data at all at worst. The cycle time compression from AI vision changes the supervisor's ability to act on quality data from reactive to proactive.
Standard QC Cycle — Manual Froth Sampling and Lab Assay
01
Supervisor observes froth change visually
0 min
02
Operator collects froth sample from the cell
+5 min
03
Sample transported to laboratory
+10 min
04
Sample preparation and assay analysis
+30 min
05
Result reported to supervisor dashboard
+45 min
45 minutes
From froth change to quality data — off-grade concentrate produced during the entire interval
AI Vision QC Cycle — Instant Optical Quality Inference
01
Camera captures froth image at the cell
0 sec
02
Deep learning model analyses 6 froth parameters
+1.5 sec
03
Grade and recovery inference generated
+2 sec
04
Result displayed on supervisor dashboard
+3 sec
3 seconds
From froth image to quality data — corrective action possible within the same process minute
Supervisor Dashboard: AI Vision Quality View — What Changes on the Screen
The supervisor dashboard does not replace the operator's froth observation. It augments it with quantitative data that no human eye can measure consistently — bubble size in millimetres, froth velocity in millimetres per second, stability index as a percentage, and inferred grade and recovery in real time. The supervisor sees every cell, every parameter, every second.
Dashboard Panel 01
Live Froth Parameter Display — All Six Parameters per Cell
Each flotation cell displays its current froth parameter readings in a compact dashboard card: bubble size distribution as a real-time histogram, froth velocity as a digital readout with trend arrow, froth colour index as a spectral indicator, stability as a percentage bar, texture classification as a label, and froth depth as a level reading. The supervisor sees every cell on a single screen, with any parameter that exceeds its threshold highlighted in amber or red — immediately visible without scrolling through individual charts.
Supervisor action: Scan the parameter cards for amber or red highlights — investigate cells with threshold-exceeding parameters.
Dashboard Panel 02
Inferred Grade and Recovery Trend — Live Quality Data
The AI vision model infers concentrate grade and recovery from the froth parameter combination at each cell, displaying the results as a live trend line. The supervisor sees whether grade is holding, rising, or dropping — updated every 3 seconds, not every 45 minutes. When the inferred grade begins to drift, the trend line changes colour from green to amber, giving the supervisor a 15-to-30-minute earlier warning compared to waiting for the next lab assay cycle.
Supervisor action: Monitor grade trend for amber shift — adjust reagent or air before grade deviation reaches the lab-reportable threshold.
Dashboard Panel 03
Parameter Deviation Alert — Froth Condition Flags
Each froth parameter has an expected range derived from historical data for the current operating regime. When a parameter exceeds its expected range — bubble size growing beyond the aeration efficiency window, froth velocity dropping below the mass pull target, stability falling below the froth persistence threshold — the dashboard flags the deviation with a cell identifier, the affected parameter, the current reading, and the deviation magnitude. The supervisor sees not just that something is wrong, but exactly which froth characteristic is out of range and by how much.
Supervisor action: Review flagged parameter — correlate with operator observation and determine corrective action from the deviation context.
Dashboard Panel 04
Cycle Time Savings Counter — Real-Time Impact Display
A live counter displays the cumulative cycle time savings achieved this shift: minutes of quality feedback waiting time eliminated by AI vision versus the standard lab assay cycle. The counter updates with every froth image analysed. After one shift, the counter might read "4.5 hours of cycle time saved today — equivalent to 6 lab assay cycles eliminated." After one month, "95 hours returned to proactive quality management — time that would have been spent waiting for assay results."
Supervisor action: Review cycle time savings — include in shift handover and use as evidence for expanding AI vision coverage to additional cells.
"
Before the AI vision system, my quality data came in batches. I would see a froth change at 09:00, send a sample, and get the result at 09:45. If the grade was off, I had already been running off-grade for 45 minutes. I was managing quality through the rear-view mirror. Now I watch the dashboard and see the inferred grade updating every three seconds. When the bubble size on cell 3 starts to shift at 09:00, the grade trend changes colour at 09:00 — not at 09:45. I adjust the air rate at 09:01. The froth returns to target at 09:03. The lab assay at 09:45 confirms the grade held. That is not a faster lab. That is a different quality model — one where the time between detection and correction is measured in seconds, not in the time it takes to walk a sample to the lab.
Where the 10–20% Cycle Time Improvement Comes From — a Breakdown
The cycle time improvement from AI vision quality inspection is not a single event. It accumulates across every quality feedback loop in the flotation circuit — from the moment a froth condition changes to the moment the corrective action is taken. The table below traces the quality cycle time for a typical flotation grade deviation event, showing where every minute of improvement is earned.
Quality Feedback Cycle Time: Manual Lab Assay vs AI Vision Inference
Cycle Step
Manual Lab Assay
AI Vision Inference
Froth condition detection
Visual observation — immediate, but subjective and inconsistent between operators and shifts
Optical capture and analysis — immediate, objective, and consistent across all cells and shifts
Quality data generation
30–45 min — sample collection, transport, preparation, assay analysis, result reporting
5–10 min — reviewing assay result, cross-referencing with cell conditions, deciding on action
Under 1 min — froth parameter deviation already visible; supervisor confirms and acts from trend context
Corrective action
5–10 min — contacting operator, providing adjustment instruction, confirming change
2–5 min — action taken while quality feedback loop remains live; supervisor sees adjustment effect on froth parameters within seconds
Manual Lab Assay Cycle Time
45–65 min
From froth condition observation to corrective action — includes sample collection, transport, lab analysis, and response
AI Vision Inference Cycle Time
3–8 min
From froth image capture to corrective action — includes AI inference, supervisor decision, and adjustment confirmation
Conclusion
Flotation quality control cycle time is not limited by the speed of laboratory analysis. It is limited by an operating model in which the only reliable quality data comes from a process that takes 45 minutes from froth observation to assay result, and in which every minute of that cycle is a minute the circuit operates on estimated quality. No supervisor can close that feedback gap with faster sample transport or priority-labelling assay requests. The gap is structural — the cycle was designed for a time when optical froth analysis did not exist.
AI vision quality inspection closes the gap by measuring froth characteristics optically at every cell in real time — bubble size, velocity, colour, stability, texture, and depth — and inferring concentrate grade and recovery from the combined parameter set. The quality feedback cycle compresses from 45 minutes to 3 seconds. The supervisor does not wait for a lab result. They watch the froth parameter trend on the dashboard and see the grade inference update with every new image. When a parameter shifts, the trend changes colour at the same second the froth changes — not 45 minutes later. The corrective action happens within the same process minute, not the same shift.
iFactory's AI vision quality platform is built for flotation supervisors who need quality data at the speed of the process — not the speed of the laboratory. Book a Demo to see how froth image analysis infers grade and recovery in real time on your circuit, or talk to an expert about configuring AI vision quality for your cell layout, froth characteristics, and cycle time targets.
Frequently Asked Questions
The AI vision model uses a convolutional neural network trained on thousands of froth images correlated with their corresponding laboratory assay results. The model learns the relationship between froth surface characteristics — bubble size, colour, velocity, stability, texture, and depth — and the actual concentrate grade and recovery measured by the lab. Once trained, the model infers grade and recovery from new froth images alone, without requiring simultaneous lab assays. Typical inference accuracy ranges from R² of 0.85 to 0.95 for grade prediction and 0.80 to 0.92 for recovery prediction, depending on the circuit complexity and the diversity of the training dataset. The model is recalibrated periodically against lab assay results to maintain accuracy as ore characteristics change over time. The AI vision output is not a replacement for laboratory assays — it is a real-time proxy that reduces the cycle time between froth observation and quality data from 45 minutes to 3 seconds, while lab assays continue to serve as the primary reference standard for calibration and verification. Talk to an expert about model accuracy expectations for your specific ore type and circuit configuration.
The camera housing and lighting system are designed specifically for the flotation plant environment. Each camera is mounted in a sealed, pressurised enclosure with integrated LED lighting that provides consistent illumination regardless of ambient plant lighting conditions. The lighting wavelength and angle are configured to penetrate steam and minimise glare from the froth surface. The image acquisition system includes automatic exposure adjustment and image quality validation — if an image does not meet quality thresholds due to steam obscuration, lens contamination, or lighting failure, the system flags the quality issue and continues capturing at the next interval. The froth parameter extraction model includes preprocessing layers that normalise image characteristics across lighting and atmospheric conditions, ensuring that froth colour and texture measurements remain consistent through ambient changes. Book a Demo to see how the imaging system handles real plant conditions in your operating environment.
The system is designed to work with dedicated froth cameras optimised for the specific imaging requirements of flotation froth analysis — controlled lighting, consistent camera angle, high capture rate, and industrial environmental protection. While the system can technically ingest video from existing plant cameras, the image quality, lighting consistency, and capture rate from general-purpose surveillance cameras are typically insufficient for reliable froth parameter measurement and grade inference. The standard deployment includes purpose-built camera units mounted at each monitored cell, integrated with the controlled lighting system and connected to the analysis server. Each camera unit is installed during a scheduled maintenance window without disrupting production, and the system is operational from the moment the first validated image is captured. Talk to an expert about camera mounting requirements and installation planning for your cell layout.
The model training process requires a minimum of 2,000 to 5,000 froth images with corresponding laboratory assay results covering the expected operating range of the circuit — including different ore types, reagent regimes, cell operating conditions, and froth states. Image collection and assay correlation typically takes 30 to 60 days of production operation, during which the camera system is installed and collecting images while the existing quality control process continues in parallel. The model is trained incrementally as correlated image-assay data accumulates. After the initial training dataset is collected, model training and validation takes approximately two to four weeks. The model is then deployed in shadow mode for two to four weeks, where its grade and recovery inferences are compared against lab assay results without driving operator actions. Once the shadow mode validation confirms acceptable accuracy, the model is activated for live use. Book a Demo to see the training and validation timeline configured for your circuit's data availability.
The Quality Data You Need Arrives in 45 Minutes. The Process Changes in Seconds. AI Vision Closes That Gap.
iFactory's AI vision quality platform measures six froth parameters on every flotation cell in real time — bubble size, velocity, colour, stability, texture, and depth — inferring concentrate grade and recovery from every image and cutting the quality feedback cycle from 45 minutes to 3 seconds.