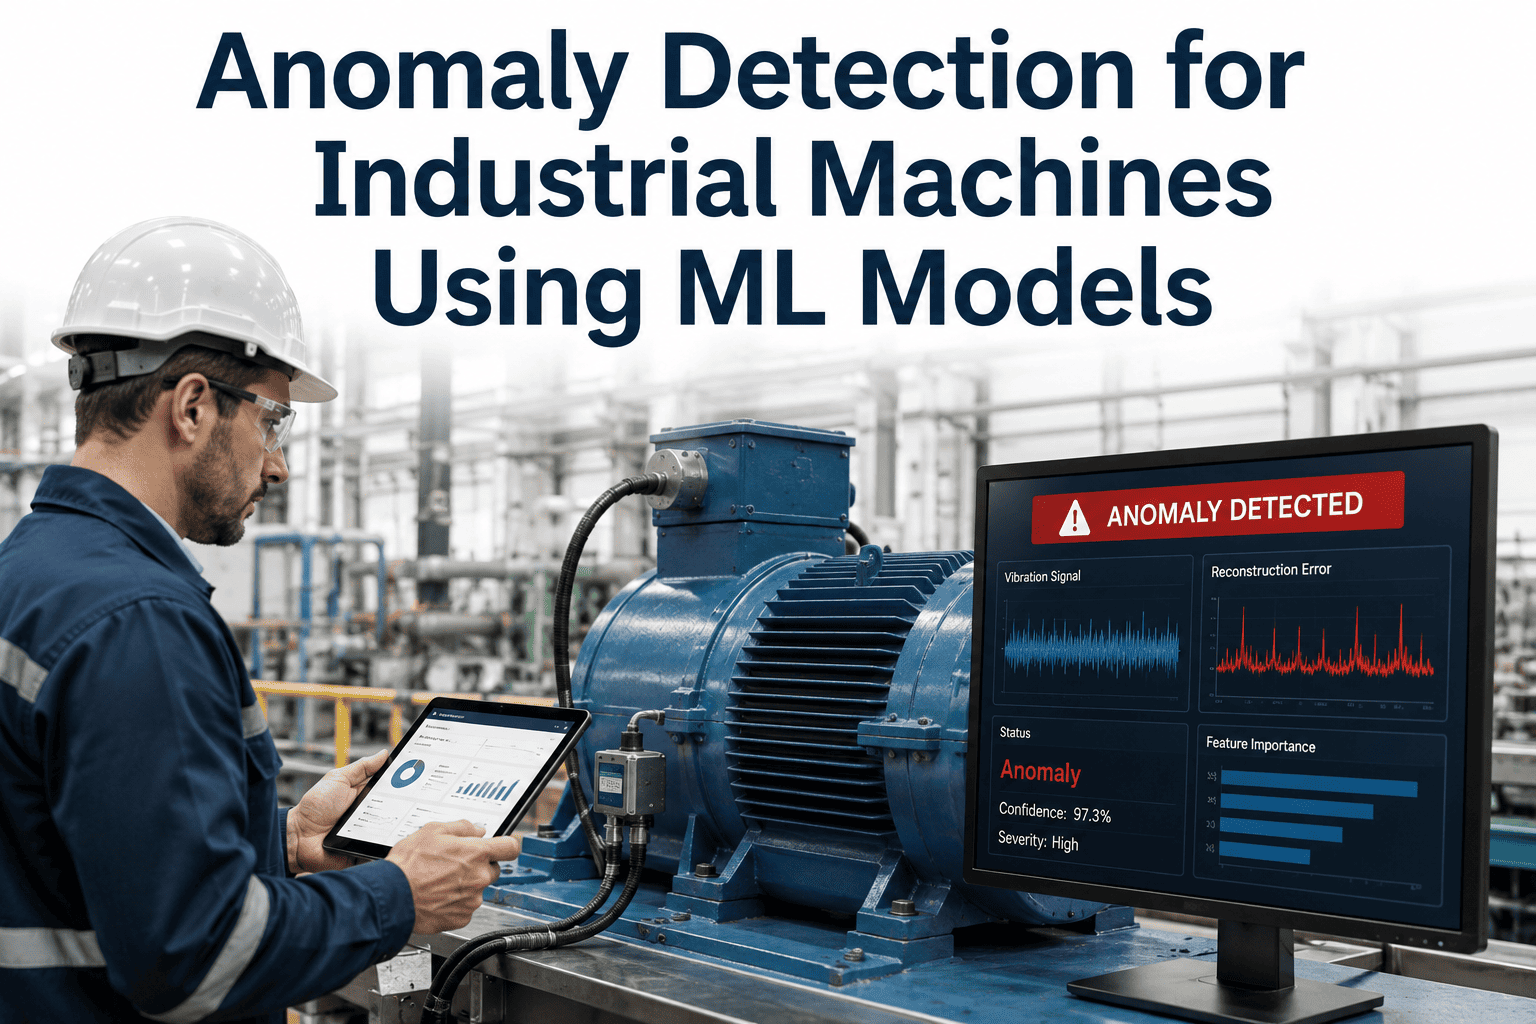
Every reliability engineer has seen the same failure pattern: a machine runs within normal parameters on every individual sensor reading, right up until it doesn't. Vibration looks fine. Temperature looks fine. Current draw looks fine. Then a bearing seizes, and in hindsight the signals were subtly drifting out of their normal relationship to each other for weeks. Threshold-based alarms cannot catch that pattern, because no single value ever crossed a limit. Anomaly detection models built on unsupervised machine learning can, because they learn what "normal" looks like across dozens of correlated signals at once, not one variable in isolation. Book a demo to see this running against your own equipment's historical data.
Why Threshold Alarms Miss What Anomaly Detection Catches
Traditional SCADA alarms work on fixed or statistical thresholds applied to a single tag: vibration above X, temperature above Y. This approach works well for hard failures but is structurally blind to the multivariate drift that precedes most bearing, motor, and pump failures. A model trained on the joint distribution of dozens of signals can detect that the relationship between two variables — say, current draw relative to load, or vibration relative to speed — has shifted, even when each individual value remains inside its normal range. This is the core distinction reliability engineers need to internalize before evaluating any anomaly detection platform: the value is not in watching more tags, it is in watching the relationships between tags that a human reviewing a trend screen would never think to compare.
The Four ML Model Families Used in Industrial Anomaly Detection
Not every anomaly detection approach fits every asset type. Reliability teams typically deploy a mix of model families depending on the signal type, the amount of historical data available, and whether failure examples exist to train against.
Signals Reliability Teams Feed Into Anomaly Models
Model accuracy depends heavily on signal quality and breadth. The most effective deployments combine several signal categories rather than relying on a single sensor type, since failure precursors often show up first as a relationship shift between two unrelated-seeming variables. A plant that only instruments vibration, for example, will miss electrical-signature failure modes entirely, even though both are relatively inexpensive to add to an existing PLC or SCADA integration.
What a Deployment Actually Looks Like on the Floor
Reliability engineers evaluating anomaly detection platforms are usually less interested in the underlying math and more interested in what changes in their daily workflow. In practice, the deployment sequence follows a consistent pattern across most plants, regardless of asset type or industry vertical, and understanding the sequence up front helps set realistic expectations with plant leadership about when the first meaningful alerts will actually arrive.
Model Accuracy Benchmarks by Asset Class
| Asset Class | Recommended Model | Typical Precursor Warning Window | False Positive Rate |
|---|---|---|---|
| Rotating equipment (pumps, fans) | Isolation Forest + Autoencoder | 2–4 weeks | 4–8% |
| Motors and drives | Autoencoder on current signature | 1–3 weeks | 5–10% |
| Gearboxes | LSTM sequence model | 3–6 weeks | 6–12% |
| Compressors | One-Class SVM + vibration spectra | 1–2 weeks | 3–7% |
Common Pitfalls When Rolling Out Anomaly Detection
Reliability teams that have gone through a full deployment cycle tend to point to the same handful of mistakes when asked what they would do differently. Most of these are avoidable with the right sequencing rather than a fundamentally different technical approach.
Plants that sequence their rollout deliberately — starting with a small set of high-value assets, maintaining a clean training baseline, and building the feedback loop into the maintenance team's daily routine from day one — consistently report faster time to trusted alerts than plants that deploy broadly and tune later.
Frequently Asked Questions
Do I need labeled failure data to train an anomaly detection model?
No. Most industrial anomaly detection models are unsupervised, meaning they train only on historical examples of normal operation and do not require prior examples of the specific failure they will eventually catch. This matters because most plants have far more data on normal operation than on rare failure events, and waiting to accumulate labeled failure examples would take years for many asset classes. Book a demo to see how the model builds a baseline from your existing historian data.
How much historical data does the model need before it becomes reliable?
Most asset classes need 60–90 days of representative historical operating data to establish a stable multivariate baseline, though assets with strong seasonal load variation may need a full operating cycle to avoid flagging normal seasonal shifts as anomalies. During this initial period, the platform typically runs in a monitoring-only mode, generating anomaly scores for review without triggering automatic work order dispatch.
How do reliability engineers avoid alert fatigue from false positives?
Alert fatigue is addressed through a combination of confidence scoring, contextual explanation of which signals are driving a given anomaly, and a feedback loop where technician findings are fed back into the model to refine its sensitivity for that specific asset over time. Plants that skip the feedback step tend to see false positive rates plateau rather than improve, since the model never learns which flagged deviations were actually benign.
Can anomaly detection replace vibration analysis programs entirely?
Anomaly detection is best understood as a continuous, automated complement to periodic vibration analysis rather than a full replacement, particularly for detailed spectral diagnosis that pinpoints a specific failure mode like bearing defect frequency or gear mesh wear. The two work well together: anomaly detection flags when something has changed and prioritizes which assets need deeper diagnostic attention, while traditional analysis techniques confirm the specific root cause. Talk to our engineers about integrating both into a single reliability workflow.
Which assets should a plant start with when piloting anomaly detection?
Start with assets that combine high failure cost, sufficient existing sensor instrumentation, and a documented history of unplanned failures, since these give the model the clearest signal-to-noise ratio and the fastest path to a demonstrable win. Assets with little existing instrumentation or highly variable, unpredictable operating conditions are better candidates for a second wave once the reliability team has confidence in the platform's output.