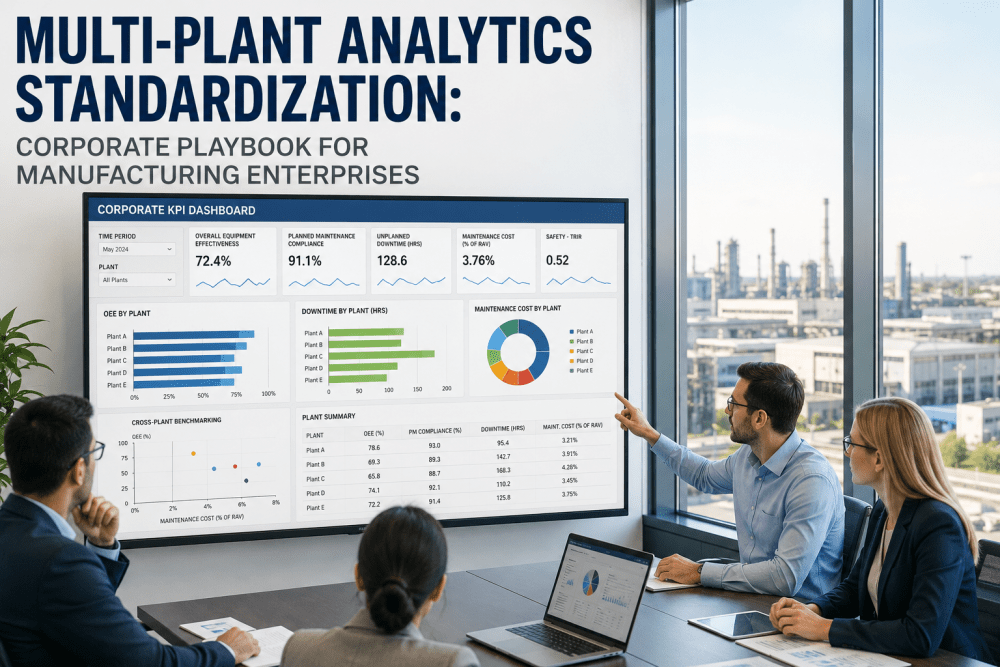
Manufacturing enterprises operating five, ten, or fifty plants across multiple geographies face a problem that single-site operators never encounter: every plant measures success differently. One facility calculates OEE using planned production time, another uses calendar time. One reports first-pass yield at end-of-line, another at the QA hold gate. One counts a 4-minute changeover as planned downtime, another as availability loss. The result is a corporate dashboard that aggregates apples, oranges, and bicycle parts — and an executive team making capital allocation decisions on data that cannot be meaningfully compared across the network. Multi-plant analytics standardization is the structured process of resolving this fragmentation: harmonizing KPI definitions, centralizing reporting infrastructure, enabling cross-plant benchmarking, and creating enterprise-wide operational standards that make every plant's performance directly comparable to every other plant's. Enterprises that have completed this standardization journey consistently report 18–28% improvements in network-wide OEE within 18 months — not because individual plants suddenly became better, but because the organization could finally see which plants were truly outperforming and replicate their practices everywhere else. If your corporate operations team is still reconciling plant reports manually, Book a Demo to see how iFactory's Multi-Plant Portfolio Management platform unifies analytics across your entire manufacturing network.
Why Multi-Plant Analytics Fragment — and What It Costs the Enterprise
When a manufacturing enterprise grows organically — through acquisition, regional expansion, or successive Capex cycles — each plant typically develops its own analytics ecosystem. Plant managers select MES vendors that fit local needs, maintenance teams adopt CMMS platforms that suit their workflows, and quality groups configure SPC tools to their specific product mix. Over a decade, what emerges is not a manufacturing network but a federation of independent data fiefdoms, each measuring performance with locally valid but globally incomparable metrics.
The cost of this fragmentation is rarely visible on any single P&L line. It surfaces as the inability to answer simple corporate questions: Which plant is most efficient at producing SKU X? Where is our highest unplanned downtime? Which site's maintenance program should we replicate? Without standardized analytics, these questions trigger weeks of manual data reconciliation — and the answers, when they arrive, are usually already obsolete. To map your current analytics fragmentation and the corporate intelligence opportunity it represents, Book a Demo with our enterprise standardization team.
KPI Definition Drift
Each plant calculates OEE, yield, and downtime using locally configured formulas — making the same metric mean different things at different sites, and rendering corporate roll-ups statistically meaningless for benchmarking or decision support.
Measurement LayerSystem Heterogeneity
A typical enterprise runs three to seven different MES, CMMS, SCADA, and quality platforms across its plants — each storing data in incompatible schemas that prevent direct comparison without expensive ETL pipelines and constant reconciliation work.
Infrastructure LayerReporting Cadence Misalignment
Plants report weekly, biweekly, or monthly on different days using different formats — so corporate operations teams see a perpetually outdated patchwork rather than a real-time network view, delaying interventions and capital decisions.
Cadence LayerBest-Practice Isolation
Without comparable performance data, top-performing plants cannot be identified as such — and the operational practices that drive their results stay locked inside individual facilities rather than propagating across the network.
Knowledge LayerThe Five-Pillar Framework for Enterprise Analytics Standardization
Standardizing analytics across a multi-plant manufacturing network is not a software procurement exercise — it is an organizational change program supported by enterprise platform infrastructure. Manufacturing enterprises that have successfully completed this transition consistently follow a five-pillar framework that addresses measurement, infrastructure, governance, benchmarking, and continuous improvement as interdependent disciplines rather than sequential projects.
Each pillar is necessary but not sufficient on its own. Centralizing data without standardizing KPI definitions produces a centralized version of the same fragmentation. Standardizing definitions without enabling cross-plant benchmarking creates clean data that nobody uses. The five pillars must be deployed as an integrated system — and this is precisely the architecture that iFactory's Multi-Plant Portfolio Management platform delivers. For a walkthrough mapped to your specific network structure, Book a Demo with our corporate operations specialists.
KPI Definition Harmonization
Establish a corporate metrics dictionary that defines OEE, yield, downtime categories, scrap, and every other operational KPI with single, unambiguous formulas applied identically at every plant — eliminating the definitional drift that makes cross-site comparison impossible.
Centralized Data Architecture
Deploy a unified data lake and analytics layer that ingests data from heterogeneous plant systems, normalizes it against the corporate metrics dictionary, and serves both real-time operational dashboards and strategic corporate reporting from a single source of truth.
Governance & Stewardship
Establish a corporate analytics governance council with defined data stewards at each plant, change-control procedures for metric definitions, and clear escalation paths — ensuring that standardization is sustained rather than eroded over time as personnel and priorities change.
Cross-Plant Benchmarking
Enable like-for-like performance comparison across plants producing similar products, running similar processes, or operating similar asset classes — surfacing the performance gaps and best-practice opportunities that are invisible in fragmented reporting environments.
Continuous Improvement Loop
Connect benchmarking insights to structured best-practice replication programs, corporate Capex prioritization, and network-wide operational excellence initiatives — converting standardized data into compounding performance improvements across the enterprise.
The 12-Month Multi-Plant Standardization Roadmap
Enterprises do not standardize twenty plants overnight. The most successful programs follow a structured 12-month progression that establishes the governance foundation first, deploys infrastructure in parallel across pilot sites, and then scales the standardized analytics architecture across the broader network in waves. The roadmap below reflects the deployment sequence iFactory has refined across multi-plant programs in food and beverage, consumer goods, automotive components, and process manufacturing environments.
Foundation: Corporate Metrics Dictionary & Governance Council
Form the corporate analytics governance council with representation from operations, IT, finance, and each major plant. Develop the corporate metrics dictionary — defining OEE, downtime categories, yield, scrap, energy intensity, and every other corporate KPI with single, audit-ready formulas. Establish data steward roles at each plant and change-control procedures for future metric evolution.
Pilot: Two-to-Three Plant Deployment & Validation
Deploy the centralized analytics infrastructure at two to three pilot plants representing the range of system landscapes across the network. Validate that standardized KPI definitions produce comparable results, refine the data ingestion pipelines for legacy plant systems, and document the deployment playbook that will be replicated across remaining sites.
Scale: Network-Wide Rollout in Deployment Waves
Roll out the standardized analytics architecture across the remaining plants in deployment waves of three to five sites at a time. Use the pilot playbook to accelerate each wave, transfer learnings between waves, and onboard plant data stewards through structured training programs that build local capability for ongoing standardization maintenance.
Activate: Benchmarking, Best-Practice Replication & Corporate Reporting
Activate cross-plant benchmarking dashboards, launch structured best-practice replication programs targeting the performance gaps surfaced by the standardized analytics, and integrate the unified corporate reporting layer with finance, supply chain, and executive review cycles — converting the standardization investment into measurable network-wide OEE and cost outcomes.
Fragmented Multi-Plant Analytics vs. Standardized Corporate Architecture
The operational and financial gap between enterprises running fragmented multi-plant analytics and those operating standardized corporate architectures is structural. The table below quantifies the differences across the dimensions that matter most to VPs of operations, corporate manufacturing directors, and executive teams evaluating an enterprise standardization investment.
| Dimension | Fragmented Multi-Plant Analytics | Standardized Corporate Architecture | Enterprise Impact |
|---|---|---|---|
| KPI Definitions | Locally configured at each plant | Single corporate metrics dictionary | True like-for-like comparison |
| Corporate Reporting Cycle | Weeks of manual reconciliation | Real-time unified dashboards | Faster decisions, lower overhead |
| Cross-Plant Benchmarking | Ad-hoc, statistically unreliable | Structured, like-for-like, continuous | Visible performance gaps |
| Best-Practice Propagation | Anecdotal, dependent on travel | Data-driven, programmatic | Network-wide OEE convergence |
| Network OEE Improvement | Plant-by-plant, uncoordinated | Corporate program, measurable | 18–28% network OEE gain |
| Capex Prioritization | Plant lobby, limited data | Network ROI, comparable data | Better capital allocation |
| M&A Integration Speed | 12–24 months per acquisition | Playbook-driven, accelerated | Faster synergy capture |
Six Capabilities Every Multi-Plant Standardization Platform Must Deliver
iFactory's Multi-Plant Portfolio Management platform delivers six core capabilities that directly determine the success of a corporate analytics standardization program. Each capability is engineered to address a specific failure mode that derails fragmented standardization attempts — and together they form the integrated architecture that turns a federation of plants into a unified manufacturing network. To see these capabilities in your network context, Book a Demo with our enterprise platform team.
Corporate Metrics Dictionary Engine
A centralized, version-controlled repository of corporate KPI definitions — OEE, yield, downtime categorization, scrap, energy intensity, MTBF, MTTR — applied identically at every plant through configurable calculation logic that eliminates definitional drift across the network.
Heterogeneous System Integration
Pre-built connectors and configurable data adapters that ingest data from the diverse MES, CMMS, SCADA, ERP, and quality systems running across multi-plant networks — without requiring rip-and-replace of existing site-level infrastructure or disrupting plant operations during the standardization rollout.
Unified Corporate Dashboards
Real-time corporate dashboards that present standardized KPIs across every plant in the network — with drill-down navigation from network view to plant view to line view to asset view, enabling corporate executives and plant operators to work from the same data with appropriate context for each role.
Cross-Plant Benchmarking Engine
Structured benchmarking workflows that compare plants producing similar products, running similar processes, or operating similar asset classes — surfacing the performance gaps and best-practice opportunities that drive structured replication programs across the network.
Governance & Data Stewardship Tools
Configurable governance workflows, role-based permissions, change-control procedures for metric definitions, and audit-ready data lineage tracking — sustaining standardization over time as personnel, plant configurations, and corporate priorities evolve across multi-year cycles.
Network Capex Intelligence
Portfolio-level analytics that quantify the ROI of capital investments across the plant network, identify the highest-impact deployment opportunities based on standardized performance data, and support data-driven capital allocation decisions across corporate Capex review cycles.
Expert Perspective: What Separates Successful Standardization Programs from Failed Ones
Corporate analytics standardization is one of the most attempted and most under-delivered programs in enterprise manufacturing. The pattern is consistent: a corporate operations team launches an ambitious multi-year initiative, secures executive sponsorship, deploys infrastructure, and then watches the program quietly stall as plants resist definitional changes, data quality issues delay reporting, and the executive sponsor moves to a new role. Understanding what separates the programs that succeed from those that stall is the most valuable input to any new standardization effort.
Sustained Executive Sponsorship
Successful programs treat standardization as a three-year executive priority rather than a one-year IT project. The corporate operations VP remains personally accountable for the program through the full deployment cycle, ensuring that plant resistance does not erode the standardization mandate during difficult phases of the rollout.
Plant-Level Value Demonstration
Programs that succeed deliver tangible value to each plant within the first 90 days of deployment — better local dashboards, faster reporting cycles, reduced manual data work — rather than asking plants to invest effort solely for corporate benefit. This reciprocity builds the operational coalition that sustains the program.
Pragmatic Definitional Compromise
The corporate metrics dictionary must reflect operationally feasible definitions across the existing plant landscape, not theoretically perfect formulas that no plant can actually report. Successful programs negotiate definitions that are 90% ideal and 100% implementable, rather than insisting on standards that delay deployment indefinitely.
Benchmarking as the Activation Event
Standardization without benchmarking is invisible work. The most successful programs activate cross-plant benchmarking dashboards as soon as the first wave of plants is standardized — creating immediate organizational energy around the program and demonstrating the corporate value that justifies further investment.
How Standardized Multi-Plant Analytics Serves Every Corporate Stakeholder
A successful multi-plant analytics standardization program delivers differentiated value to every layer of the corporate manufacturing organization — from plant operators consuming local dashboards to executive teams making network-level capital allocation decisions. The platform's value compounds across stakeholder groups when each finds it serves their specific decision-making needs.
Network Performance Intelligence
Unified visibility across every plant in the network with standardized KPIs that enable confident comparison, structured best-practice identification, and data-driven Capex prioritization — replacing the fragmented monthly reporting cycle with continuous, comparable performance intelligence.
Tool: Corporate Network DashboardPeer Benchmarking & Improvement Targets
Direct visibility into how their plant compares to similar plants in the network — including which sites are outperforming on specific KPIs, what practices drive those outcomes, and where the highest-impact improvement opportunities exist for the plant's specific configuration.
Tool: Cross-Plant Benchmarking EngineAudit-Ready Operational Reporting
Standardized operational metrics with auditable data lineage that integrate cleanly with financial reporting, supporting investor disclosures, ESG reporting, and capital allocation reviews — replacing the manual reconciliation work that historically consumed weeks of finance team capacity each quarter.
Tool: Corporate Reporting LayerFrom Federation of Plants to Unified Manufacturing Network
Multi-plant analytics standardization is the structural transition that converts a manufacturing enterprise from a federation of independent plants into a coordinated industrial network. The technology infrastructure required — centralized data architecture, unified KPI definitions, cross-plant benchmarking, governance tooling — is mature, deployable, and proven across industries from food and beverage to automotive components to process manufacturing. What separates the enterprises that have completed this transition from those still stuck in fragmented reporting is not technology access but organizational commitment to the standardization discipline as a sustained corporate priority.
For corporate operations leaders evaluating the standardization investment, the financial case is straightforward: the typical multi-plant enterprise loses 4–8% of network OEE to the inefficiencies created by fragmented analytics — invisible performance gaps, uncoordinated improvement programs, and suboptimal capital allocation. Recovering even half of that loss across a network of ten or more plants produces returns that dwarf the cost of the standardization program itself. The question is not whether the investment pays back — it is how quickly the enterprise can move through the deployment roadmap to capture that compounding value. To begin mapping your network's standardization opportunity, Book a Demo with iFactory's enterprise operations team.
Average network-wide OEE improvement achieved by manufacturing enterprises within 18 months of completing multi-plant analytics standardization.
Reduction in corporate reporting cycle time after replacing manual cross-plant reconciliation with unified standardized analytics dashboards.
Reduction in time required to integrate newly acquired plants into the corporate operational reporting framework using the standardization playbook.
Improvement in network Capex allocation efficiency driven by data-comparable ROI evaluation across competing plant investment opportunities.
Multi-Plant Analytics Standardization — Corporate Operations FAQs
How long does a typical multi-plant analytics standardization program take?
For enterprises with five to fifteen plants, the standardization program typically completes within 12–18 months following the four-phase roadmap: 3 months for governance and metrics dictionary foundation, 3 months for two-to-three plant pilot validation, 4–6 months for network-wide rollout in deployment waves, and 2–3 months for benchmarking activation and corporate reporting integration. Larger networks of 20+ plants typically require 18–24 months for full deployment, with measurable benchmarking value available after the first wave of plants is standardized.
Do we need to replace our existing plant-level MES, CMMS, and SCADA systems?
No. The Multi-Plant Portfolio Management platform is designed as an analytics standardization layer that sits above existing plant systems, ingesting data from heterogeneous MES, CMMS, SCADA, ERP, and quality platforms through configurable connectors. Plants continue operating their existing site-level systems while the corporate layer normalizes data against the unified metrics dictionary. This architecture eliminates the cost, risk, and timeline of replacing site infrastructure as a prerequisite for standardization.
How do we handle plant resistance to standardized KPI definitions that differ from local practice?
Plant resistance is the most common failure mode in standardization programs and must be managed deliberately. The proven approach combines three elements: involve plant operations leaders in the corporate metrics dictionary development so they have voice in the final definitions, deliver tangible plant-level value within the first 90 days of deployment so plants see direct benefit, and maintain sustained executive sponsorship that signals the standardization mandate is non-negotiable even when individual definitions are negotiable. Programs that combine pragmatic compromise on definitions with firm commitment to the overall standard typically achieve plant adoption.
What is the difference between corporate analytics standardization and a typical ERP rollout?
An ERP rollout standardizes transactional business processes — orders, inventory, financials — across plants. Corporate analytics standardization specifically targets operational performance measurement — OEE, downtime, yield, quality, energy — which is governed by different definitions, captured through different systems, and consumed by different decision-makers. The two programs are complementary but distinct: ERP standardization addresses the financial and supply chain layer, while analytics standardization addresses the operational excellence layer. Many enterprises run them as parallel programs with shared governance touchpoints.
How does multi-plant standardization support M&A integration?
Once the standardization playbook is established, integrating a newly acquired plant becomes a structured 60–90 day exercise: deploy data connectors to the acquired plant's existing systems, apply the corporate metrics dictionary to normalize incoming data, onboard plant data stewards to the corporate governance framework, and activate cross-plant benchmarking that immediately surfaces the acquired plant's performance position within the network. This playbook-driven approach typically reduces M&A operational integration timelines by 60% compared to ad-hoc integration efforts, accelerating synergy capture and post-acquisition value creation.