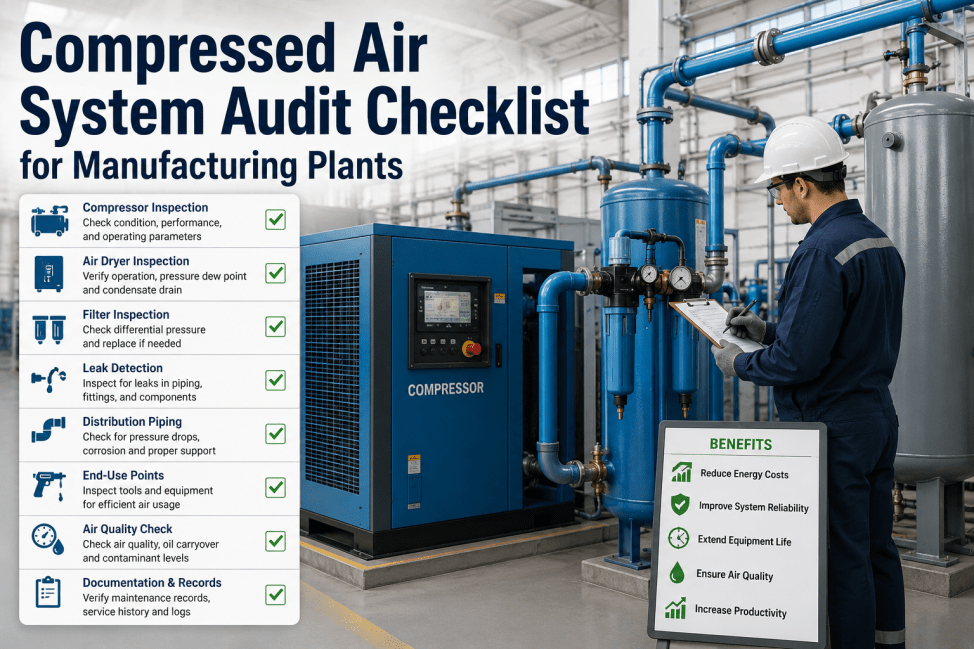
Compressed air is often called the "fourth utility" in discrete manufacturing plants — behind electricity, water, and natural gas — yet it carries one of the highest hidden cost burdens of any plant utility. The U.S. Department of Energy estimates that compressed air systems account for approximately 10% of total industrial electricity consumption, and that 20% to 30% of compressed air generated in a typical manufacturing facility is lost to leaks before it ever reaches a productive end use. Beyond the energy waste, pneumatic system failures — collapsed cylinders, stuck valves, clogged FRL units, ruptured air lines — drive unplanned downtime events that halt assembly lines, stamping presses, packaging machines, and robotic work cells across discrete manufacturing operations. Pneumatic system analytics changes the equation by continuously monitoring pressure, flow, cycle counts, and leak rates across every actuator, valve bank, and FRL station — surfacing degradation patterns weeks before they cause line stoppages. Facilities running iFactory's pneumatic analytics platform report 38% reduction in compressed air energy consumption, 67% fewer unplanned pneumatic-related line stoppages, and an average $145,000 annual savings in combined energy and maintenance costs per facility.
Pneumatic System Analytics for Discrete Manufacturing
A practical guide for U.S. manufacturing engineers and maintenance leaders implementing continuous monitoring across pneumatic valves, cylinders, FRL units, actuators, and compressed air distribution networks — catching degradation before line stoppages occur.
Six Failure Patterns Pneumatic Analytics Surfaces Before They Stop Production
Each pattern below represents a documented failure mode in discrete manufacturing pneumatic systems — and each one produces measurable signal changes in pressure, flow, or cycle data days to weeks before the equipment actually fails. Continuous monitoring converts those signals into prioritized work orders before the failure reaches the line. Schedule a pneumatic system assessment.
Compressed Air Leak Network Drift
A typical discrete manufacturing facility loses 20–30% of generated compressed air to leaks at fittings, hose connections, valve seals, and FRL drain points. Most leaks develop gradually — a fitting that vibrates loose over weeks, a hose that abrades against a frame. Pneumatic analytics tracks total demand versus useful demand, flagging the drift signature of new leak development.
Solenoid Valve Coil Degradation
Solenoid valves driving pneumatic actuators degrade through coil heating, seal wear, and spool sticking. Before a valve fails outright, its switching time extends — a valve that normally actuates in 12 ms begins taking 18, then 25, then 40 ms. This timing drift is invisible to operators but produces measurable cycle delays that analytics captures and trends.
Cylinder Seal Wear and Bypass
Pneumatic cylinder rod seals and piston seals wear over millions of cycles, eventually allowing air bypass that reduces force output and extends stroke time. A worn cylinder still functions but consumes 15–40% more air per cycle than a healthy unit. Analytics correlates cycle-by-cycle air consumption to baseline, flagging cylinders trending toward seal replacement.
FRL Filter Saturation and Pressure Drop
Filter-Regulator-Lubricator units accumulate particulates, water, and oil residue that increase pressure drop across the unit. As pressure drop grows, downstream equipment receives lower operating pressure and exhibits force and speed degradation. Analytics monitors differential pressure across each FRL and triggers replacement before downstream impact occurs.
Compressor Cycling Inefficiency
Compressor load/unload cycling patterns reveal demand-side problems — short cycling indicates either a leak load growing or a receiver tank sized too small for the demand profile. Analytics tracks compressor duty cycle, kW per cubic foot of useful air delivered, and identifies whether efficiency loss originates at the compressor or downstream in the distribution network.
Distribution Pressure Sag at Peak Demand
When multiple lines call for air simultaneously — typical at shift change and during high-speed packaging runs — undersized headers and restricted distribution paths produce pressure sag at end-of-line equipment. Analytics maps pressure at multiple distribution nodes and identifies which branches require resizing or which demand peaks need staggering.
How iFactory Monitors Pneumatic Health Across Four System Layers
Pneumatic analytics for discrete manufacturing requires layered monitoring — the failure modes at the compressor are different from those at the end actuator, and each layer requires its own sensor strategy, baseline model, and alert logic. iFactory's platform addresses four distinct layers with layer-specific monitoring approaches that combine into a unified health view of the entire compressed air ecosystem.
Generation Layer — Compressor and Receiver Monitoring
At the generation layer, iFactory monitors compressor load/unload cycles, motor current draw, discharge pressure, discharge temperature, and receiver tank pressure. The platform calculates specific energy consumption (kW per 100 SCFM delivered) continuously and trends it against the manufacturer's baseline curve. Deviations exceeding 8% trigger investigation work orders identifying whether the cause is internal compressor wear (valves, rings, oil separation) or downstream demand increases from new leaks or process changes. Multi-compressor facilities receive load-sharing optimization recommendations that reduce total kWh consumption without compromising header pressure stability.
Distribution Layer — Header and Branch Pressure Mapping
Distribution layer monitoring places pressure transducers at strategic nodes — main header, each branch take-off, and end-of-line drops at critical equipment. The platform builds a real-time pressure topology showing how pressure varies across the distribution network at each demand state. When end-of-line pressure sags below process minimum during specific production patterns, the platform identifies the contributing demand sources and recommends either pipe resizing, receiver tank placement, or demand sequencing changes. Distribution leak detection runs in parallel — flow during planned production downtime should approach zero, and any residual flow during off-shift periods is logged as leak load with location estimation based on pressure decay patterns.
FRL and Valve Layer — Conditioning and Switching Diagnostics
The FRL and valve layer is where most preventive maintenance work occurs — filter changes, lubricator refills, valve coil replacements. iFactory monitors differential pressure across each FRL unit to detect filter saturation before downstream pressure impact occurs. For solenoid valves driving pneumatic actuators, the platform measures coil response time, switching frequency, and current draw signature on each actuation. Drift in any of these parameters is logged against the valve's installation baseline, and replacement work orders are generated when degradation crosses configurable thresholds — typically 30% timing extension or 15% current draw increase.
Actuator Layer — Cylinder Cycle Health and Force Verification
At the actuator layer, iFactory monitors cylinder cycle time, end-of-stroke position consistency, and per-cycle air consumption for each instrumented cylinder. Cycle time extension indicates either valve degradation upstream or cylinder seal wear internally — the platform correlates with upstream valve diagnostics to identify the root cause. Per-cycle air consumption drift above 12% from baseline indicates seal bypass and triggers cylinder rebuild work orders before force output degradation affects part quality. For force-critical applications such as press operations, the platform also tracks the pressure-time integral during each working stroke and flags cycles where the integral falls below specification — a leading indicator of insufficient process force.
The Pneumatic Analytics Workflow: From Sensor Data to Prevented Downtime
The value of pneumatic analytics is determined entirely by how reliably continuous monitoring converts raw sensor data into specific maintenance actions that prevent line stoppages and reduce energy waste. iFactory's workflow takes a pneumatic system from blind monitoring to fully instrumented predictive operation in four staged steps — typically commissioned within 3 to 6 weeks per production line.
Continuous Multi-Point Data Acquisition
Pressure transducers, flow meters, and current sensors at the four monitoring layers stream readings to edge gateways at 100 ms intervals. Edge processing performs first-pass filtering, outlier rejection, and baseline normalization before transmitting summarized data to the iFactory platform. This architecture handles thousands of measurement points per facility without overwhelming the network or analytics backend, and continues local logging through any temporary network interruption.
Baseline Modeling and Operating Pattern Recognition
For each monitored asset — compressor, FRL, valve, cylinder — the platform builds a healthy operating baseline from 2 to 4 weeks of operational data. The baseline captures normal variation across production states (running, idle, changeover, planned downtime) so that subsequent deviation detection compares like-with-like. Without this state-aware baselining, a cylinder running at twice its normal cycle rate during a production peak would falsely trigger anomaly alerts; with it, the platform compares peak-state operation to peak-state baseline.
Degradation Detection and Root Cause Correlation
The platform continuously compares live operation against baseline and flags deviations exceeding configurable significance thresholds. Critical for discrete manufacturing applications, degradation events are correlated across layers — a cycle time extension at an actuator is automatically checked against upstream valve coil response time and FRL pressure drop to identify whether the root cause is the cylinder itself, the driving valve, or the air supply conditioning. This correlation eliminates the diagnostic guesswork that consumes maintenance technician time in reactive operations.
Automated Work Order Generation and KPI Reporting
Confirmed degradation events generate work orders in the iFactory CMMS with the affected asset identified, the diagnostic evidence attached as time-series charts, the recommended action specified (valve replacement, cylinder rebuild, leak repair, filter change), and the urgency tier set based on impact severity. Weekly KPI reports summarize total leak load in SCFM and dollars per month, top 10 highest-consumption actuators, valve population age distribution, and energy intensity trends — giving plant management the data foundation for compressed air system capital planning.
See Pneumatic Analytics Running on Your Production Lines
iFactory's manufacturing engineering team demonstrates the full monitoring stack — from compressor energy curves to actuator cycle health — using your facility's equipment list and production schedule. See exactly which measurement points deliver the highest ROI on your specific pneumatic footprint.
From compressor optimization to actuator-level cycle health and automated work order generation, iFactory's platform delivers complete pneumatic system visibility in a single managed system — with 38% energy reduction and 67% fewer unplanned stoppages at comparable U.S. discrete manufacturing facilities. Book your assessment now.
Reactive vs. Scheduled vs. Analytics-Driven Pneumatic Maintenance
Most discrete manufacturing facilities run pneumatic maintenance on some combination of reactive response and time-based scheduled service. Analytics-driven maintenance changes the cost structure by acting on actual condition data rather than calendar intervals or post-failure response. The comparison below maps the cost and outcome differences across the three approaches for a representative 200,000 sq ft facility.
Measured Outcomes from iFactory Pneumatic Analytics Deployments
These results reflect verified outcomes from iFactory pneumatic analytics deployments at U.S. discrete manufacturing facilities — automotive component plants, electronics assembly, food packaging lines, and metal fabrication — within the first 12 months of operation.
Ready to model these outcomes against your facility's current energy bill and downtime history? Book a 30-minute pneumatic ROI assessment with iFactory's manufacturing engineering team.
Expert Perspective: Why Pneumatic Analytics Pays Back Fast
Manufacturing engineers and energy management professionals with experience implementing compressed air optimization programs at U.S. discrete manufacturing facilities share their perspective on analytics-driven pneumatic operations.
Compressed air is the most expensive utility per delivered work unit in most discrete manufacturing plants, and it is also the most ignored. We routinely audit facilities where the maintenance team can tell you the oil pressure on every hydraulic system but cannot tell you what their air pressure is at the end of the longest distribution branch during peak demand. Pneumatic analytics changes that visibility deficit in weeks — and the energy savings alone typically pay back the entire instrumentation investment within the first year.
The breakthrough with analytics-driven pneumatic maintenance is not that it eliminates valve and cylinder failures — it is that it tells you which valve and which cylinder is degrading before the failure, so you can plan the work into a scheduled maintenance window instead of responding to it during a production run. The cost differential between a planned valve replacement during a Sunday window and an unplanned valve failure on a Tuesday at 2 PM is typically 8 to 12 times — and that ratio is what makes the business case write itself.
Conclusion
Pneumatic system analytics is not a replacement for skilled maintenance technicians — it is the continuous monitoring layer that converts reactive pneumatic operations into a predictive, energy-optimized practice. When a solenoid valve coil begins drifting toward failure, when a cylinder seal starts bypassing air, when a new leak develops at a vibrating fitting, the signal is there in the pressure, flow, and cycle data hours to weeks before the failure affects production. iFactory's platform captures that signal across every generation, distribution, conditioning, and actuation point in your facility and translates it into specific work orders with the diagnostic evidence attached.
The 38% energy reduction and 67% drop in unplanned stoppages at comparable facilities are the measured outcome of replacing audible leak detection and calendar-based valve replacement with continuous condition data and threshold-based intervention. The physics of pneumatic degradation has not changed. What has changed is that the platform now sees it as it develops. Book a pneumatic system assessment to identify which monitoring points will deliver the highest first-year ROI at your facility.
Pneumatic System Analytics: Frequently Asked Questions
Pneumatic Analytics for Discrete Manufacturing — Continuous Monitoring, Measurable ROI
iFactory's pneumatic analytics platform monitors every layer of your compressed air system — generation, distribution, conditioning, and actuation — converting continuous sensor data into specific work orders that prevent stoppages and cut energy waste.
38% Energy Reduction · 67% Fewer Unplanned Stoppages · $145K Average Annual Savings · 6–12 Month Payback · Multi-Site Benchmarking Built In. Book a demo to get started.