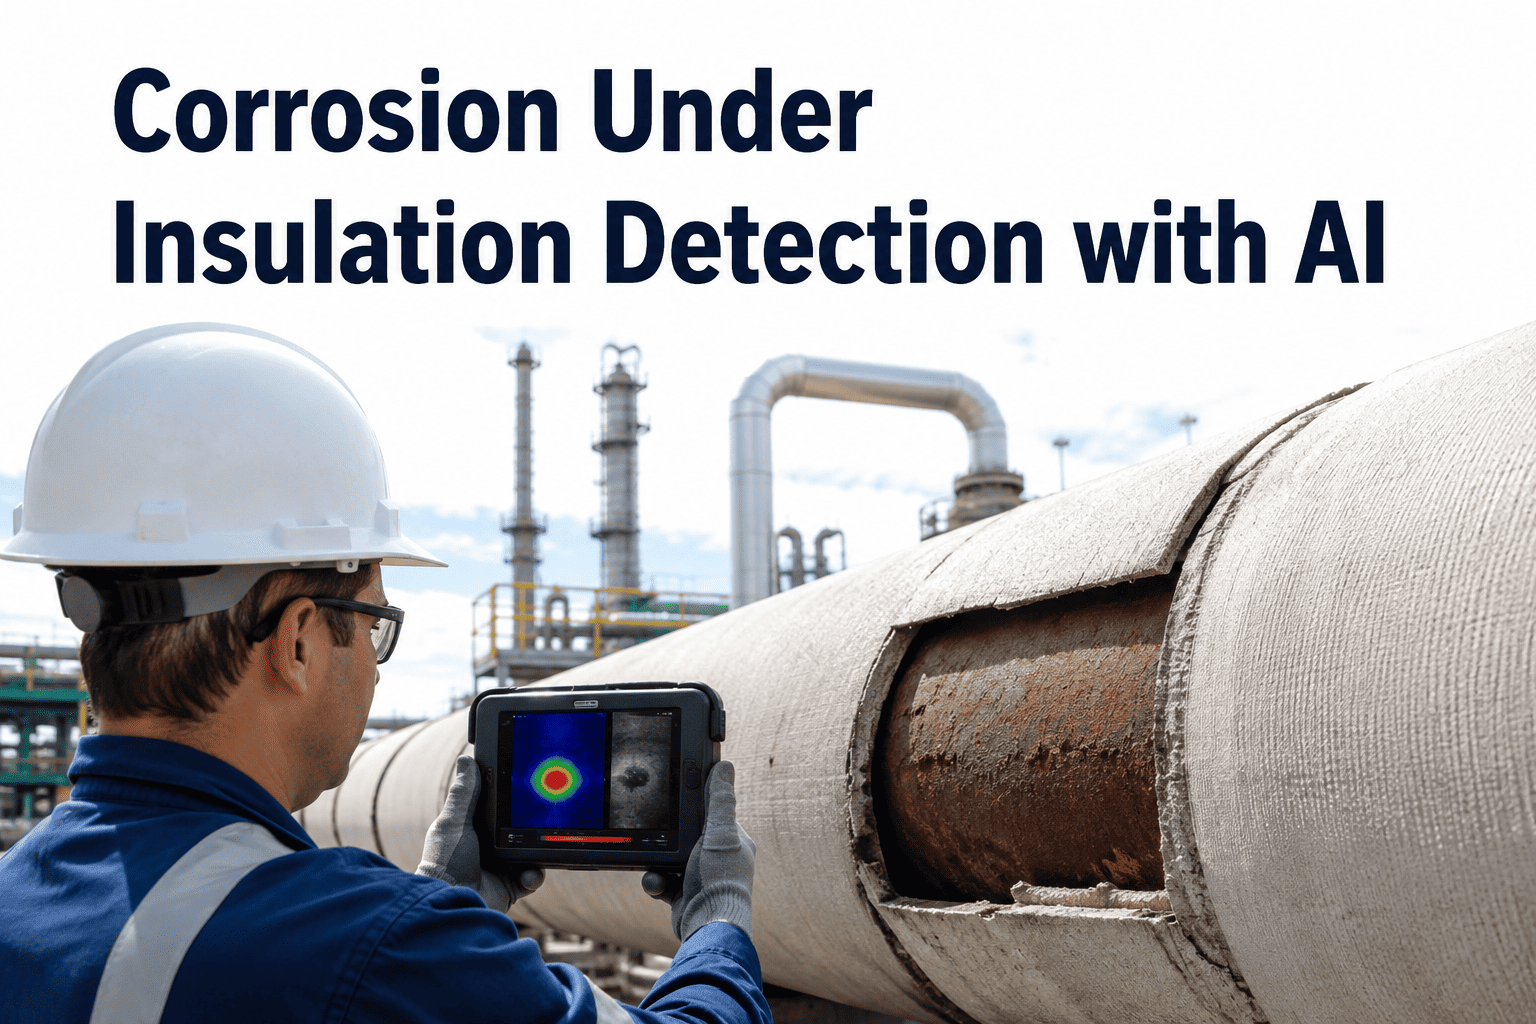
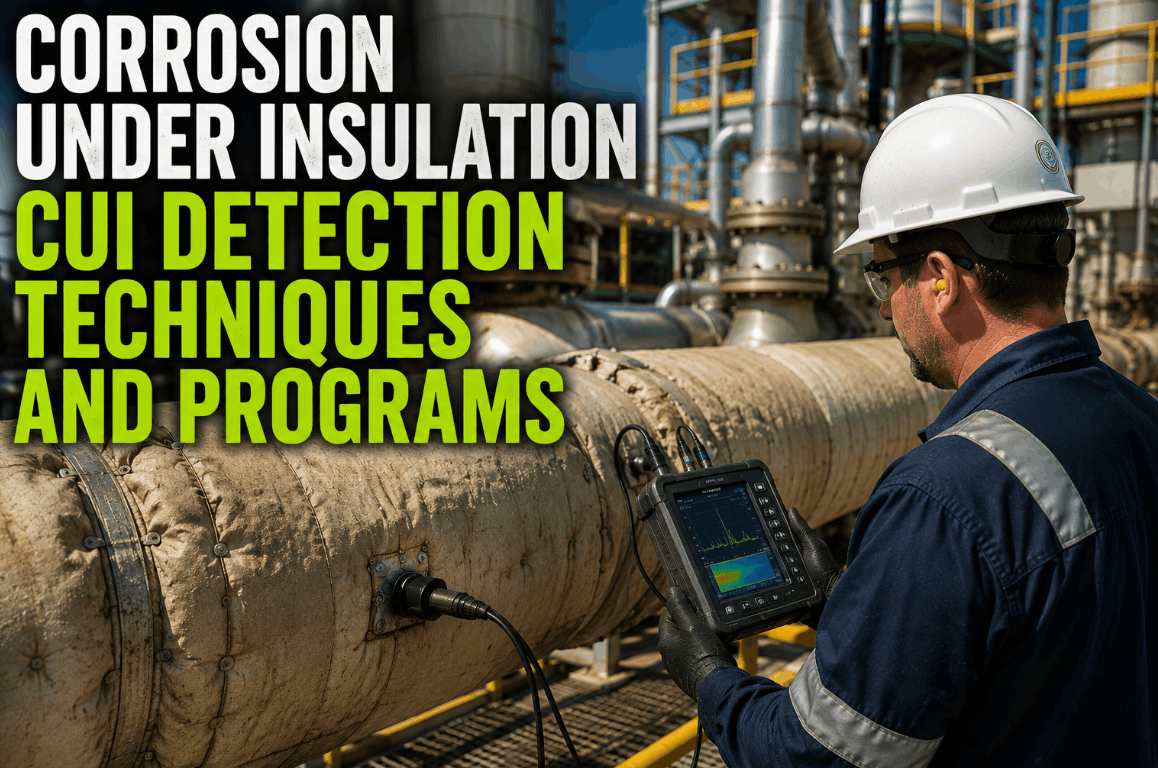
Corrosion under insulation is responsible for roughly 60 percent of all piping failures in refineries and chemical plants, yet most inspection programs still rely on removing insulation at random intervals and hoping to find the damage before it becomes a leak. The corrosion develops silently beneath weather jackets and insulation materials, invisible to visual inspection, and progresses for months or years until wall thickness drops below the failure threshold. Traditional methods find CUI after significant metal loss has already occurred. AI-enhanced detection using thermal imaging and pulsed eddy current changes the equation entirely by identifying moisture ingress patterns and wall thinning trends before failures happen. Book a demo to see how AI-driven CUI detection works on real insulated piping systems.
Oil & Gas · Predictive Maintenance ROI
Corrosion Under Insulation Detection with AI: Find It Before It Fails
How thermal imaging, pulsed eddy current, and AI pattern recognition replace guesswork with targeted, risk-based CUI inspection that catches hidden corrosion before it becomes a shutdown event.
60%
Of piping failures in process plants caused by CUI
$1.37M
Average total cost per CUI-related piping failure incident
50%
Of insulated piping surface area falls in the most CUI-susceptible temperature range
What Is Actually Happening Under Your Insulation
CUI does not appear randomly. It follows a predictable sequence that starts when water breaches the outer protective layer and becomes trapped against the steel surface. Understanding this layered progression is the foundation for any effective detection strategy. The cross-section below shows exactly where each defense layer fails and why the corrosion remains invisible until it is too late.
Environment
Rain, humidity, spray, and washdown water provide the moisture source that initiates the entire CUI mechanism
Weather Jacket / Cladding
Metal or polymeric outer shield. Fails at seams, overlaps, penetrations, and damaged areas allowing water ingress
Insulation Material
Absorbs and holds moisture against the pipe. Some materials like calcium silicate become more corrosive when wet
Corrosion Zone
Electrochemical reaction between trapped moisture and steel surface. Produces pitting, wall thinning, and eventually through-wall penetration
Carbon Steel Pipe
The asset being consumed. Wall thickness decreases from outside in, with no external visual indication until insulation is removed
CUI Risk by Operating Temperature Range
Not all insulated piping carries the same CUI risk. Temperature determines whether water stays liquid, evaporates, or freezes against the pipe surface. The zones below show where CUI risk peaks and why blanket inspection of all insulated piping wastes resources while missing the most vulnerable sections.
-4 C to 60 C
Most Dangerous Zone
Water remains liquid and stays in contact with steel. No drying effect. This range covers the majority of CUI failures in process plants.
60 C to 150 C
High Risk Zone
Partial drying occurs but cyclic operation or intermittent service allows repeated wetting and drying that accelerates corrosion.
150 C to 260 C
Moderate Risk Zone
Continuous operation keeps insulation dry, but shutdowns, upsets, and insulation damage can introduce moisture that corrodes during cooldown periods.
Above 260 C
Low Risk Zone
CUI is unlikely during operation but thermal cycling during startups and shutdowns creates temporary susceptibility windows.
Below -4 C
Cryogenic Risk Zone
Frost formation and ice lensing under insulation create localized moisture concentration and insulation damage that leads to corrosion on warmup.
Detection Methods: What Each Technology Actually Sees
No single inspection technology catches every form of CUI. Each method has a distinct detection mechanism, penetration depth, and resolution limit. The capability matrix below shows what each technology contributes to a comprehensive CUI detection program and where AI pattern recognition amplifies the results.
Thermal Imaging
Sees
Surface temperature anomalies indicating wet insulation, trapped moisture, and insulation voids
Cannot measure wall thickness directly. Affected by solar loading, wind, and jacket emissivity variations
AI compensates for environmental noise and learns to distinguish moisture patterns from false positives
Pulsed Eddy Current
Sees
Average remaining wall thickness through insulation and jacketing without removal
Provides averaged thickness over a footprint area, not precise localized pitting depth measurement
AI tracks thickness trends across repeated scans to predict remaining life and prioritize excursions
Digital Radiography
Sees
Through-insulation profile images showing wall loss, pitting, and internal deposits
Requires access to both sides of the pipe. Radiation safety requirements limit deployment speed
AI automates defect recognition in radiograph images, reducing analyst interpretation time significantly
Guided Wave Testing
Sees
Long-range screening of pipe from a single sensor location, identifying cross-sectional metal loss
Cannot distinguish CUI from other damage mechanisms. Low sensitivity to shallow pitting
AI correlates guided wave alerts with process data and insulation condition records to classify damage cause
AI Pattern Recognition: From Raw Data to CUI Prediction
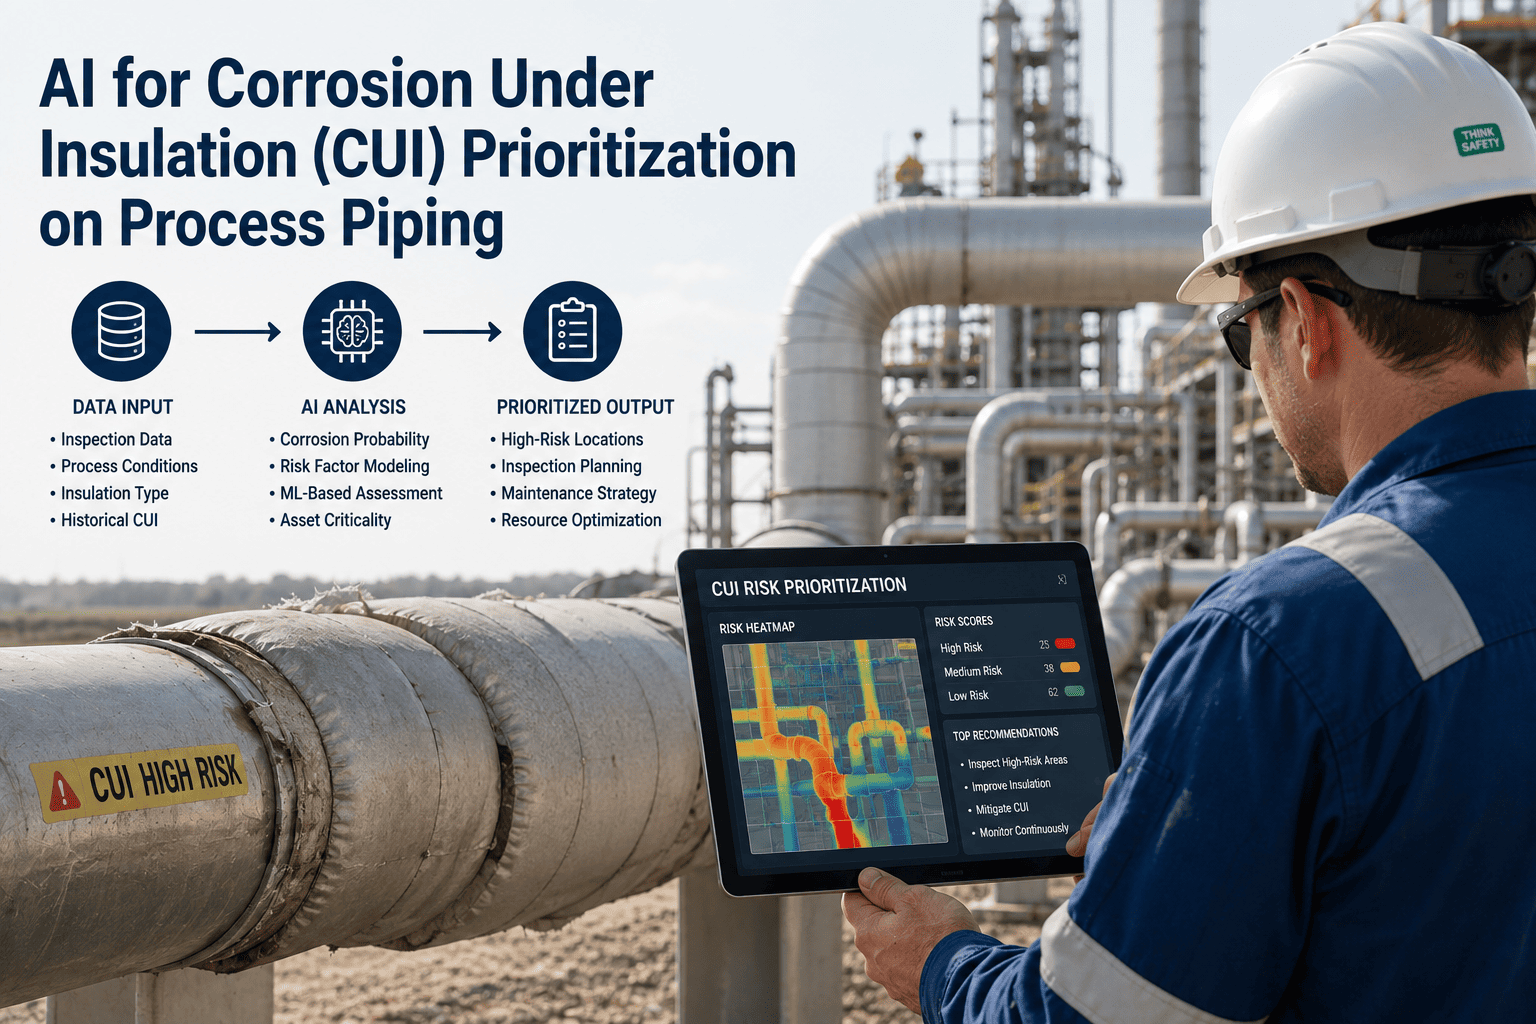
Individual inspection readings become far more valuable when AI analyzes them collectively across an entire piping network. The pipeline below traces how raw sensor outputs from thermal cameras and eddy current probes become ranked inspection priorities that tell your team exactly where to look next.
01
Data Capture
Thermal scans, PEC readings, pipe schedule data, operating temperature records, insulation type and age, and maintenance history loaded into the analysis platform
02
Noise Filtering
Solar heating effects, wind cooling, jacket reflectivity variations, and calibration drift are identified and separated from genuine anomaly signals using trained recognition models
03
Feature Extraction
Moisture ingress signatures, wall thinning rates, temperature deviation patterns, and spatial clustering of anomalies are quantified as measurable risk features
04
Risk Classification
Each pipe segment receives a CUI probability score and predicted remaining life estimate based on combined evidence from all available detection methods and operating conditions
05
Inspection Prioritization
Output is a ranked list of pipe segments with specific inspection recommendations, method selection, and estimated urgency so inspection resources go where risk is highest
Risk-Based Inspection Planning: The 3x3 Matrix
Not every pipe with wet insulation needs immediate stripping. Risk-based inspection combines the probability of CUI damage with the consequence of failure to allocate inspection effort where it matters most. The matrix below shows how AI-generated probability scores map to inspection actions.
Low Consequence
Medium Consequence
High Consequence
High Probability
Schedule inspection within 3 months
Inspect within 30 days, plan insulation removal
Immediate inspection, consider temporary shielding
Medium Probability
Include in next scheduled turnaround
Schedule inspection within 6 months
Inspect within 60 days with PEC screening
Low Probability
Monitor with thermal scan at next cycle
Include in next scheduled turnaround
PEC screening within 12 months
The Financial Case for AI-Driven CUI Detection
CUI programs that rely on random insulation removal spend three to four times more on inspection labor while finding fewer actual defects than programs guided by predictive analytics. The cost comparison below quantifies the difference across the major cost categories that plant managers actually track.
Every day your insulated piping runs without predictive CUI screening is a day corrosion is progressing unseen. Random insulation removal finds damage after it happens. AI-guided detection finds the conditions that cause damage before metal loss reaches critical levels. The technology exists. The question is whether your inspection budget is spent finding problems or preventing them.
Expert Insight
I have reviewed CUI inspection programs at over forty facilities, and the pattern is disturbingly consistent. Plants remove insulation at ten or fifteen percent of their susceptible piping each turnaround, inspect those spots, replace the insulation, and call it a CUI program. Meanwhile, the most severe corrosion is often on the ninety percent they did not inspect. AI-driven screening does not eliminate the need to remove insulation. It tells you exactly which ten percent to remove to find eighty percent of the actual damage. That is not a marginal improvement. That is the difference between a CUI program that provides real risk reduction and one that provides false confidence while piping continues to fail in the uninspected areas.
Robert Vasquez — Senior Inspection Engineer, 20 years in API 510/570 piping and pressure vessel inspection, former reliability lead at two Fortune 500 refining companies
Traditional CUI Programs vs. AI-Enhanced Detection
The table below captures the operational differences between conventional CUI management and AI-augmented approaches across the decision points that determine whether a program catches corrosion or just documents it after the fact.
| Decision Point |
Traditional Program |
AI-Enhanced Program |
Outcome Difference |
| Where to inspect |
Random selection or calendar-based rotation of insulated piping |
AI ranks all pipe segments by CUI probability using thermal, PEC, and operating data |
Inspection resources concentrated on highest-risk locations |
| When to inspect |
Fixed turnaround interval regardless of condition changes |
Triggered by detected moisture ingress trends or wall thickness rate changes |
Inspection timing aligned with actual degradation pace |
| What method to use |
Same method applied to every location regardless of access or insulation type |
AI recommends optimal method per segment based on insulation type, pipe geometry, and accessibility |
Right tool for each location, reducing unnecessary insulation removal |
| How to interpret results |
Individual technician judgment on each reading |
AI compares current readings against historical baseline and fleet-wide patterns |
Consistent defect classification with reduced false positive and false negative rates |
| How to track progression |
Written reports filed in inspection records, difficult to trend across campaigns |
Automated wall thickness trending with remaining life prediction per segment |
Visible degradation trajectory enabling planned repair before failure |
Frequently Asked Questions
How accurate is thermal imaging for detecting moisture under insulation?
Thermal imaging is highly effective at identifying wet insulation areas because water has a different thermal conductivity than dry insulation, creating visible temperature differences on the outer jacket surface. However, accuracy depends heavily on environmental conditions, jacket material, and operator expertise. Solar loading can mask wet spots, and low-emissivity metal jackets can reflect surrounding temperatures instead of showing the insulation condition. AI-powered analysis addresses these limitations by applying environmental corrections, filtering noise, and learning site-specific patterns that distinguish genuine moisture signatures from false readings.
Book a demo to see AI-filtered thermal analysis on actual plant data.
Can pulsed eddy current replace insulation removal entirely?
Pulsed eddy current provides remaining wall thickness measurements through insulation without removal, which makes it an excellent screening tool for prioritizing where insulation should actually be removed for detailed visual inspection. However, PEC measures average wall thickness over a defined footprint and cannot resolve small localized pitting that may be the actual failure mechanism. The most effective programs use PEC as a broad screening layer to identify segments with general wall thinning, then use targeted insulation removal and ultrasonic testing on those specific locations to characterize the precise corrosion morphology.
Contact support to understand how PEC integrates into a layered CUI detection strategy.
What data inputs does the AI model need to start generating CUI predictions?
The minimum viable input set includes pipe specifications such as diameter, wall thickness, and material, operating temperature history, insulation type and installation date, and at least one round of inspection data from thermal imaging or pulsed eddy current. The model improves significantly with additional inputs like process fluid composition, jacket condition assessments, maintenance history, weather exposure data, and previous CUI findings. Most plants already have the majority of this data in their inspection management systems or asset registries. The gap is rarely missing data and almost always the analytical layer that connects the data into risk predictions.
Book a demo to see what your existing data can produce.
How long does it take to deploy an AI-based CUI detection program across a refinery?
A pilot program on a single process unit with 500 to 1000 insulated pipe segments can be operational in 8 to 12 weeks, including data gathering, model training, initial thermal and PEC screening, and first-round prediction output. Full site deployment across an entire refinery typically requires 6 to 9 months using a phased unit-by-unit approach that allows the model to improve with each unit's results before moving to the next. The critical path is usually not the AI platform itself but the logistics of collecting baseline thermal and PEC data across large piping networks during active operations.
Contact support to discuss a deployment timeline for your facility.
Does AI CUI detection work on non-metallic insulation types like cellular glass or aerogel?
Yes, but the detection approach and model training differ by insulation material because each type has distinct thermal properties, moisture absorption characteristics, and failure modes. Cellular glass is non-absorbent, so moisture tends to travel along joints rather than saturating the material, creating different thermal signatures than absorbent materials like mineral wool or calcium silicate. Aerogel has very low thermal conductivity, which changes how moisture anomalies appear on thermal scans. AI models trained on diverse insulation type datasets perform well across materials because the pattern recognition adapts to the expected thermal behavior of each insulation type rather than applying a single threshold.
Book a demo to see multi-material CUI detection in practice.
Stop Stripping Insulation Blindly — Start Knowing Where to Look
AI-driven CUI detection that turns thermal scans and eddy current readings into ranked inspection priorities, so your team finds the worst corrosion first with less insulation removed.