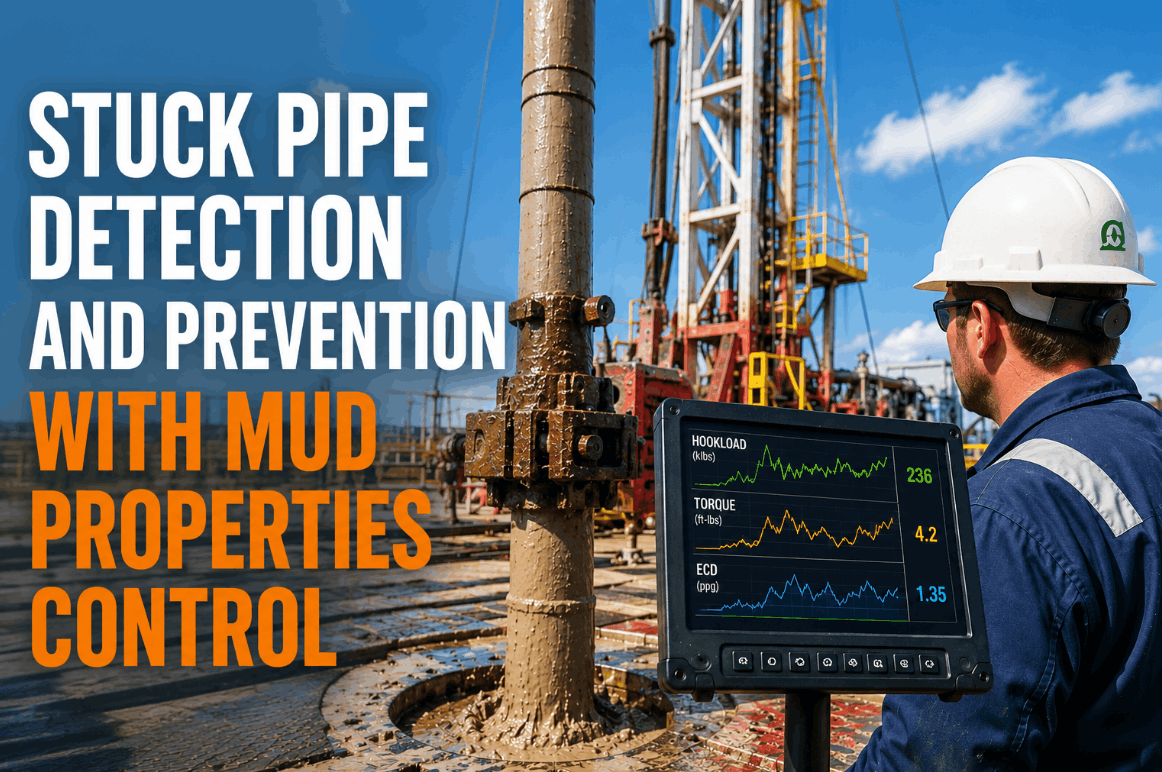
A stuck pipe event rarely announces itself in advance—until hookload drags a few thousand pounds beyond the drag model, torque climbs without an obvious cause, or the equivalent circulating density quietly drifts past a safe margin. Drilling teams that rely on periodic mud reports and manual hookload checks are often the last to know that a differential stick or a pack-off is forming around the BHA, and by then a single incident can cost $1M to $5M in lost rig time, fishing operations, and sidetracking. iFactory's AI-driven drilling mechanics platform correlates hookload, torque, and ECD trends with live mud properties in real time, surfacing the early-warning signature of a stuck pipe event long before it becomes a multi-day NPT crisis. To see how this works on your next well, Book a Demo with our drilling engineering team.
The Visibility Gap Behind Every Stuck Pipe Incident
Why Periodic Mud Checks Can't Catch a Differential Stick in Time
Most rigs still treat hookload, torque, and mud properties as three separate conversations—one on the driller's screen, one in the mud engineer's report, and one in the daily drilling report reviewed hours later. A differential stick doesn't wait for that report. It builds gradually as static time against a permeable zone increases mud cake thickness and differential pressure across the drillstring. By the time pickup weight climbs noticeably above the calibrated drag model, the window to react with a simple jar-down or rotation has often already closed. iFactory closes this gap by streaming hookload, torque, and ECD data alongside live mud weight, viscosity, and filtrate trends, flagging the early divergence the moment it starts rather than after the pipe has gone solid.
5 Root Causes of Stuck Pipe Events
Diagnosing Drillstring Risk Before It Becomes Lost Time
How Mud Property Drift Increases Stuck Pipe Risk
The True Cost of Ignoring ECD and Filtrate Trends
Equivalent circulating density sits at the center of stuck pipe risk in ways that are easy to overlook between mud reports. Run ECD too high relative to the pore pressure and fracture gradient window, and the resulting overbalance accelerates differential sticking in permeable sands. Let mud weight, gel strength, or filtrate control drift unmanaged, and you raise the odds of both pack-off and wellbore instability at the same time. Real-time stuck pipe analytics requires continuous hookload and torque comparison against a calibrated drag model, live ECD drift detection against the pressure window, and physics-informed correlation between mud properties and sticking risk, with automated alerts reaching the rig floor and the office at the same moment. The table below outlines the cost and risk profile of the most common stuck pipe mechanisms.
| Stuck Pipe Mechanism | Primary Indicator | Secondary Risk | Estimated Cost Range |
|---|---|---|---|
| Differential Sticking | Mud Cake Thickness / Static Time | Lost BHA, Sidetrack Risk | $800K – $3.2M |
| Key Seat / Mechanical | Hookload Spike on POOH | Drillstring Fatigue, Twist-Off | $400K – $1.5M |
| Pack-Off / Bridging | Torque and ECD Spike | Lost Circulation, Well Control Event | $600K – $2.4M |
| Wellbore Instability | Cavings at Shakers, ROP Decline | Hole Collapse, Sidetrack | $1M – $4M |
| Cuttings Bed Accumulation | Cuttings Return Rate Drop | Stuck BHA, Hole Cleaning Failure | $500K – $1.8M |
5-Step Framework for Stuck Pipe Prevention
Well Control and NPT Risk Management
Protecting Rig Time and Crew Safety
A stuck pipe event is never just a drilling-mechanics problem—it's frequently the first domino in a well control or NPT escalation. A pack-off that isn't caught early can lead to lost circulation and a kill-weight mud decision under pressure. A differential stick that drags on can force a sidetrack decision that erases weeks of progress on the well plan. iFactory's correlation engine treats stuck pipe risk as part of the broader well control picture, linking hookload, torque, ECD, and mud properties to the same alerting layer your team already uses for kick and loss detection. Book a Demo to see how this layered risk view works on a live well.
Conclusion: Turning Stuck Pipe Risk Into Predictable Drilling Operations
Stuck pipe will likely never be fully eliminated from drilling operations, but it doesn't have to remain a surprise. When hookload, torque, ECD, and mud properties are watched together instead of in separate silos, the early signature of a differential stick, a pack-off, or a developing keyseat becomes visible with enough lead time to act. That shift, from reactive fishing jobs to proactive risk management, is what separates a controlled NPT day from a multi-million-dollar sidetrack decision.
Frequently Asked Questions
What is differential sticking and why does it happen?
Differential sticking occurs when the drillstring sits stationary against a permeable formation long enough for mud cake and overbalance pressure to pin it to the wellbore wall.
How can real-time mud properties help prevent stuck pipe?
Continuous mud weight, viscosity, and filtrate trends reveal cake-building and overbalance conditions developing well before hookload or torque show a measurable deviation.
What hookload and torque trends signal an impending stick?
Pickup weight or torque drifting above the calibrated drag model, especially after static time, is one of the earliest reliable signals of a developing stick.
Can ECD monitoring really predict a pack-off event?
ECD spikes combined with rising torque and falling cuttings returns are a strong early indicator of cuttings bridging around the BHA, often hours before circulation is lost.
How quickly can operators see ROI from stuck pipe analytics?
Most operators see measurable ROI within the first one to two wells, primarily through avoided NPT and reduced fishing and sidetrack events.