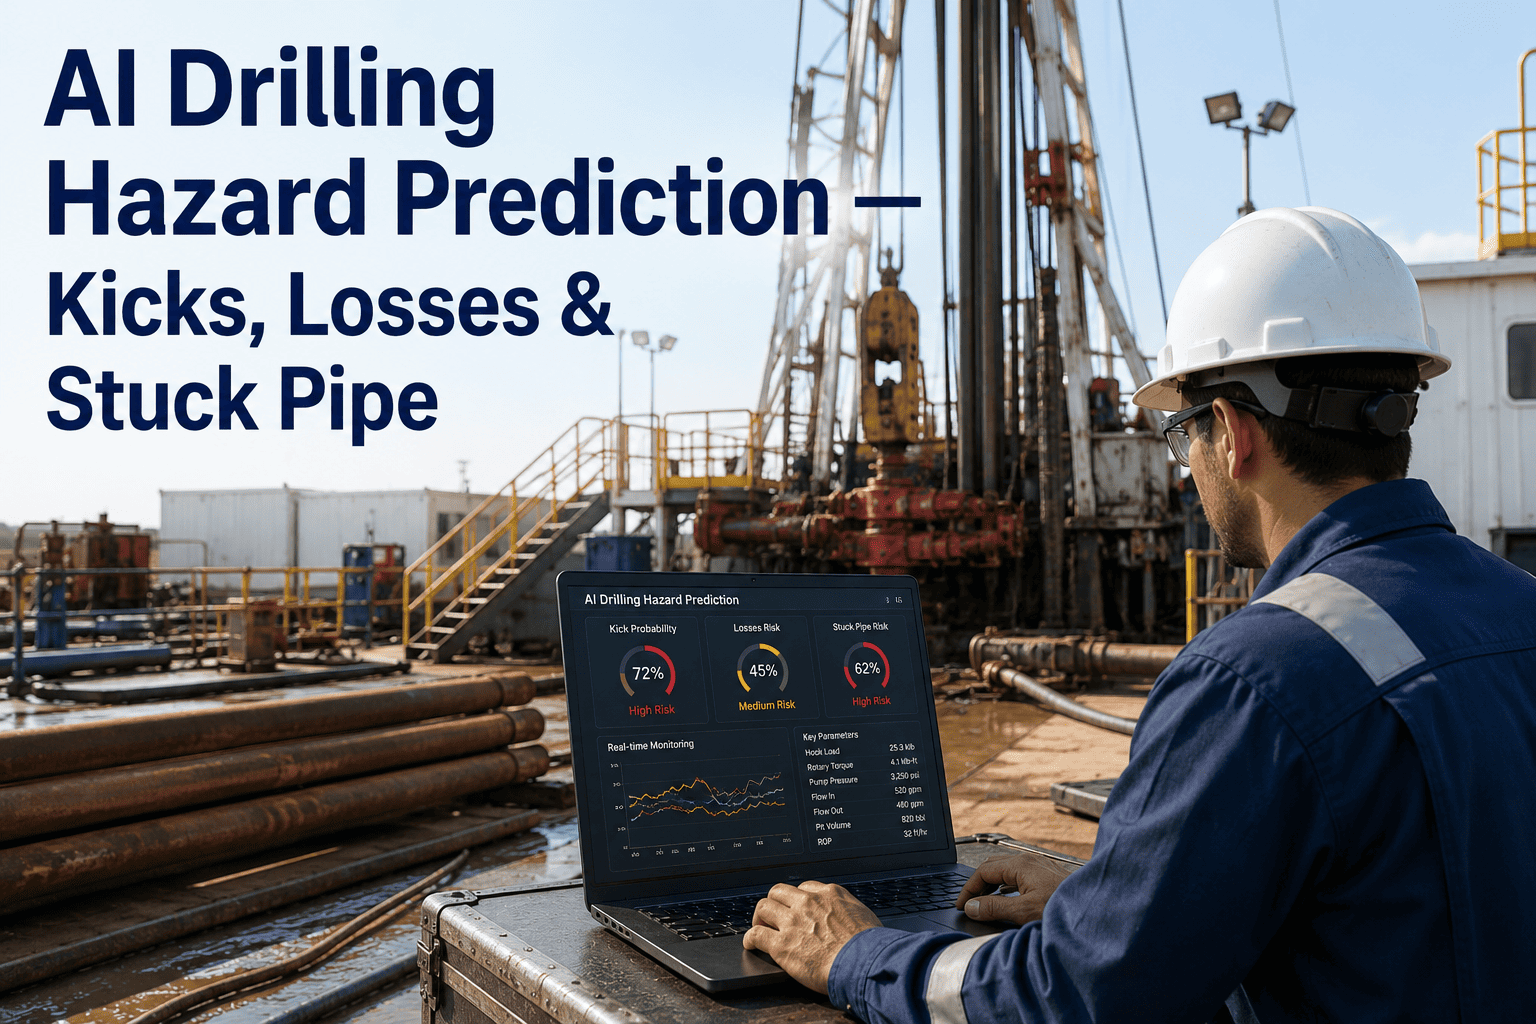
A kick that goes undetected for ten minutes can become a blowout. Lost circulation that is ignored for two hours can collapse the wellbore. Differential sticking that is not recognized until the pipe stops moving can cost millions in fishing operations and sidetracks. Conventional drilling surveillance relies on threshold alarms on individual sensors — a flow-out increase, a pit gain, a torque spike — each monitored in isolation, each triggering only after the hazard has already begun. AI drilling hazard prediction fuses surface sensor data, mud logging parameters, and drilling mechanics into a single model that detects precursor signatures 15 to 30 minutes before conventional alarms fire. This article covers exactly what the model monitors, how it distinguishes real hazards from noise, and where it changes the outcome of the most expensive drilling events. Walk through your own drilling data when you book a demo.
AI DRILLING HAZARDS · KICK DETECTION · LOST CIRCULATION · STUCK PIPE · WELLBORE STABILITY
Stop reacting to drilling alarms — AI predicts kicks, losses, and stuck pipe before they happen
Early warning from fused sensor data catches hazard precursors 15-30 minutes before conventional threshold alarms, giving the driller time to act instead of respond.
15-30 min
Early warning before conventional alarm
94%
Loss zone identification accuracy
76%
Stuck pipe risk reduction
Under 30 sec
Alert latency from detection to driller
75%
Of non-productive time in drilling comes from kicks, lost circulation, and stuck pipe combined.
$1-4M
Average cost per well control incident including kill operations, lost time, and equipment damage.
90%
Of kicks show detectable precursor signatures in surface data at least 15 minutes before the event.
Six drilling hazards that escalate because conventional monitoring catches them too late
Every drilling hazard has a precursor phase where the physics of the problem are already at work but the surface signatures are too subtle for threshold-based alarms. AI catches these precursors by looking at relationships between sensors rather than individual readings.
01
Formation Influx and Kick
Formation fluid enters the wellbore when bottomhole pressure drops below pore pressure. The earliest indicator is not a pit gain — it is a subtle change in the relationship between flow-in and flow-out that precedes measurable pit volume change by 15-30 minutes. Conventional alarms wait for the pit gain.
02
Lost Circulation
Mud is lost to a fracture or high-permeability zone when bottomhole pressure exceeds fracture gradient. The precursor is a progressive change in return flow rate versus pump rate that starts before any visible drop in mud level. In partial losses, the flow difference may be only 5-10% and invisible to standard alarms.
03
Differential Sticking
The drillstring becomes stuck when mud weight creates a large pressure differential against a permeable formation and the pipe contacts the borehole wall. The precursor is a gradual increase in torque and drag that develops over multiple stands, not a sudden event. By the time the pipe will not move, it is too late for prevention.
04
Wellbore Instability
Borehole collapse or breakout occurs when the mud weight is insufficient to support the mechanical strength of the formation. The precursor is increasing torque, overpull on connections, and cavings in the return flow that escalate over hours. Conventional monitoring treats each symptom independently.
05
Swab and Surge During Trips
Pipe movement during connections and trips creates pressure fluctuations that can either swab formation fluid into the hole or surge mud into a weak formation. The precursor is the pressure signature at the pump during pipe movement that deviates from the expected swab-surge model for the current wellbore geometry.
06
Shallow Gas or Water Flow
Near-surface flows are the most dangerous because they offer minimal warning time and the wellbore has no casing to contain them. The AI monitors shallow drilling parameters — ROP, torque, gas units, and return flow — for the specific signature of shallow overpressured zones that pre-log data may not have identified.
The pressure window and why drilling inside it is harder than it looks
The drilling margin is the gap between pore pressure and fracture gradient. Every foot drilled narrows or shifts this window, and the mud weight must stay inside it at all times. AI tracks the window in real time rather than relying on pre-drill predictions that become obsolete as formation properties change with depth.
The Drilling Pressure Window
Pore Pressure < Mud Weight < Fracture Gradient
Below pore pressure: formation fluid enters wellbore (kick). Above fracture gradient: mud lost to formation (losses). The gap between them is the safe operating window.
BELOW PORE PRESSURE
Kick Risk Zone
Mud hydrostatic is insufficient to hold back formation pressure. Formation fluid flows into the wellbore. AI detects the resulting flow-out increase, pit gain, and pump pressure change 15-30 minutes before threshold alarms and recommends mud weight increase or well shut-in.
WITHIN THE WINDOW
Safe Operating Zone
Mud weight maintains overbalance without exceeding fracture pressure. AI continuously refines the window estimate from real-time drilling response, updating pore pressure and fracture gradient predictions as new data arrives from each foot drilled.
ABOVE FRACTURE GRADIENT
Loss Risk Zone
Mud hydrostatic exceeds the formation's fracture resistance. Mud is lost into induced or natural fractures. AI detects the return flow deficit, identifies the loss severity, and recommends mud weight reduction or lost circulation material treatment before total loss occurs.
Three hazard categories the AI model classifies from the same sensor feed
Kicks, losses, and stuck pipe produce overlapping surface signatures — a flow change could mean influx or loss depending on direction; a torque change could mean sticking or wellbore instability. AI disentangles these by analyzing the full sensor vector simultaneously rather than triggering on individual parameters.
KICK DETECTION
INFLUX
Formation fluid entering the wellbore
The model tracks flow-out exceeding flow-in, increasing pit volume, decreasing pump pressure as lighter formation fluid displaces heavier mud, and gas units at the shaker. It distinguishes true influx from trip-related fluctuations, mud addition errors, and temperature-induced volume changes that produce similar individual signatures.
LOSS DETECTION
SEEPAGE TO TOTAL
Mud leaving the wellbore into the formation
The model identifies return flow falling below pump rate, pit volume decrease, and pump pressure increase as mud is lost to fractures. It classifies loss severity from seepage to partial to total, predicts whether the loss zone is natural or induced, and recommends treatment before the mud level drops to a critical level.
STUCK PIPE
DIFFERENTIAL
Pipe held against the borehole wall by pressure differential
The model monitors torque trends, overpull on connections, drag while tripping, and the rate of change in these parameters. It calculates a real-time sticking risk score based on the combination of differential pressure, hole angle, pipe contact time, and filter cake thickness proxy. Alerts fire when the risk score crosses the prevention threshold.
Single model, three classifications, simultaneous execution
A conventional system needs separate alarms for kicks, losses, and stuck pipe, each configured with thresholds that may conflict. The AI model evaluates all three hazard probabilities at every time step from the same sensor input, so a single pressure anomaly is classified as kick risk or loss risk based on the full context rather than which alarm threshold happens to be lower.
Manual drilling surveillance versus AI hazard prediction
The operational difference is not marginal — it is the gap between catching a problem after it starts and preventing it before it escalates. Every row in this table represents a decision point where timing determines whether the outcome is a routine adjustment or a multimillion-dollar incident.
| Drilling Decision | Manual Surveillance | AI Prediction | Outcome Difference |
| Kick detection |
Pit gain alarm after 1-2 bbl gain |
Flow imbalance detected 15-30 min earlier |
Shut-in before influx reaches surface |
| Lost circulation identification |
Flow-out drop below alarm threshold |
Progressive loss trend detected at 5% deficit |
Mud weight reduction before total loss |
| Stuck pipe prevention |
Overpull alarm when pipe will not move |
Sticking risk score rising over multiple stands |
Back-ream or condition mud before sticking |
| Wellbore instability |
Torque and cavings noticed on tour change |
Continuous instability index with trend |
Mud weight adjustment before collapse |
| Swab and surge monitoring |
Pressure spike alarm during trip |
Predicted swab-surge compared to window |
Trip speed adjusted before threshold breach |
| Pore pressure update |
Pre-drill model, updated after well |
Real-time update from drilling response |
Current mud weight validated continuously |
| Fracture gradient update |
LOT/FIT data at casing points only |
Continuous estimate from loss indicators |
Window refined between casing points |
| Mud weight optimization |
Engineer judgment, conservative margin |
Minimum safe weight calculated from window |
Less overbalance, fewer losses, faster ROP |
See AI drilling hazard prediction running against your well sensor data
iFactory trains the hazard model on your sensor configurations, wellbore geometry, and drilling fluid properties — so every alert is calibrated to your rigs instead of generic thresholds.
Early warning indicators the model fuses into a single hazard score
No single sensor parameter reliably predicts a drilling hazard. The model combines dozens of surface measurements into context-dependent relationships that are meaningful only when analyzed together. Here are the primary indicator groups and how the model uses each one.
FLOW SIGNALS
Flow-In vs Flow-Out Differential
Weight: High
The most direct indicator of both kicks and losses. The model does not wait for a fixed threshold — it learns the normal flow differential for each pump rate and mud configuration and flags deviations that are statistically significant relative to the learned baseline, catching problems at 5% imbalance instead of the standard 10-15% alarm setpoint.
PRESSURE SIGNALS
Standpipe and Annular Pressure Trends
Weight: High
Pump pressure decreases during a kick as lighter formation fluid enters the annulus, and increases during losses as the annulus fills with heavier mud or as lost circulation restricts return flow. The model tracks pressure trend direction and rate relative to pump rate changes to separate hazard signatures from normal drilling pressure variations.
VOLUME SIGNALS
Active Pit Volume Changes
Weight: Medium
Pit gain confirms a kick and pit loss confirms circulation loss, but pit volume is noisy — affected by mud additions, transfers, temperature expansion, and sensor drift. The model correlates pit changes with flow differential and pressure trends to confirm whether a volume change is a real hazard or an operational artifact.
MECHANICS SIGNALS
Torque, Drag, and ROP Deviations
Weight: Medium
Increasing torque and drag over multiple stands indicate developing wellbore instability or differential sticking risk. ROP changes can indicate pore pressure transition zones. The model tracks these as slow-moving trends rather than instantaneous values, building risk over time rather than firing on a single spike.
Kick detection: reactive alarm versus AI early warning
The timeline below shows the same kick event managed two ways. In the reactive case, the driller responds after the pit gain alarm. In the AI case, the model flagged the developing influx 20 minutes earlier — enough time to increase mud weight or shut in before the kick reached a critical volume.
WITHOUT AI PREDICTION
Reactive Alarm Response
T+0 min
Formation pressure exceeds mud hydrostatic. Influx begins entering wellbore. No surface indication yet.
T+18 min
Flow-out exceeds flow-in by 8%. Within normal sensor noise. No alarm triggered.
T+28 min
Pit gain reaches 2 bbl threshold. Flow-out now 18% above flow-in. Alarm fires.
T+30 min
Driller shuts in well. Influx volume estimated at 12 bbl. Well control procedures initiated. Potential for kick escalation.
WITH AI PREDICTION
Predictive Early Warning
T+0 min
Same formation pressure exceedance. AI model monitoring all sensor channels continuously.
T+8 min
AI detects flow-out trending above flow-in at a rate inconsistent with normal variation. Kick probability score rises to 65%.
T+10 min
Alert sent to driller: developing influx detected. Recommended action: increase mud weight or prepare to shut in.
T+15 min
Driller increases mud weight. Influx stops. Total influx volume under 2 bbl. No well control event. Well continues drilling.
The AI hazard prediction workflow from sensor to alert
Every prediction cycle follows a five-stage pipeline that runs continuously while drilling. The model processes new data every one to five seconds depending on sensor sample rate, updating hazard probabilities and alert status in real time.
01
Sensor Data Ingestion
Surface sensor data streamed at 1-5 second intervals — pump rate, flow-in, flow-out, standpipe pressure, annular pressure, pit volume, torque, ROP, hookload, rotary speed, gas units, and mud temperature. All time-stamped and validated against sensor health rules.
02
Noise Filtering and Normalization
Pump noise, trip effects, mud transfers, and temperature cycles are identified and separated from formation-related signals. Each parameter is normalized against its operating context — the same flow differential means something different at 300 GPM versus 800 GPM.
03
Multi-Parameter Feature Extraction
The model computes derived features from sensor combinations — flow differential normalized by pump rate, pressure trend rate of change relative to depth, torque-drag ratio as a function of hole angle and pipe speed. These combined features carry hazard information that no single sensor contains.
04
Hazard Probability Classification
Three classification models run simultaneously — kick probability, loss probability, and stuck pipe probability. Each outputs a confidence score from 0 to 100% at every time step, with the score reflecting how strongly the current sensor pattern matches the trained hazard signature.
05
Alert Generation and Escalation
When any hazard probability crosses its alert threshold, the system generates a contextual alert that includes the hazard type, confidence level, contributing parameters, recommended action, and time to potential event. Alerts escalate from advisory to warning to critical as probability increases.
Frequently asked questions
What surface sensors are required for the AI hazard prediction model?
The minimum sensor set includes pump rate, flow-in, flow-out, standpipe pressure, active pit volume, torque, ROP, and hookload. Gas units, annular pressure, mud temperature, and rotary speed significantly improve classification accuracy but are not strictly required. The model adapts to whatever sensor suite your rig has available and degrades gracefully when individual sensors are offline rather than failing completely.
Book a demo to get a sensor requirements assessment for your rig configuration.
How does the AI distinguish a real kick from trip-related flow fluctuations?
Trips, connections, and pump speed changes create pressure and flow transients that mimic kick or loss signatures to individual sensors. The model handles this in two ways: first, it receives pipe motion and pump state signals as contextual inputs so it knows when a trip or connection is occurring; second, it learns the specific transient signature of normal operations on your rig and classifies any deviation from that learned pattern as anomalous rather than comparing against a fixed threshold.
Contact our support team to understand how trip-related noise is handled in your specific drilling program.
Does the model work on high-angle and horizontal wells where hazards behave differently?
High-angle and horizontal wells are where AI hazard prediction delivers the most value because conventional threshold alarms are calibrated for vertical well physics that do not apply at 60-90 degree inclination. In horizontal wells, cuttings bed accumulation creates false torque signatures, annular pressure profiles are fundamentally different, and differential sticking risk is orders of magnitude higher. The model is trained on wellbore trajectory as an input feature so it learns the different hazard signatures for each inclination regime.
Book a demo to see how trajectory-dependent modeling works on your horizontal well data.
What happens when the model generates a false alarm — does it disrupt drilling operations?
The alert system uses a three-tier escalation structure — advisory, warning, and critical — that maps to different operational responses. Advisory alerts are informational only and do not require driller action. Warning alerts recommend investigation and potential action. Only critical alerts, which require immediate response, are designed to interrupt operations. The threshold for each tier is calibrated during deployment to match your operational risk tolerance, and the calibration is refined based on confirmed true and false alarm feedback from the drilling team.
Contact our support team to discuss alert calibration for your operation.
How long does it take to deploy AI hazard prediction on an active drilling rig?
A single-rig deployment typically takes 6-10 weeks. The first two weeks cover sensor data audit, WITSML connection setup, and data quality validation. The next two to four weeks run the model in shadow mode alongside your existing alarms, building rig-specific baselines without generating operational alerts. The final two to four weeks transition to live advisory alerts, calibrate escalation thresholds based on driller feedback, and train the rig crew on the alert response protocol.
Book a demo to scope a deployment timeline for your rig.
Turn drilling surveillance from threshold alarms into AI-predicted hazard prevention
iFactory delivers sensor fusion, multi-hazard classification, real-time risk scoring, and contextual alerts as a single on-premise stack. Book a demo and run the model against your next well's sensor data.