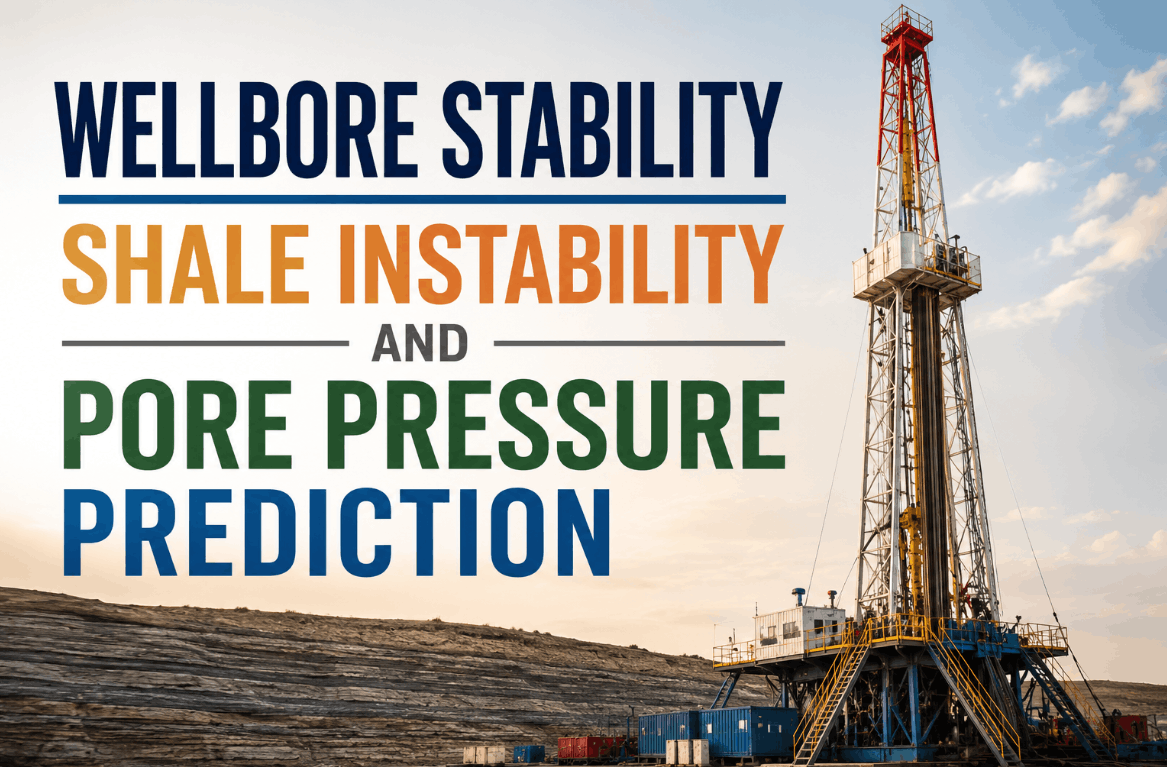
Wellbore Stability Shale Instability and Pore Pressure Prediction
By Henry Green on June 16, 2026
Wellbore instability remains one of the most expensive and persistent problems in drilling operations across the United States, Canada, the UK, and Australia — stuck pipe, hole pack-off, lost circulation, and outright wellbore collapse account for a disproportionate share of non-productive time on almost every program that crosses a reactive shale or an overpressured interval. The root cause is rarely a single bad decision; it is a mud weight that drifted outside a window bounded by pore pressure on one side and fracture gradient on the other, often because that window was built on outdated offset data instead of the formation actually being drilled. iFactory's predictive analytics platform builds and continuously updates pore pressure, fracture gradient, and mud weight window models from your own historical and real-time drilling data, so the safe operating margin reflects the well in front of you, not a regional average from years ago. Book a Demo to see how a continuously calibrated geomechanical model keeps the hole open through your next reactive shale section.
Every Stuck Pipe Event Starts With a Mud Weight Window That Was Already Wrong
iFactory's geomechanical analytics platform builds pore pressure, fracture gradient, and critical mud weight models from your own well data — continuously recalibrated against real-time drilling response so the safe operating margin reflects what's actually downhole, not what an offset report assumed.
Pore pressure prediction accuracy within ±0.3 ppg vs offset-well averaging methods
$340K
Average NPT cost avoided per well from wellbore instability prevention
76%
Reduction in stuck pipe and pack-off events after deployment
3 wks
Time to build a calibrated 1D mechanical earth model from existing well data
Why Drilling Operators in the USA, Canada, UK & Australia Are Rebuilding Their Mud Weight Windows
From the Permian Basin's reactive clay caps to North Sea HPHT reservoir sections, every drilling operator eventually meets the same wall: a mud weight that looked safe on paper turns into a kick, a loss event, or a stuck pipe incident downhole. Whether a program falls under Alberta Energy Regulator oversight, NSTA reporting in the UK, or NOPSEMA well integrity requirements offshore Australia, the underlying problem is the same — a pre-drill geomechanics study built from a handful of offset wells rarely holds up once the bit reaches a pressure ramp or a stress regime the original model never accounted for.
What separates programs that drill through reactive shale without incident from those that lose weeks to remedial operations is not access to better seismic or more logging runs — it is whether the pore pressure and fracture gradient model gets recalibrated as real drilling data comes in. Here is what that shift looks like across four major drilling markets: Book a Demo to see how continuous calibration applies to your own trend.
The Real Cost of a Mud Weight Window Built on Outdated Assumptions
Most drilling programmes are still sitting on a usable amount of offset well data they never fully apply to the next well. Logs, leak-off and formation integrity tests, mud weight histories, and drilling event records exist in disconnected reports — and without a model trained to find the pressure and stress patterns across that data, the warning signs buried in it never reach the people making mud weight decisions in real time.
Pore Pressure Models Built on Static Offset Trends
A normal compaction trend line built from a handful of offset wells assumes regional pressure behaves uniformly with depth. Local pressure ramps, depleted zones, and lateral pressure transitions often sit outside that trend entirely, and the well finds out the hard way.
Fracture Gradient Estimates Without Continuous Calibration
A single pre-drill fracture gradient curve, calibrated against one or two historical leak-off tests, rarely holds across an entire section. Without updates as new formation integrity data comes in, the margin between mud weight and the fracture ceiling quietly shrinks.
Reactive Shale Treated as a Generic Lithology
Water-sensitive shale intervals swell, disperse, or creep at rates specific to their clay mineralogy and the mud system in use. Treating every shale interval with the same inhibition strategy leaves the most reactive zones exposed to washouts and sloughing.
Stress-Dependent Breakout Risk Ignored in Trajectory Planning
Critical mud weight to prevent shear failure changes with wellbore inclination and azimuth relative to in-situ stress direction. Planning a trajectory without that stress-orientation analysis can turn an otherwise stable formation into a breakout-prone interval.
$50K–$1M+
NPT cost range per wellbore instability event across global drilling programmes
35%
Share of total drilling NPT attributed to wellbore instability in reactive shale basins
0.3–0.6 ppg
Typical margin for error before a static mud weight window fails downhole
Every Stuck Pipe Event Starts With a Mud Weight Window That Was Already Wrong
iFactory's geomechanical analytics platform builds pore pressure, fracture gradient, and critical mud weight models from your own well data — continuously recalibrated against real-time drilling response so the safe operating margin reflects what's actually downhole, not what an offset report assumed.
How iFactory Builds a Continuously Calibrated Mechanical Earth Model
iFactory does not apply a generic regional pressure trend to your well — it builds a mechanical earth model from your own offset data, then keeps recalibrating it against what the bit is actually telling you in real time. The result is a pore pressure and fracture gradient model that understands your trend's specific pressure ramps, stress orientation, and shale reactivity, not an industry average. Book a Demo to see how a calibrated model would have changed your last problem well.
01
Historical Well Data Ingestion & 1D MEM Construction
iFactory ingests offset well logs, leak-off and formation integrity test results, mud weight histories, and drilling event records to build an initial 1D mechanical earth model: pore pressure, overburden, minimum and maximum horizontal stress, and rock strength versus depth.
02
Pore Pressure Trend Calibration Against Local Pressure Indicators
Resistivity, sonic velocity, and corrected drilling exponent trends are calibrated against confirmed pressure points from offset wells, sharpening the normal compaction trend instead of relying on a single regional curve.
03
Fracture Gradient & Breakout Window Modelling Across Trajectory
Critical mud weight for shear and tensile failure is calculated across the planned inclination and azimuth range, surfacing the trajectory orientation that minimises breakout risk before the well is spud.
04
Real-Time Drilling Response Comparison While Drilling
Predicted pore pressure and fracture gradient are continuously checked against observed mud weight response, ECD trends, gas shows, and torque and drag — flagging deviations between the model and the formation while there is still time to adjust.
05
Shale Reactivity & Mud System Compatibility Flagging
Clay mineralogy and water sensitivity indicators from offset cuttings and log data are matched against the planned mud system's water activity and inhibition chemistry, flagging intervals where swelling or dispersion risk is elevated.
06
Continuous Model Update From Confirmed Well Outcomes
Every leak-off test, kick, loss event, and confirmed pressure point feeds back into the model, sharpening pore pressure and fracture gradient accuracy for the next well drilled in the same trend.
Proven KPI Results: Wellbore Stability Impact from Live Drilling Programmes
iFactory's geomechanical analytics platform delivers measurable NPT reduction within the first few wells of a programme. The following KPIs reflect aggregated performance data across vertical, directional, and lateral wells drilled through reactive shale and overpressured intervals in the USA, Canada, UK, and Australia.
92%
Pore Pressure Prediction Accuracy
Validated within ±0.3 ppg across rotating offset calibration sets, compared to the wider error bands typical of static regional trend extrapolation.
76%
Reduction in Stuck Pipe & Pack-Off Events
Continuous mud weight window monitoring catches drift toward the pore pressure or fracture gradient boundary before it becomes a tight hole event.
71%
Reduction in Lost Circulation Incidents
Tighter fracture gradient calibration against live formation integrity data keeps planned mud weight inside a margin the formation can actually hold.
$340K
Average NPT Cost Avoidance Per Well
Avoided stuck pipe, sidetrack, and lost circulation events translate directly into reduced rig time and fewer remedial operations.
0.3 ppg
Mud Weight Window Accuracy Gain
Calibrated models narrow the uncertainty band around pore pressure and fracture gradient, widening the usable operating margin without added risk.
3 Weeks
Time to Build a Calibrated 1D MEM
Offset data ingestion, trend calibration, and trajectory stress analysis completed without a months-long standalone geomechanics study.
<5%
False Pressure Alert Rate
Cross-validated against multiple pressure indicators before a real-time alert is raised
Real-time
Pore Pressure & ECD Comparison
Predicted vs observed drilling response updated continuously while drilling
10 Days
Offset Data Integration Timeline
Historical log, LOT/FIT, and mud weight history ingestion across multi-well datasets
68%
Reduction in Breakout-Related NPT
Across directional and lateral wells with stress-oriented trajectory planning
How iFactory Compares to Standard Pre-Drill Geomechanics Studies
Most pre-drill geomechanics studies apply a regional pressure trend and a fracture gradient curve calibrated once, then file the report away once drilling starts. iFactory is built differently — recalibrating continuously against real-time drilling response so the model never goes stale mid-well. Book a Demo to see how a continuously calibrated model compares to your current pre-drill workflow.
Capability
Standard Pre-Drill Geomechanics Study
iFactory Platform
Pore Pressure Model Basis
Static regional trend built once before spud, rarely revisited mid-well.
Continuously calibrated against real-time drilling response and confirmed pressure points throughout the well.
Fracture Gradient Calibration
Calibrated against one or two historical leak-off tests at the planning stage.
Recalibrated automatically as new LOT/FIT and mud weight response data come in.
Trajectory Stress Analysis
Often a generic vertical-well assumption applied regardless of planned inclination.
Critical mud weight modelled across the full inclination and azimuth range before spud.
Shale Reactivity Assessment
Lithology described qualitatively; mud system chosen from general basin experience.
Clay mineralogy and water activity compatibility flagged per interval from offset log and cuttings data.
Real-Time Model Updates
Standalone report delivered pre-spud; no live comparison once drilling starts.
Predicted vs observed pressure, ECD, and torque/drag compared continuously while drilling.
Turnaround Timeline
6–10 weeks typical for a full geomechanics study and report.
3-week model build, with live monitoring active before the next well is spud.
3-Week Build & Calibration Plan: From Offset Data to a Live Model
Every iFactory wellbore stability engagement follows a structured 3-week build with defined deliverables per week, calibrated against your own offset data rather than a regional average. No open-ended geomechanics studies, and no waiting until the next problem well to find out the model was wrong.
Week 1
Data Audit & 1D MEM Construction
Offset well log, LOT/FIT, and mud weight history audit across the target trend
Initial pore pressure, fracture gradient, and rock strength model construction
Mud system compatibility review against known shale reactivity indicators
Week 2
Trajectory Stress Analysis & Calibration
Critical mud weight modelled across the planned inclination and azimuth range
Pore pressure and fracture gradient trends calibrated against confirmed offset pressure points
Real-time monitoring thresholds configured ahead of spud
Week 3
Live Monitoring & Model Handover
Real-time pore pressure and ECD comparison activated for the spud well
Drilling and wellbore stability teams trained on model outputs and alert thresholds
Baseline mud weight window report delivered for the well programme
RESULTS FROM THE FIRST WELL
Operators completing the 3-week model build report avoiding an average of $290,000 in stuck pipe and lost circulation costs on the very first well drilled against the calibrated model, with pore pressure accuracy validated within ±0.3 ppg by the end of week 2.
$290K
Avg. avoided cost on first well
±0.3 ppg
Pore pressure accuracy by week 2
76%
Reduction in stuck pipe events
What Drilling & Wellbore Stability Engineers Say About iFactory
The following testimonial is from a senior drilling engineer at an operator currently running iFactory's geomechanical analytics platform across an unconventional shale programme in the USA.
We were treating every well in the trend with the same fracture gradient curve, calibrated from a leak-off test drilled four years earlier. iFactory rebuilt that model against our own offset data and started flagging trajectory-specific breakout risk that our static study had never accounted for. On our last three wells through the same reactive shale interval, we had zero stuck pipe events and cut our lost circulation material spend by more than half. The model finally matches the rock we're actually drilling through.
Senior Drilling Engineer
Unconventional Shale Operator, Permian Basin, USA
Financial Impact and NPT Avoidance by Failure Mode
Beyond avoided remedial operations, a calibrated mud weight window protects rig schedule and well economics directly — quantified below by failure mode from live drilling programmes across the USA, Canada, UK, and Australia.
Stuck Pipe & Pack-Off Events
$180K
Average avoided cost per well from early mud weight window drift detection — avoiding fishing operations, sidetracks, and rig standby time at $80,000–$400,000 per stuck pipe incident.
Lost Circulation & Wellbore Strengthening
$95K
Average savings per well from tighter fracture gradient calibration — reducing lost circulation material consumption and avoiding remedial cement squeeze operations.
Shale Sloughing & Hole Cleaning Remediation
$65K
Average savings per well from matched mud inhibition chemistry — avoiding washouts, cavings-related pack-off, and extended wiper trip cycles in reactive shale intervals.
Data Integration & Compliance Readiness Checklist
Offset well log, LOT/FIT, and mud weight history ingestion — no manual re-keying of historical reports
Real-time MWD/LWD and mud logging data ingestion via WITSML and standard rig data feeds
API RP 13D-aligned hydraulics data compatibility for ECD and surge/swab modelling
Trajectory and survey data integration for inclination and azimuth-dependent stress analysis
NORSOK D-010 aligned well integrity barrier documentation generated from confirmed wellbore stability events
NSTA and NOPSEMA reporting-compatible output structure for international operators
Conclusion: A Stable Wellbore Starts With a Model That Matches the Rock
Wellbore instability is rarely a surprise to the formation — it is a surprise to a model that was never updated once drilling started. A pore pressure curve calibrated once from a handful of offset wells, a fracture gradient estimate held over from a single leak-off test, and a trajectory plan that ignores stress orientation are each individually manageable risks that compound into stuck pipe, lost circulation, and sidetracks when left unchecked.
iFactory closes that gap in three weeks. A mechanical earth model built from your own offset data, continuous recalibration against real-time drilling response, trajectory-specific breakout analysis, and shale reactivity flagging matched to your mud system — deployed without months-long standalone geomechanics studies or generic regional assumptions.
The $340,000 average NPT cost avoidance per well, the 76% reduction in stuck pipe and pack-off events, and the 71% reduction in lost circulation incidents are outcomes already measured at live drilling programmes. They are available to any drilling team willing to let their offset data start working for the well they are about to drill.
Frequently Asked Questions
Meaningful calibration starts with as few as 3–5 offset wells with logging and pressure data. Accuracy improves further as more confirmed pressure points are added from the same trend.
Yes. Critical mud weight is modelled across the full inclination and azimuth range relative to in-situ stress direction before the well is even spud.
Yes. Clay mineralogy and water activity compatibility are flagged per interval so the mud inhibition chemistry matches the actual reactivity of the shale being drilled.
The model recalibrates automatically against new leak-off and formation integrity test results as they come in, rather than relying on a single pre-drill estimate.
A full data audit, model build, and trajectory stress analysis is typically completed within 3 weeks, with live monitoring active before the next well is spud.
Stop Losing Rig Time to a Mud Weight Window That Was Already Wrong
iFactory gives drilling and wellbore stability teams a mechanical earth model trained on their own offset data, continuous real-time recalibration, trajectory-specific breakout analysis, and shale reactivity flagging — fully built in 3 weeks, with results measured from the first well.