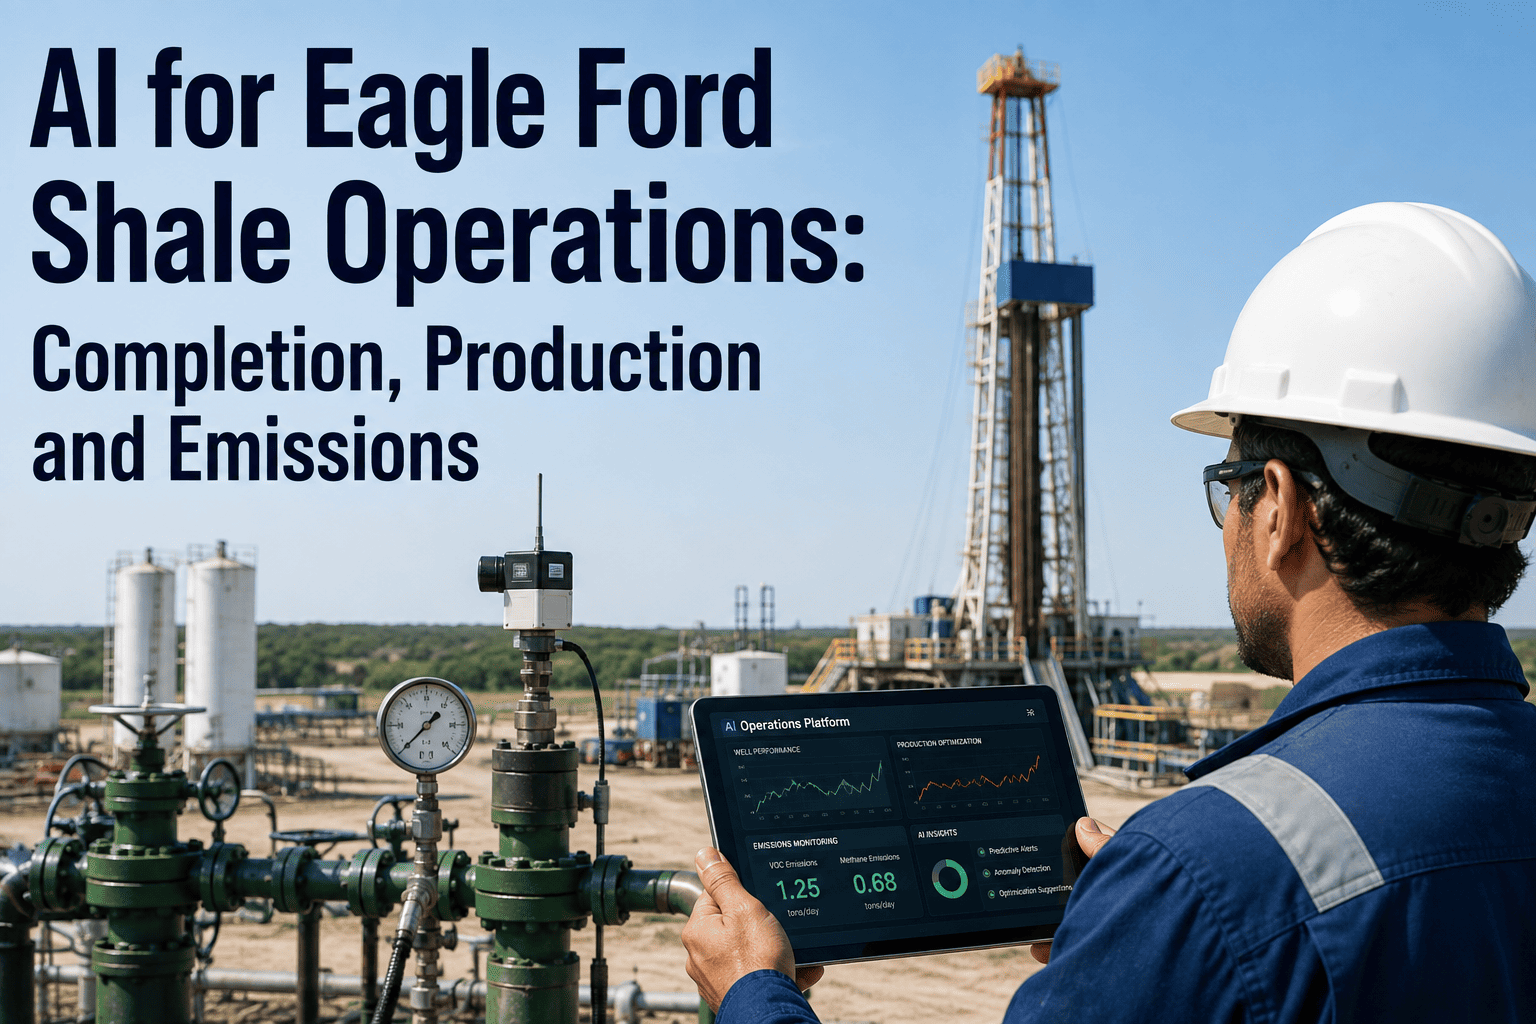
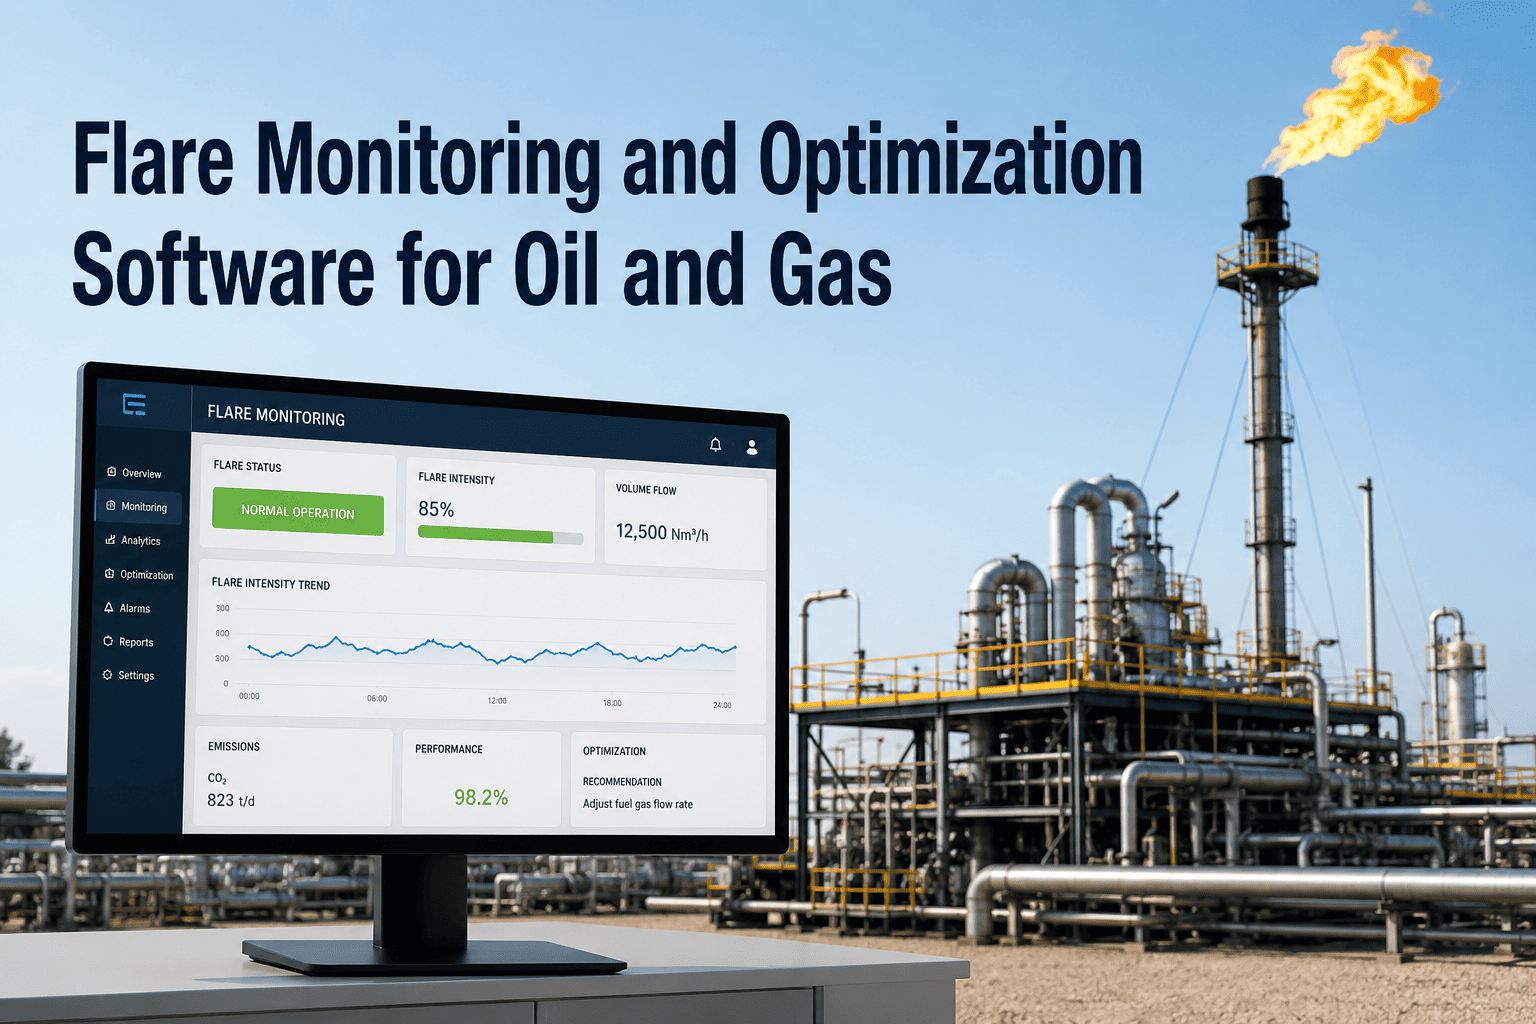
North Dakota regulators hold Bakken operators to a 91% gas capture target, and every winter the basin's own weather makes that number harder to hit than the rest of the year combined. Wind chills near -60F turn wellhead lines, compressor suction scrubbers, and gathering system low points into freeze-off risks within hours, forcing shut-ins that cut both oil output and capture percentage at the same time. Most operators still catch a freeze-off after a pressure alarm trips or a pumper's morning route finds a dead well, by which point the gas that should have counted toward capture has already been flared or lost entirely. AI software built for Bakken's specific combination of NDIC reporting rules and sub-zero operating conditions closes that gap by predicting freeze-off risk and capture drift before either one shows up on a monthly report. Operators can see how that model is scoped for their own pad configuration by contacting the iFactory support team.
Winter Doesn't Care About Your Gas Capture Percentage. Your Software Should.
iFactory's AI models freeze-off risk, gathering line liquid loading, and real-time gas capture percentage across every Bakken pad, so cold-weather curtailments get planned instead of discovered after a well is already shut in.
Why Gas Capture Compliance Gets Hardest Exactly When It Matters Most
North Dakota's gas capture policy was built around infrastructure buildout, not weather, but weather is what actually decides whether a pad hits its number in any given month. Associated gas production in the Bakken carries an unusually high liquid content, and every degree the temperature drops raises the odds that water and hydrocarbon liquids condense out and freeze somewhere between the wellhead and the gathering line. When that happens, operators face a choice between flaring the gas that can't reach the line or shutting the well in, and both outcomes work against the same capture percentage the state is measuring.
Wellhead and Flowline Icing
Water vapor in the gas stream crystallizes at exposed valves, chokes, and flowline low points, physically blocking flow before a compressor even sees a pressure change.
Gathering System Liquid Loading
Cold temperatures slow liquid dropout rates in gathering lines, and accumulated liquids disrupt compressor suction, which is the failure mode state officials point to most often during hard freezes.
Hydrate Formation in the Gas Stream
Water and hydrocarbon molecules combine into ice-like hydrate crystals under the exact pressure and temperature conditions common on a Bakken pad in January, blocking flow independent of ambient icing.
Reactive Shut-Ins
Once a freeze-off is discovered, the standard response is shutting the well in to avoid flaring, which protects the capture number for that well but removes its production entirely until the line thaws.
North Dakota's Gas Capture Policy, in the Numbers That Matter
The state's capture targets climbed steadily as gathering and processing infrastructure expanded, and understanding that trajectory explains why every percentage point still matters to a Bakken operator's compliance standing today.
| Milestone | Capture Target | What Changed |
|---|---|---|
| October 2014 | 74% | Initial NDIC target following the Petroleum Council's flaring task force recommendations |
| January 2016 | 85% | Rapid gathering and processing capacity buildout across the core Bakken counties |
| November 2018 | 88% | Producers self-restricted output by roughly 99,000 bpd statewide to hold the line on capture |
| November 2020 | 91% | Current statewide target, still in effect and enforced through monthly reporting |
See What Your Pads Would Have Reported Last Winter
iFactory can model freeze-off exposure and capture drift against your own historical production data before your team commits to a rollout.
Monthly Reporting vs. Continuous Freeze-Off Prediction
Most Bakken operators still manage gas capture as a monthly compliance number rather than a daily operating variable, which means the first sign of trouble often arrives well after the gas has already been lost.
| Capability | Monthly Reporting Approach | AI-Driven Continuous Monitoring |
|---|---|---|
| Freeze-off detection | Found on the next pumper route or pressure alarm | Predicted from temperature, pressure, and liquid-loading trends before flow stops |
| Capture percentage visibility | Calculated once, at month end, per NDIC filing | Tracked per well and per pad continuously, updated as conditions change |
| Methanol dosing | Fixed schedule regardless of forecast | Adjusted ahead of forecasted cold snaps based on well-specific water content |
| Curtailment decisions | Reactive, made after a well is already flaring or shut in | Planned in advance around predicted gathering system capacity |
What the AI Model Actually Tracks Across a Bakken Pad
Freeze-Off Risk Scoring
Live ambient temperature, wind chill forecasts, and line pressure trends combine into a per-well risk score, so the highest-exposure wells surface before a cold snap arrives.
Gathering System Liquid Loading
Compressor suction pressure and flow variance are modeled continuously to catch liquid accumulation before it disrupts a compressor station serving multiple pads at once.
Real-Time Capture Percentage
Gas sold, gas used on-site, and gas flared are reconciled continuously against total gross withdrawals, giving a live read on where each pad stands against the 91% target.
Methanol and Chemical Dosing Optimization
Injection rates are adjusted per well based on predicted water content and forecasted temperature, rather than a flat schedule applied across an entire field.
A Composite Scenario: The Cold Snap That Didn't Cost a Month's Capture Number
A mid-size Bakken operator running roughly forty wells across three pads had a recurring pattern every January: a hard cold snap would push two or three wells into freeze-off, and by the time field crews found them on their routes, the wells had been down long enough to pull the whole field's monthly capture percentage below target. After connecting wellhead pressure, temperature, and gathering system flow data to a predictive model, the operator's team received a freeze-off risk alert on four wells eighteen hours ahead of a forecasted wind chill drop to -40F.
Field crews pre-emptively increased methanol injection on the flagged wells and adjusted gathering line insulation checks on the highest-risk flowline segment before the cold arrived. Two of the four wells would have frozen off under the field's normal response pattern; none did. The pad's capture percentage for the month held at 92.4%, and the operator avoided the self-restriction conversation that had followed nearly every hard freeze in the previous three winters.
Rolling AI Monitoring Out Across a Bakken Field
Baseline the Highest-Risk Wells
Start with wells that have a documented freeze-off history or sit farthest from a compressor station, where liquid loading effects are most pronounced.
Connect Existing SCADA and Weather Data
Wellhead pressure, temperature, and flow tags already collected by field SCADA feed the model directly, with forecast data layered on top.
Validate Risk Scores Against a Real Cold Event
The model's predicted risk scores are checked against actual field response during the next cold snap before crews rely on it for dosing and staffing decisions.
Expand to Full-Field Capture Tracking
Once freeze-off prediction is proven on the initial well set, live capture percentage tracking rolls out across the remaining pads for continuous NDIC reporting visibility.
Common Mistakes Bakken Operators Make With Winter Gas Capture
Treating Capture as a Monthly Filing, Not a Daily Metric
Waiting for the end-of-month NDIC number to reveal a problem means the field already lost the gas that would have fixed it.
Applying the Same Methanol Schedule Field-Wide
Wells vary widely in water content and exposure, so a flat dosing schedule over-treats some wells while leaving others under-protected during a cold snap.
Missing Compressor-Level Liquid Loading
Focusing only on wellhead freeze risk overlooks gathering system compressors, which state officials point to as a primary failure point during extreme cold.
Reacting After a Pumper Finds a Dead Well
Manual field routes are often the first and only detection method, which means a freeze-off can sit undiscovered for hours during the coldest, highest-risk stretch of a storm.
Frequently Asked Questions
What gas capture percentage does North Dakota actually require Bakken operators to hit?
North Dakota's current statewide target, set by the NDIC in November 2020, requires operators to capture and sell at least 91% of gross gas withdrawals rather than flaring or venting it. The target climbed steadily from 74% in 2014 as gathering and processing infrastructure expanded across the basin. Operators who fall short can face self-restricted output, since the state has previously required voluntary curtailment when capture performance slipped. Teams can walk through how their own historical capture performance compares by reaching out to iFactory support.
Why do cold temperatures specifically hurt gas capture in the Bakken?
Bakken associated gas carries an unusually high liquid and water content, and cold temperatures cause that water to condense and freeze at wellheads, flowlines, and gathering system compressors. When a freeze-off blocks flow, operators typically shut the well in to avoid flaring the trapped gas, which removes that well's production and its capture contribution entirely until the line thaws. Severe events, like the extreme cold that has knocked out several hundred thousand barrels a day of Bakken production in past winters, can take two to four weeks to fully recover from.
How does AI actually predict a freeze-off before it happens?
The model combines live wellhead pressure and temperature readings with forecasted wind chill and known liquid content for that specific well, then flags wells where the combination crosses a risk threshold associated with past freeze-off events. Because the scoring is per-well rather than field-wide, it accounts for the fact that some wells sit farther from a compressor station or carry higher water cuts than others. That lead time is what lets field crews pre-emptively adjust methanol dosing instead of discovering the problem on a pressure alarm.
Do we need new field hardware to get this kind of monitoring, or does it use what we already have?
Most Bakken pads already collect wellhead pressure, temperature, and flow data through existing SCADA systems, and that data is what the predictive model uses as its primary input. Weather forecast data is layered on top rather than requiring new sensors, and most deployments start with the highest-risk wells before expanding. Book a demo to see what a rollout looks like against your existing SCADA tag list.
Can this help during a severe, basin-wide event like an extreme cold snap or blizzard, not just routine winter operations?
Yes, though the value shifts slightly during a basin-wide event, since infrastructure-level constraints like compressor and processing plant capacity start to matter as much as individual well risk. Continuous capture and freeze-off tracking still gives operators an early, well-by-well view of where damage is concentrated, which speeds up prioritizing recovery once conditions allow crews back into the field. Historical events have shown recovery can take weeks, so knowing which wells and lines to prioritize first meaningfully shortens that timeline.
Stop Finding Out About a Freeze-Off From a Pumper's Morning Route
iFactory builds AI freeze-off prediction and real-time gas capture tracking around your Bakken field's own SCADA data, so cold-weather compliance becomes a planned operation instead of a monthly scramble.