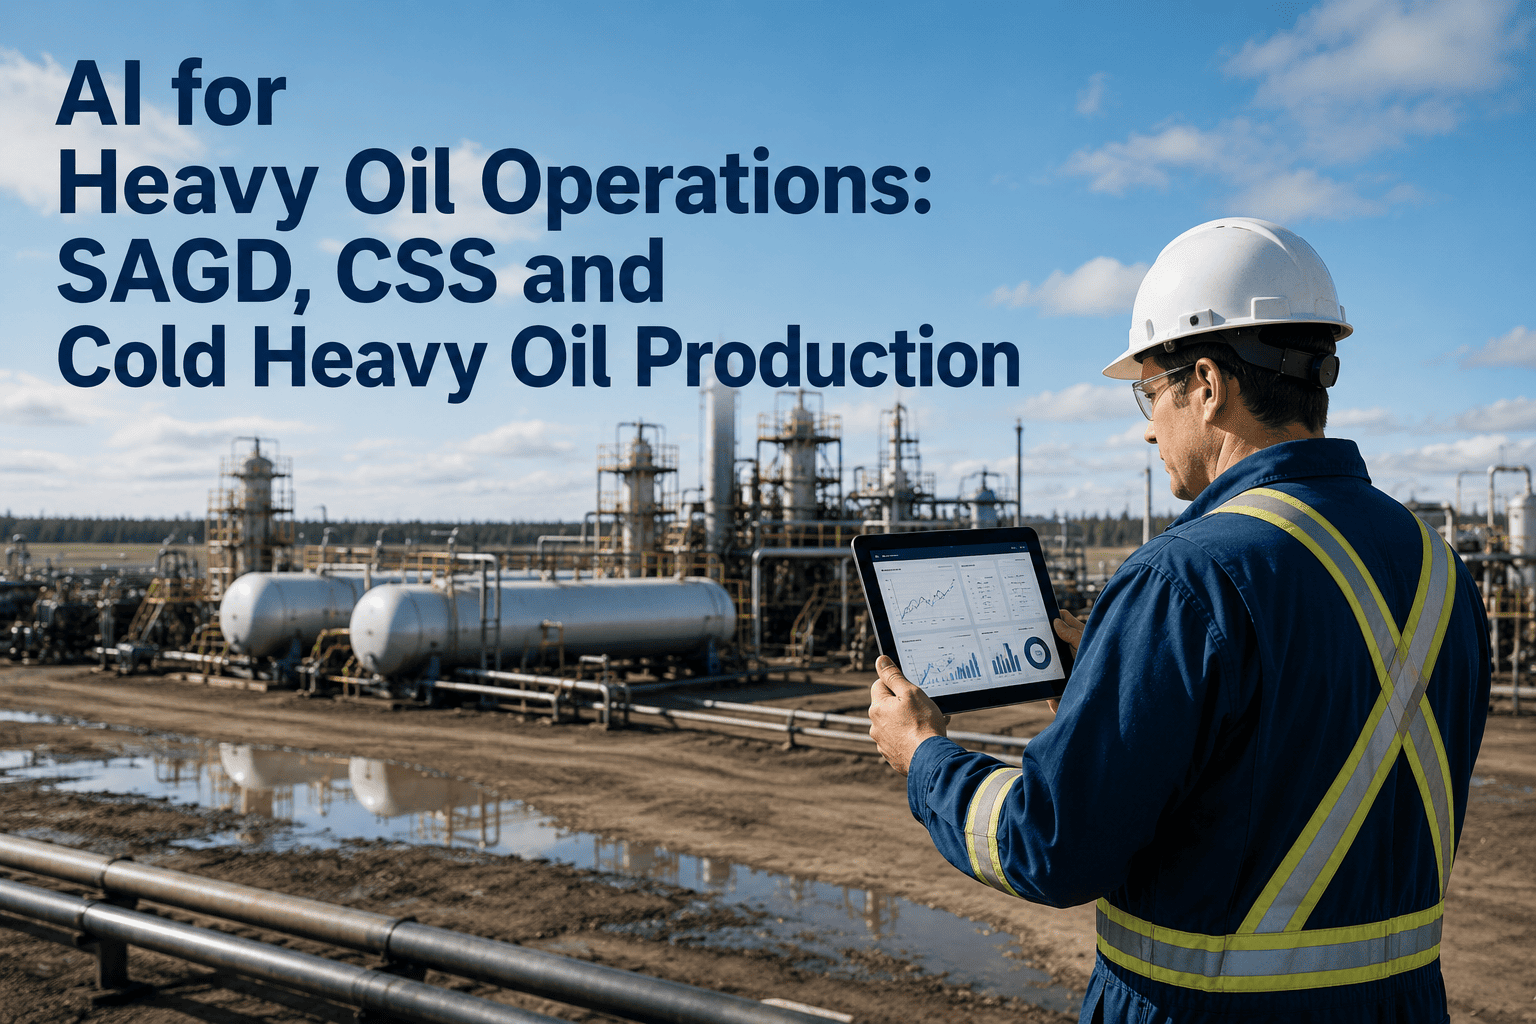
Three heavy oil recovery methods dominate the reservoirs too viscous for conventional pumping, and each one lives or dies on a different number. SAGD lives on steam-to-oil ratio — every barrel of steam costs fuel, water treatment, and emissions, so a project running SOR 2.4 is fundamentally more profitable than one running SOR 3.5 on the same reservoir. CSS lives on cycle timing — steam, soak, and produce phases that are called too early or too late leave oil in the ground every single cycle. CHOPS lives on sand management — the wormhole network that makes cold production viable is invisible until it isn't, and a poorly managed sand cut turns a productive well into a workover. Most operators still tune these three processes on engineering judgment and monthly production review. AI-assisted optimization compresses that review cycle down to daily, well-by-well decisions, and it's worth seeing what that actually changes before your next steam allocation meeting — reach out through support to see it against your own field data.
One Reservoir, Three Recovery Methods, One AI Layer
iFactory's heavy oil AI optimizes steam-to-oil ratio in SAGD, cycle timing in CSS, and sand cut management in CHOPS — tuned to your specific reservoir, not an industry rule of thumb.
Three Processes, Three Very Different Economics
Before optimizing any of these methods, it helps to see them side by side. Each one recovers heavy oil through a different mechanism, and each one has a different ceiling on how much AI-driven tuning can realistically improve.
Paired horizontal wells — steam continuously injected into the upper well mobilizes bitumen, which drains by gravity into a producer roughly five metres below.
A single well alternates steam, soak, and production phases at pressures near or above reservoir fracture pressure, repeating the cycle as recovery declines.
No steam at all — sand is produced deliberately alongside oil, forming high-permeability wormholes that let foamy oil flow to the wellbore.
The Benchmarks That Define an Efficient Operation
These are the numbers reservoir and production engineers already track. AI optimization does not change what "good" looks like — it changes how consistently a field operates near the good end of the range instead of drifting toward the expensive end between review cycles.
What the AI Actually Tunes, Process by Process
Each recovery method needs a different optimization loop, because each one fails in a different way. Here is what the model watches and adjusts for each of the three processes, running continuously rather than at the next scheduled production review.
Model steam chamber growth from injection temperature, pressure, and well-pair conformance data in near real time.
Flag well pairs where subcool or chamber shape is drifting toward steam breakthrough before SOR visibly worsens.
Recommend injection rate and pressure adjustments per well pair to hold subcool in its efficient operating band.
Reallocate steam across the pad toward well pairs producing the most incremental oil per unit of steam.
Track declining production rate and rising water cut against historical cycle curves for that specific well.
Predict the point where continued production yields less oil than a fresh steam cycle would recover.
Recommend soak duration based on formation heat retention rather than a fixed days-per-cycle default.
Sequence which wells re-enter steam phase first when rig or steam generation capacity is shared across a pad.
Monitor sand cut trend and pump load signatures to track wormhole development around each wellbore.
Distinguish healthy, productive sand cut from the early signature of sand bridging or pump wear.
Recommend drawdown and pump speed adjustments that sustain sand production without accelerating equipment failure.
Prioritize well interventions ahead of an unplanned workover instead of reacting after production has already dropped.
See Where Your Wells Sit Against These Benchmarks
Bring production and steam data from a representative pad and iFactory's team will show you, well by well, how close your operation runs to the efficient end of the range — and what closing the gap is worth.
What Tighter Control Is Worth, Process by Process
Independent reservoir studies give a sense of the range on the table. AI optimization does not invent new physics — it makes the difference between a well operating at the favorable end of these published ranges instead of the costly end, consistently, across an entire pad.
Figures above come from published reservoir simulation and field studies and describe process-level potential, not a guaranteed result for any specific well. Actual gains depend on reservoir quality, well condition, and how consistently the recommended adjustments are executed in the field.
Five Ways Heavy Oil Wells Quietly Lose Recovery
None of these mistakes look dramatic in the moment. They show up as a slightly worse SOR, a slightly shorter cycle, a slightly higher water cut — and compound across a pad over months before anyone traces the loss back to its source.
Fixed steam allocation across a pad
Steam split evenly across well pairs ignores that some pairs are converting steam into oil far more efficiently than others at any given point in the chamber's life.
CSS cycles run on a calendar, not a curve
A standard days-per-cycle schedule leaves oil behind on wells that would benefit from a longer soak and wastes steam on wells ready to re-enter production early.
Sand cut treated as a single pass-fail threshold
CHOPS wells get shut in or throttled at a fixed sand cut number, when the underlying pump load and wormhole signature often tell a more specific story.
Subcool monitored monthly instead of continuously
By the time a monthly production report shows SOR degrading, the steam chamber has often already drifted out of its efficient shape for weeks.
Post-primary follow-up decided late, if at all
CHOPS wells with strong wormhole development are prime candidates for follow-up recovery, but that window is often missed because no one is tracking it well by well.
Frequently Asked Questions
Does the AI work across SAGD, CSS, and CHOPS on the same field, or is it built for one process only?
It is built to run all three, because most heavy oil operators are not running a single method across an entire asset — a field can carry SAGD pads, legacy CSS wells, and CHOPS acreage at the same time. The model applies the optimization logic relevant to each well's actual recovery method rather than forcing every well through the same steam-focused analysis. If your asset mixes methods, that is a common starting point for a scoping conversation — book a demo and bring wells from more than one process.
How much historical data does the model need before it can make useful recommendations?
Recommendations improve with history, but the model starts generating useful output from whatever production, steam, and pressure data your field already collects — most operators already have this in a historian or SCADA system. Wells with a longer operating history and denser well-pair or downhole sensor data get tighter, more confident recommendations sooner, while newer wells start with wider guidance that narrows as data accumulates.
Can this replace our reservoir engineers' judgment on steam allocation and cycle timing?
No, and it is not built to. The model surfaces which wells are drifting away from efficient operation and recommends a specific adjustment, but your engineers still make the call, especially where a recommendation intersects with facility constraints, safety limits, or a workover already in progress. What changes is how early the signal reaches your team — instead of a monthly production report, it is a continuous view that flags a well before the next reporting cycle would have caught it.
How does the CHOPS sand management model tell the difference between healthy sand production and a developing problem?
It looks at sand cut trend alongside pump load, motor current, and production rate together rather than sand cut in isolation. A rising sand cut with stable pump performance and steady oil rate typically reflects healthy wormhole development, while a sand cut change paired with unusual pump load or a falling oil rate is a different signature that gets flagged for review. This layered approach is what lets the model distinguish a well that is producing well from one heading toward an unplanned workover.
What does implementation actually involve on our side?
Most implementations start with connecting existing production and steam data sources rather than adding new field hardware, since the majority of the signal the model needs is already being collected for regulatory and operational reporting. From there, the rollout is typically phased by pad so your team can validate the recommendations against a smaller group of wells before it runs across the full asset. The support team can walk through what your specific data sources look like and how a phased rollout would map onto your field.
Efficient Operation Is a Daily Decision, Not a Monthly Review
SAGD, CSS, and CHOPS each reward a different kind of attention — steam efficiency, cycle timing, and sand behavior respectively — and each one drifts quietly away from its efficient operating range between scheduled reviews. The published benchmarks above show what a well-run process looks like; what separates an average field from a top-quartile one is how consistently individual wells stay near that benchmark, week over week, rather than how good the best month on record was. That consistency is what continuous, well-by-well AI monitoring is built to deliver.
Ready to See This Running on Your Field's Data?
Book a 30-minute demo with an iFactory reservoir engineer. Bring production and steam data from a representative pad and leave with a concrete view of where your wells sit against these benchmarks.