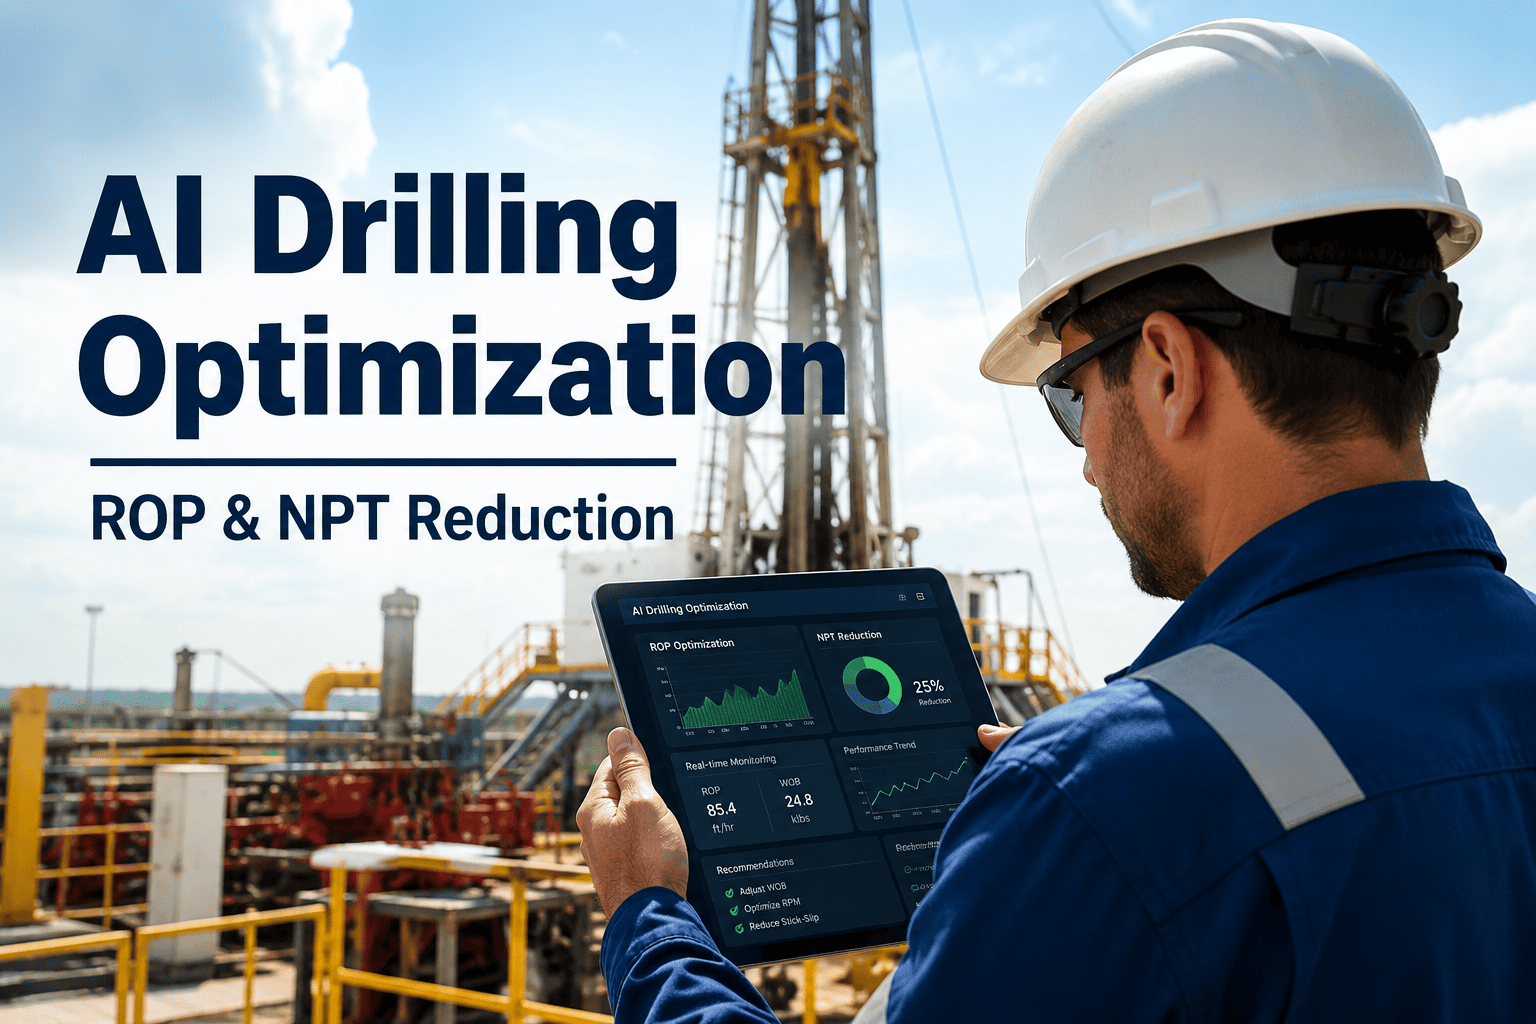
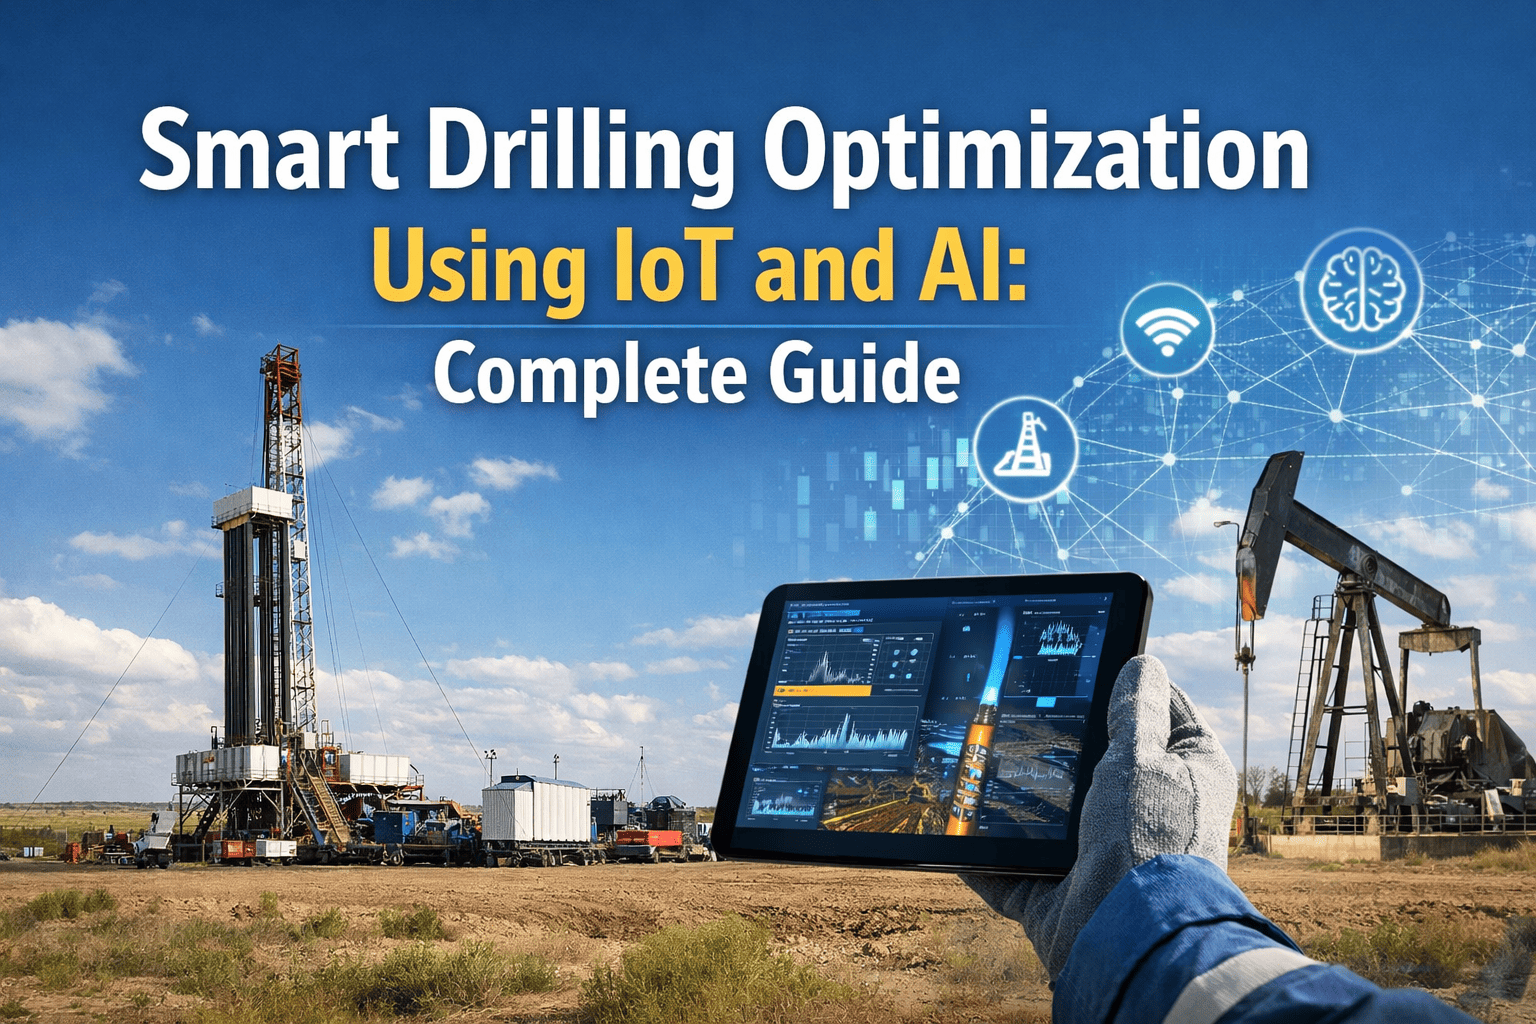
A driller nudging weight on bit up by two thousand pounds on gut feel, then backing rotary speed down when torque starts to climb, is making dozens of small decisions an hour with only surface indicators to go on — no direct view of what the bit is actually doing thousands of feet down. Static ROP models built decades ago assume formation behavior that rarely matches what the bit is drilling through right now, and every hour spent drilling below optimum penetration rate is an hour of rig time billed at full day rate for less footage than the well should be getting. AI models that fuse WOB, RPM, flow rate, torque, and formation response in real time are closing that gap, which is the exact problem iFactory's drilling optimization platform is built to solve.
DRILLING AI · ROP OPTIMIZATION · REAL-TIME PARAMETERS
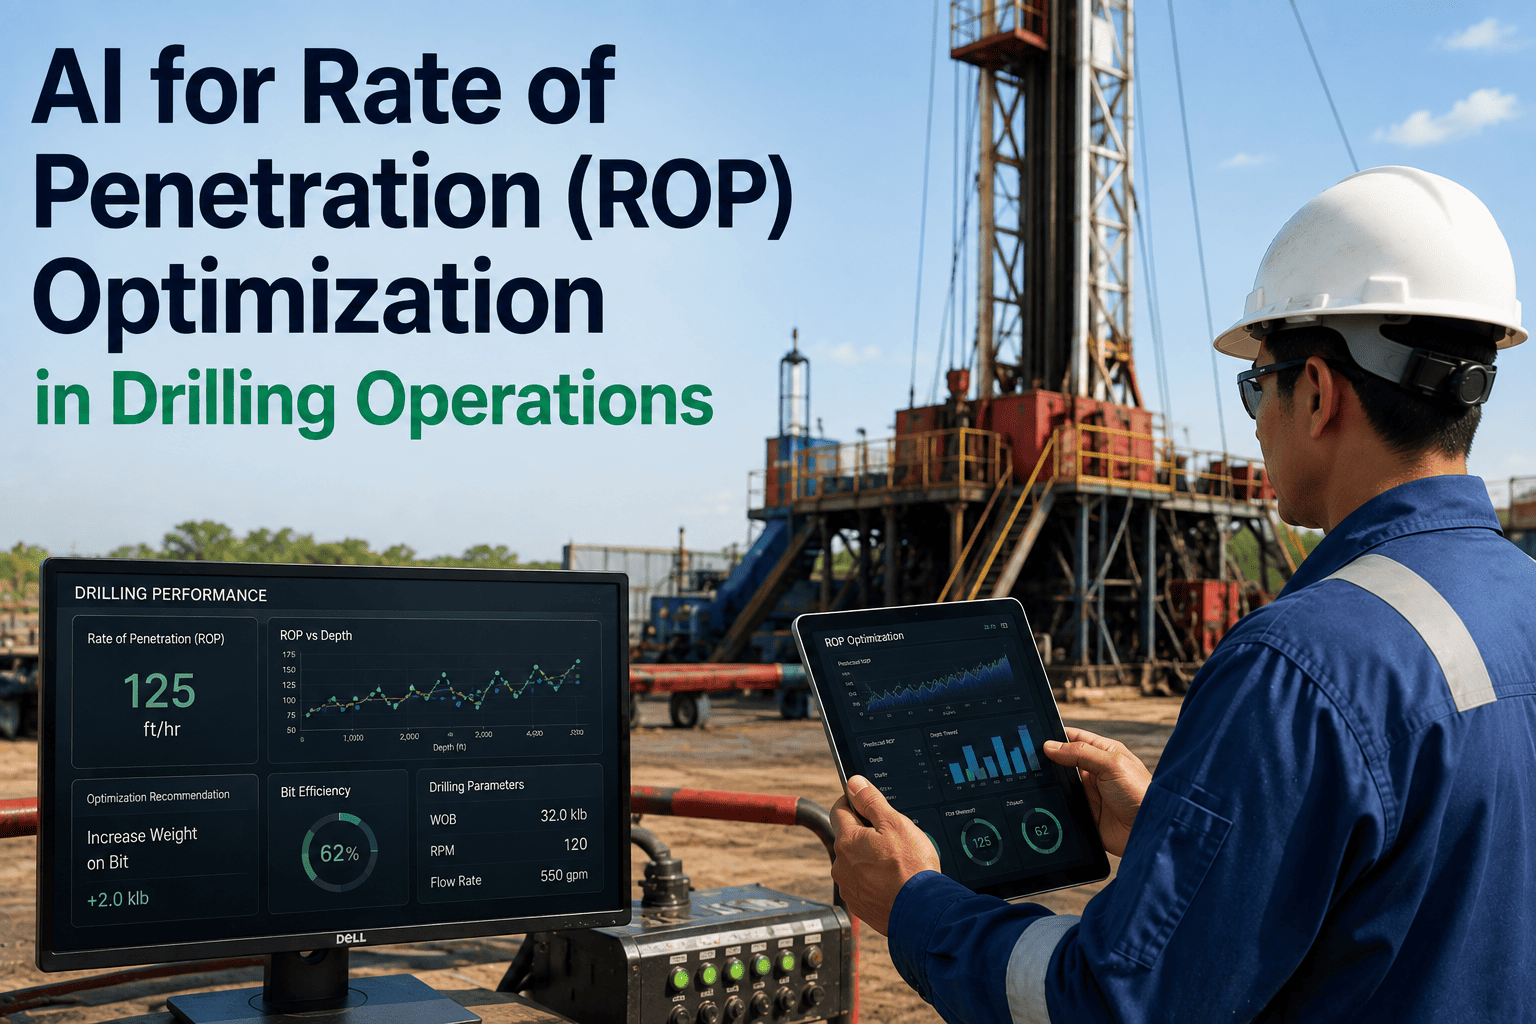
AI for Rate of Penetration (ROP) Optimization in Drilling Operations
WOB, RPM, flow rate, formation properties, and bit wear all move ROP at once. See how AI recommends real-time drilling parameters that push penetration rate up while protecting the bit and cutting non-productive time.
The Core Problem
Why ROP Is So Hard to Get Right With Surface Judgment Alone
Rate of penetration is inversely proportional to overall drilling cost, which makes it one of the highest-leverage numbers on a well plan. But ROP does not respond to any single parameter in isolation. Weight on bit, rotary speed, and flow rate all interact, and pushing one too far without adjusting the others tends to trigger downhole vibration, bit whirl, or stick-slip long before it delivers the ROP gain the driller was aiming for. A driller reading only surface torque, standpipe pressure, and hookload is inferring downhole behavior secondhand, through indicators that lag what is actually happening at the bit face by seconds or more. That lag matters more than it sounds — by the time a torque spike is visible enough on the rig floor to prompt a parameter change, the dysfunction it signals may already be a minute or more into developing.
Classical ROP models such as the Bourgoyne and Young correlation were built on deterministic assumptions about how WOB and RPM translate into penetration rate for a given formation. Those models hold up reasonably well in homogeneous, well-characterized formations, but they lose accuracy fast in unconventional or heterogeneous lithology, where formation strength can shift meaningfully within a single stand. Machine learning models trained on live drilling data — rather than a fixed correlation calibrated once — continuously recalibrate against what the bit is actually encountering, which is why they consistently outperform static empirical models in the formations where ROP optimization matters most.
There is also a coordination cost to leaving ROP optimization to individual judgment. A single well is typically drilled across multiple crew changes, and each driller brings a slightly different tolerance for how hard to push WOB before backing off. Without a shared, data-driven view of where the current formation's safe operating envelope actually sits, the well ends up drilling to whichever crew's judgment is most conservative rather than to the tightest parameters the rock and bottom hole assembly could genuinely support. That inconsistency shows up as ROP variability between shifts on the same well, in the same formation, which is a coordination gap a model closes simply by applying the same learned relationships regardless of who is on the chair.
The Numbers
What AI-Driven ROP Optimization Actually Delivers
17.4%
average ROP increase documented from reinforcement-learning agents adjusting WOB, RPM, and flow rate in real time
13.3%
reduction in Mechanical Specific Energy from AI-optimized parameter selection, reflecting more efficient rock-cutting
0.955
R-squared achieved by Random Forest ROP prediction models trained on high-resolution real-time drilling data
5 Inputs
core surface parameters — WOB, RPM, torque, standpipe pressure, and flow rate — feeding real-time ROP prediction models
The Optimization Levers
Four Variables an AI Model Balances Simultaneously
ROP is a function of four interacting variables, and pushing any one of them without accounting for the others is how bit damage and downhole vibration events happen. AI models trained on live and historical drilling data learn how these four levers move together for a specific rig, bottom hole assembly, and formation, rather than applying one generic relationship across every well on the pad.
Lever 01
Weight on Bit
Higher WOB generally increases penetration rate, but pushed too far it drives excessive depth of cut per revolution, raising torque and the risk of stick-slip. AI models learn the WOB ceiling for the current formation strength in near real time, rather than holding a single WOB target for an entire section regardless of how the rock is actually responding.
Lever 02
Rotary Speed (RPM)
RPM interacts directly with WOB to set depth of cut, and in high unconfined compressive strength zones, stabilizing RPM rather than pushing it higher is often what prevents downhole vibration from damaging the bottom hole assembly. Reinforcement learning approaches have shown the value of increasing WOB aggressively in softer zones while holding RPM steady through UCS spikes.
Lever 03
Flow Rate
Flow rate governs cuttings removal at the bit face — too little flow and cuttings reload under the bit, reducing effective ROP even as WOB stays high; too much flow can erode formation stability in sensitive sections. Balancing flow against WOB and RPM prevents the chip hold-down effect that silently caps penetration rate.
Lever 04
Formation Response and Bit Wear
The same WOB and RPM combination behaves differently against a fresh bit than a partially worn one, and differently again as lithology shifts. Models that track formation drillability and cumulative bit wear together adjust their parameter recommendations as the bit ages through the run, instead of assuming day-one bit performance for the whole interval.
These four levers rarely reach their limits independently. A bit that is wearing faster than expected effectively lowers the safe WOB ceiling even if the formation itself hasn't changed, and a formation transition can shift the RPM range where stick-slip risk starts to climb. Treating any one lever as a fixed setting for the whole run is how a well ends up either leaving ROP on the table for most of the section or drifting into a dysfunction event the driller didn't see building. A model that tracks all four together adjusts its recommendation continuously as the relationship between them shifts, rather than re-optimizing one variable at a time on a delay.
See Real-Time ROP Recommendations Running on Your Rig Data
iFactory fuses WOB, RPM, flow rate, torque, and formation response into one continuously updating model, recommending the parameter set that maximizes ROP without pushing the bit past its safe operating envelope.
How It Works
Inside a Real-Time ROP Optimization Loop
Real-time ROP optimization is a closed loop that runs continuously through a drilling section, not a one-time calculation made at the start of a run. Here is what happens inside that loop as drilling progresses.
1
Live Surface and Downhole Data Ingestion
WOB, RPM, torque, standpipe pressure, flow rate, and — where available — downhole motor RPM and differential pressure stream continuously from the rig's data acquisition system into the optimization model, typically at second-level resolution.
2
Formation Drillability Estimation
The model continuously re-estimates current formation strength and drillability from the relationship between applied parameters and the resulting ROP, updating its read on the rock instead of relying on an offset-well lithology assumption that may not hold at the current depth.
3
Vibration and Dysfunction Risk Scoring
Surface torque and RPM signatures are screened continuously for the early signs of stick-slip, bit whirl, or bit balling, and any parameter recommendation that would push the well into a high dysfunction-risk zone is constrained before it ever reaches the driller.
4
Parameter Recommendation Generation
The model outputs a recommended WOB, RPM, and flow rate combination that maximizes predicted ROP within the current dysfunction-risk and bit-wear constraints, updating that recommendation as drilling conditions change rather than issuing a single fixed target for the whole stand.
5
Driver Feedback and Continuous Retraining
Actual ROP response to each applied parameter set feeds back into the model, sharpening its formation and bit-wear estimates for the remainder of the run and for future wells drilled through comparable geology. Over enough runs, this feedback loop turns a single well's drilling data into a reusable formation model that shortens the learning curve on every subsequent well in the same field.
Approach Comparison
Static ROP Models vs. Real-Time AI Optimization
The table below reflects the documented gap between deterministic ROP correlations calibrated once at well planning and AI models that continuously recalibrate against live drilling data through the section. Because a well can spend days in the same section, even a modest per-hour ROP advantage compounds into a meaningfully shorter drilling program by the time the bit reaches total depth.
ROP Optimization Approach Comparison
Failure Modes
What Happens When Parameters Are Pushed on Judgment Alone
Most drilling dysfunction events and the non-productive time that follows them trace back to a small set of recurring failure modes, each triggered by pushing a parameter past what the current formation and bottom hole assembly can tolerate. Recognizing the pattern early, rather than after it shows up as a rig-floor incident, is the difference between a brief parameter correction and an unplanned trip.
Failure 01
Stick-Slip Torsional Vibration
Excessive WOB relative to RPM causes the bit to periodically stall and then release, cycling torque violently and accelerating fatigue damage to the drill string and bottom hole assembly. Surface torque signatures show the pattern clearly, but by the time it is visually obvious on the rig floor, damage has usually already begun.
Failure 02
Bit Whirl and Lateral Vibration
RPM pushed too high relative to formation strength and bit design can induce lateral whirl, chipping cutters and reducing bit life well before the planned run length, without necessarily showing an obvious surface warning sign in the moment.
Failure 03
Bit Balling and Chip Hold-Down
Insufficient flow rate relative to cuttings volume leaves cuttings recirculating under the bit, silently capping ROP even while WOB and RPM stay within normal ranges — a failure mode that looks like a formation problem but is actually a hydraulics problem.
Failure 04
Premature Bit Trip for NPT
When bit wear accelerates faster than planned because parameters were not adjusted as drillability changed, the result is an unplanned trip to replace the bit — hours of non-productive time that a formation-aware parameter strategy would have avoided or at least anticipated in advance.
What Changes
Where the ROP and Cost Gains Actually Come From
The improvements below compound across a well's drilling days rather than appearing as a single step change, since the model keeps sharpening its formation and bit-wear estimates the longer it runs on a given rig and geology. Operators running these systems across multiple wells in the same field typically see the model's recommendations improve further still, because each completed well adds another data set the formation-drillability estimate can draw on.
Higher Sustained ROP
Continuously re-optimized WOB, RPM, and flow rate hold penetration rate closer to the formation's true drillable maximum instead of the conservative average a driller can safely judge by feel alone.
Reduced Non-Productive Time
Predictive dysfunction screening catches stick-slip and whirl risk before it forces an unplanned trip, cutting the NPT hours that erode day rate economics on every well.
Extended Bit Life
Parameters that respect current bit wear instead of assuming day-one performance reduce the chipping and accelerated dulling that shorten runs and force early bit trips.
Lower Mechanical Specific Energy
More efficient rock-cutting behavior from AI-optimized parameter combinations reduces the energy spent per foot drilled, a leading indicator that correlates directly with lower overall drilling cost.
Before You Deploy
What a Real-Time ROP Optimization Rollout Needs
Real-time ROP optimization is only as accurate as the data feeding it and only as useful as the driller's willingness to act on its recommendations. These are the readiness items that separate a rollout that delivers measurable ROP gains from one that stalls as an unused dashboard. Working through them before spudding the first well keeps the deployment timeline predictable and avoids discovering a data gap mid-section.
Second-Level Surface Data Feed
WOB, RPM, torque, standpipe pressure, and flow rate need to stream at high resolution from the rig's data acquisition system — sparse or averaged data significantly limits how quickly the model can detect a changing formation, and second-level resolution is generally the minimum needed to catch dysfunction signatures before they escalate.
Offset Well and Bit Run History
Historical drilling data from offset wells in comparable geology gives the model a starting point on formation drillability before it has live data from the current well to learn from, which meaningfully shortens the time it takes the model to reach useful accuracy on a brand-new well.
Bit Design and Wear Baseline Data
Cutter count, bit type, and dull grading history from prior runs let the model account for how a specific bit design responds to wear, rather than applying a generic wear curve across every bottom hole assembly, which matters most in runs where the bit sees a wide range of formation strengths.
Defined Dysfunction Risk Thresholds
Torque and vibration thresholds that trigger a parameter constraint should be set jointly by the drilling engineer and the rig's directional team, not left at generic defaults that either over-constrain or under-protect the run, since the right threshold depends heavily on the specific bottom hole assembly configuration in use.
Driller Trust and Advisory Rollout
Running the model in advisory mode first, alongside the driller's own judgment, builds the confidence needed before parameter recommendations move toward closed-loop or autodriller execution, and gives the drilling engineer a clear record of how often the model's recommendation matched or beat the driller's own decision.
Rig Control System Integration Path
Confirm early whether recommendations will be delivered as a display for the driller to act on manually or integrated directly with the rig's autodriller, since the two paths have very different commissioning timelines and involve different sign-off from the rig contractor.
Frequently Asked Questions
AI for ROP Optimization — Common Questions
Does AI-driven ROP optimization replace the driller?
No. The model generates parameter recommendations based on live formation response and dysfunction risk, but the driller — or the rig's autodriller under driller supervision — remains responsible for execution and for overriding a recommendation when rig-floor conditions warrant it. Most operators run these systems in an advisory capacity initially, letting the driller compare the model's recommendation against their own read of the well before gradually extending more execution authority as trust in the recommendations builds. The goal is to give an experienced driller a continuously updated second opinion on formation behavior, not to remove their judgment from the loop.
How much ROP improvement is realistic on a typical well?
Published field and simulation results report average ROP increases in the range of 17 percent alongside meaningful reductions in mechanical specific energy, though results vary by formation heterogeneity and how conservatively the well was previously being drilled. Wells drilled through unconventional or highly variable lithology tend to show the largest gains, since that is exactly where static, deterministic ROP models lose the most accuracy relative to a model that adapts continuously. A field trial run against your own offset well data is generally the most reliable way to size the realistic gain for a specific asset before committing to a full-program rollout.
What data does the model need before it can generate accurate recommendations?
At minimum, high-resolution WOB, RPM, torque, standpipe pressure, and flow rate data, ideally supplemented with offset well drilling history and bit design and wear records for comparable formations. Teams unsure what data their current rig data acquisition system already captures can review that scope directly with
iFactory's support team before committing to a full deployment timeline.
Can this work without downhole sensors, using only surface data?
Yes. Surface parameters alone — WOB, RPM, torque, standpipe pressure, and flow rate — have been shown to predict ROP and detect emerging dysfunction with strong accuracy in published research. Downhole motor RPM and differential pressure data, where available from a motorized bottom hole assembly, further improve prediction accuracy but are not a strict requirement to get meaningful value from real-time optimization. Most rigs already capture the required surface parameters as part of standard drilling data acquisition, which is why surface-only deployments are usually the fastest path to a working pilot.
How does this reduce non-productive time specifically?
By catching the early torque and vibration signatures of stick-slip, bit whirl, and bit balling before they force an unplanned trip, and by pacing parameter changes to actual bit wear rather than a fixed schedule, the model reduces the frequency of the dysfunction-driven trips that make up a large share of drilling NPT. Fewer unplanned trips also means fewer disruptions to the drilling schedule that ripple into rig scheduling costs on subsequent wells, since a delayed well often pushes back the spud date for the next location on the same rig contract.
DRILLING AI · ROP OPTIMIZATION · NPT REDUCTION
Drill Every Section Closer to Its True Optimum
iFactory turns WOB, RPM, flow rate, and formation response into real-time parameter recommendations, so ROP gains don't depend on how conservatively a given driller reads the well.