AI for Real-Time Fracture Monitoring and Treatment Adjustment
By Johnson on August 8, 2026
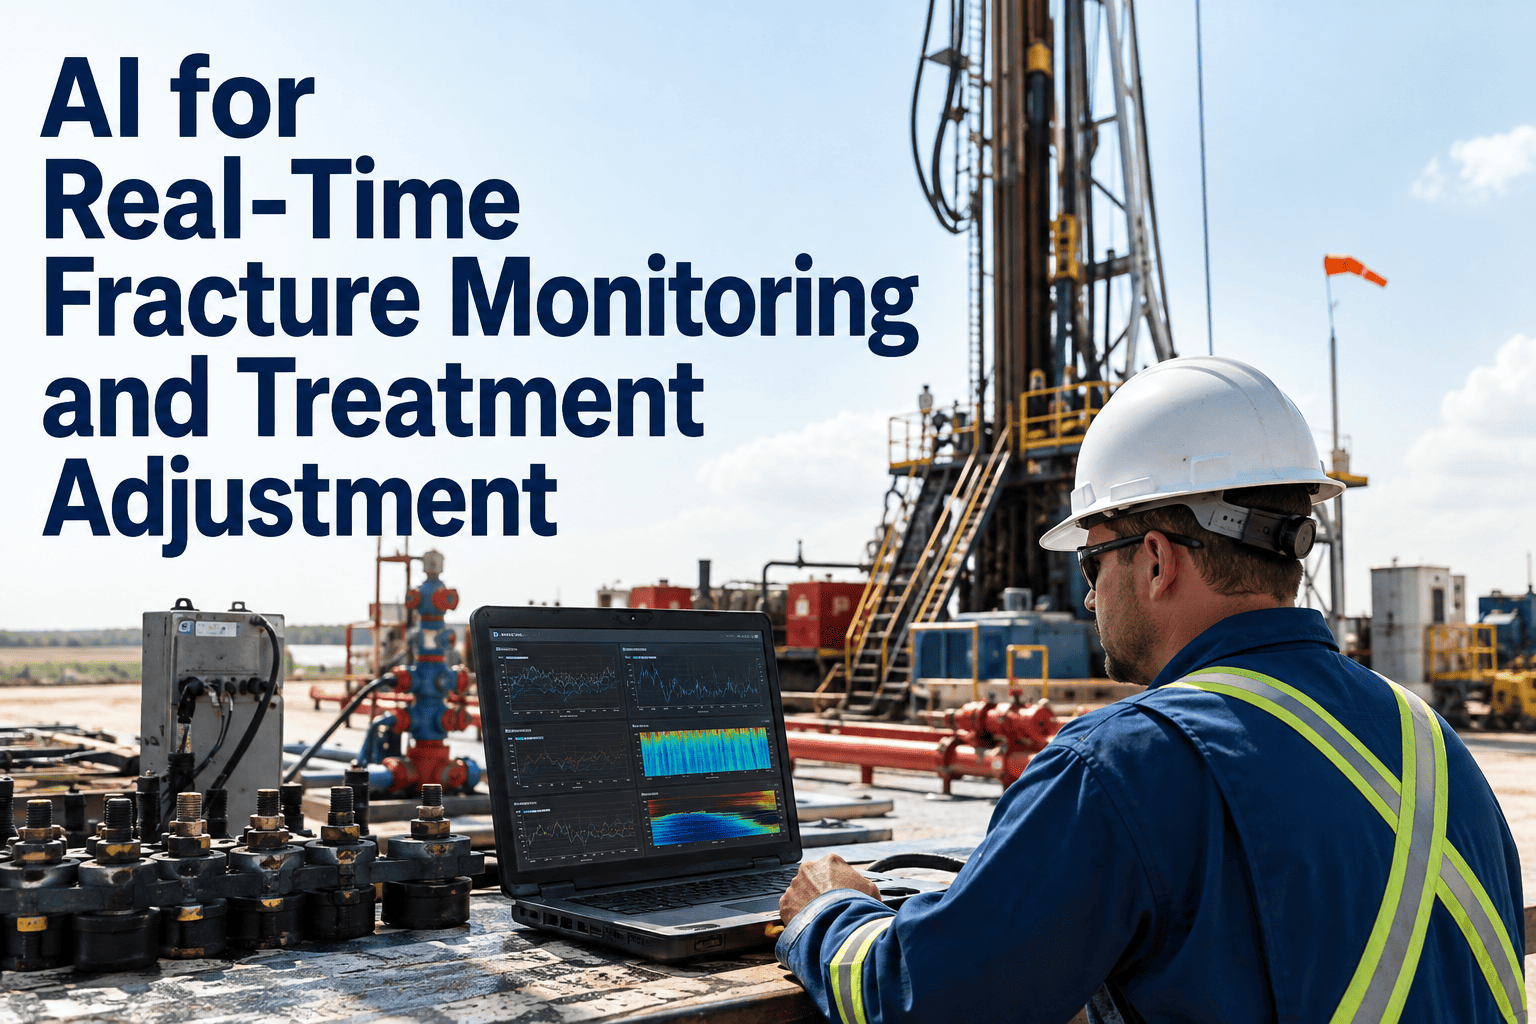
By the time a screenout shows up as a sudden treating pressure spike on the pump chart, the stage is usually already lost — the warning signs were present in the microseismic and pressure data minutes earlier, just not assembled into a clear signal fast enough for anyone at the wellsite to act on. AI-based real-time fracture monitoring processes microseismic events, surface tiltmeter data, and treating pressures continuously during the pump, catching screenout risk, frac hits, and unintended height growth while there is still time to adjust the treatment instead of only diagnosing what went wrong afterward. Here is how real-time monitoring actually catches these events, and how to book a session with our completions team to see it against your own treating data.
Completions AI · Real-Time Monitoring
AI for Real-Time Fracture Monitoring and Treatment Adjustment
Processing microseismic events, surface tiltmeter data, and treating pressures in real time during the pump — detecting screenouts, frac hits, and unintended height growth while adjustment is still possible.
The Window Between First Warning Sign and Lost Stage
What the Model Watches
Three Data Streams, Correlated Continuously During the Pump
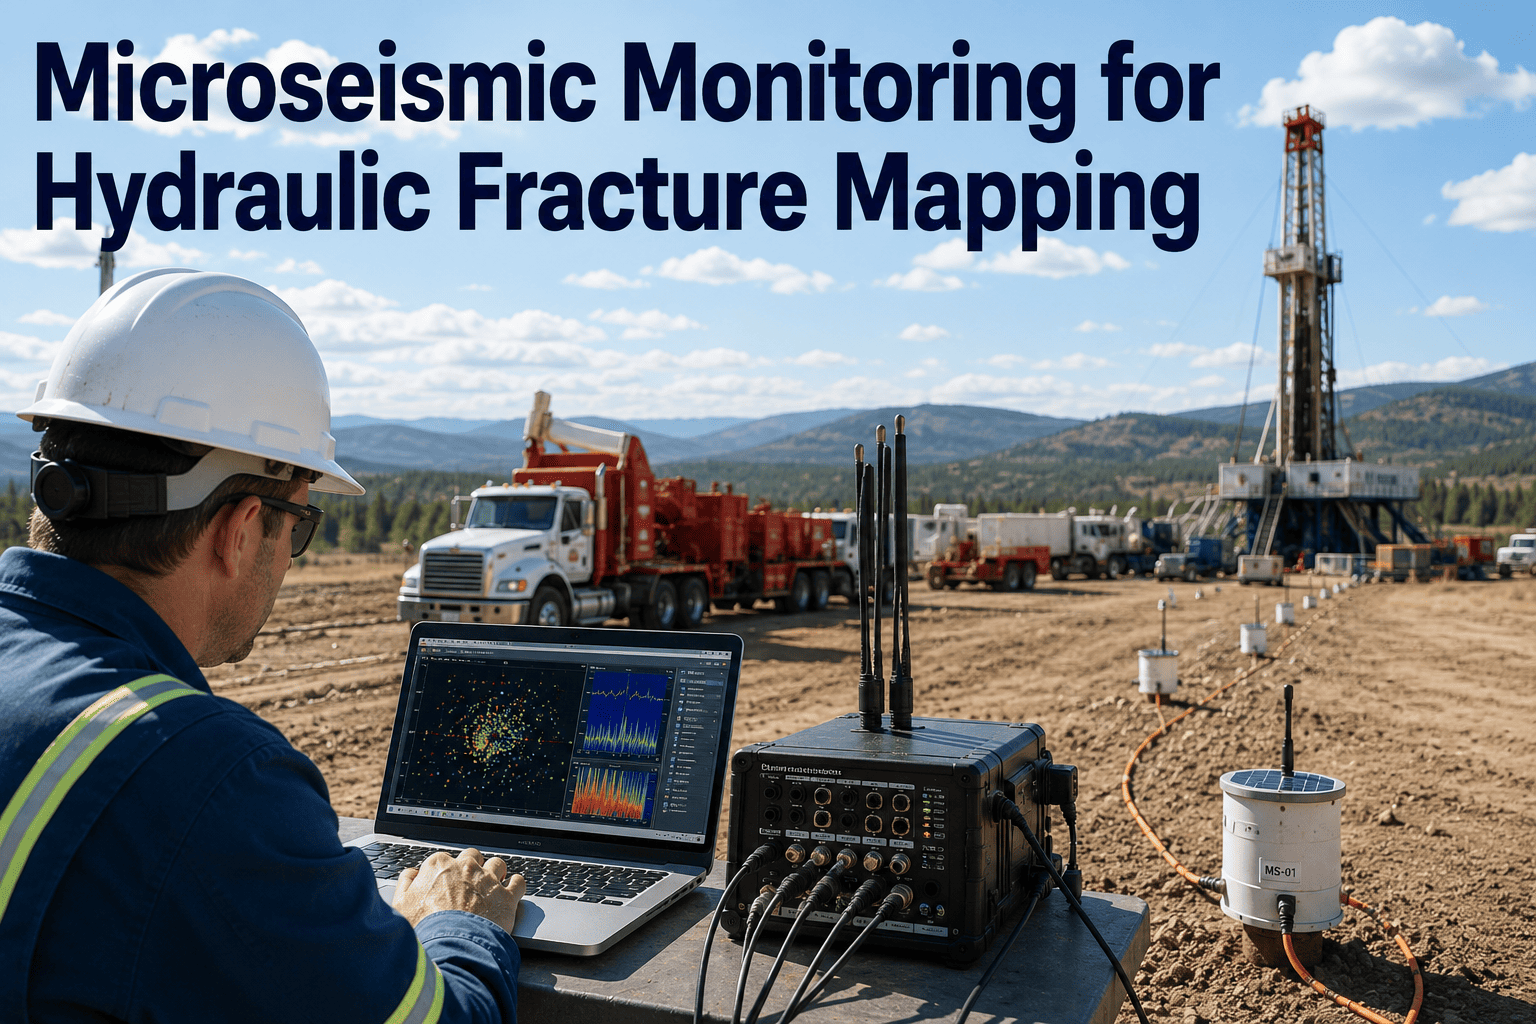
Microseismic Events
Event location, magnitude, and rate of occurrence are tracked to build a live picture of fracture geometry as it develops, rather than waiting for a post-job geometry report.
Surface Tiltmeter Data
Tilt response provides an independent check on fracture azimuth and height growth, catching height growth trends that microseismic alone may under-represent.
Treating Pressure and Rate
Pressure-rate relationships are watched continuously for the subtle trend shifts that precede a screenout, long before the sharp pressure spike that shows up on the chart after the fact.
Event Detection
Three Treatment Events and How Real-Time Monitoring Catches Each
Event
Early Signal
Recommended Response
Screenout Risk
Gradual treating pressure rise at constant rate, tightening pressure-rate correlation
Reduce proppant concentration or pump rate before near-wellbore bridging occurs
Frac Hit
Microseismic events trending toward a known offset wellbore, or unexpected pressure response on an offset well
Reduce pump rate or pause to reassess stage sequencing
Unintended Height Growth
Tiltmeter and microseismic both indicating vertical growth beyond the target interval
Adjust fluid viscosity or rate to limit further upward or downward growth
Field Readiness
What a Frac Crew Needs Before Real-Time Monitoring Adds Value
Live microseismic feed connected to the monitoring system, not just recorded for post-job analysis
Surface tiltmeter data streaming at a frequency that supports real-time correlation rather than end-of-day review
Treating pressure and rate data flowing from the frac van in real time alongside the other two streams
A defined decision protocol so a flagged risk translates into an actual rate or concentration adjustment at the van
Alert Reliability
Managing False Positives Without Dulling the Warning
A monitoring system that flags too many false alarms trains the crew to ignore it, which defeats the purpose just as thoroughly as a system that misses real risk — so alert tuning is as much a part of real-time fracture monitoring as the underlying detection itself. The model is calibrated against formation-specific and even well-specific baselines rather than a single generic threshold applied everywhere, since what counts as an unusual pressure trend in one interval can be entirely normal in another. Alert thresholds are also reviewed after each treatment against what actually happened, so a threshold that produced an unnecessary flag on one stage gets tightened before the next one, keeping the signal-to-noise ratio improving over the course of a pad rather than staying static.
See What Your Last Screenout Looked Like Earlier
Most screenouts and frac hits leave an earlier trace in the data than teams realize at the time. A monitoring session can review a past treatment against what real-time correlation would have flagged.
How a Flagged Risk Reaches the Engineer at the Van
01
Continuous Correlation
All three data streams are correlated continuously in the background throughout the stage, with no manual step required to initiate monitoring.
02
Threshold Crossing
When correlated signals cross a formation-calibrated risk threshold, an alert is generated with the specific event type and supporting data.
03
Engineer Review
The alert reaches the engineer at the van alongside the underlying data, allowing a quick assessment against the current stage plan.
04
Field Decision
The engineer decides whether to adjust rate, concentration, or sequencing — the system informs the decision but does not act on its own.
Applied Example
A Screenout Risk Caught With Time to Adjust
Consider a stage where treating pressure begins a gradual upward trend at constant pump rate roughly midway through the proppant ramp, a pattern that on its own might not yet look alarming on the pressure chart alone. Correlated against microseismic data showing event density concentrating tightly around the wellbore rather than propagating outward as expected, the combined signal crosses the model's screenout risk threshold and an alert reaches the engineer at the van with several minutes of margin before the pressure trend would have become visually obvious. The engineer reduces proppant concentration for the remainder of the ramp rather than holding the planned schedule, and the stage completes without a screenout — the kind of outcome that, without correlated real-time monitoring, would likely not have been visible until the pressure spike was already underway.
After the Stage
Why Post-Job Review Still Matters Even With Real-Time Alerts
Real-time monitoring shifts detection earlier during the pump, but it does not remove the value of a structured post-job review — every alert generated, whether it led to an adjustment or was reviewed and dismissed by the engineer at the van, becomes a data point that refines the model's threshold calibration for the next stage on that well or the next well on the pad. Stages where an alert fired but the engineer judged the risk was already receding get flagged for review too, since a pattern of over-cautious alerts on a particular formation or depth interval is just as useful a signal as a missed one would be. This continuous tightening loop is what keeps the alert system's signal-to-noise ratio improving across a multi-well pad instead of staying fixed at whatever the initial calibration produced.
Alert Outcome Logging
Every alert is tagged with what the engineer decided and what the stage outcome was, building a record for calibration review.
Threshold Recalibration
Formation and depth-specific thresholds are adjusted between wells based on which alerts proved useful and which did not.
Crew Feedback Loop
Engineer feedback on alert usefulness is captured directly rather than inferred only from stage outcome data alone.
The engineers running the frac van are excellent at reacting once something shows up clearly on the pressure chart — the problem has never been judgment, it has been how early the signal becomes visible. Microseismic and tiltmeter data both carry earlier warning than pressure alone, but only if someone is correlating all three streams continuously instead of reviewing microseismic after the stage is done. The stages where real-time correlation actually changes the outcome are usually the ones where the crew gets a rate adjustment recommendation two or three minutes before the pressure chart would have told them the same thing on its own.
Corinne Vasilenko-Marsh
Completions Monitoring Engineer · 13 years in microseismic interpretation and real-time frac treatment analysis
Monitoring Questions
Real-Time Fracture Monitoring — Frequently Asked
Do we need both microseismic and tiltmeter monitoring, or does one alone work?
Treating pressure and rate data alone already provide meaningful screenout risk detection, and adding either microseismic or tiltmeter improves height growth and frac hit detection further — the three streams together give the most complete picture, but a partial setup still adds value. Book a session to review what your current instrumentation supports.
Who at the wellsite acts on a flagged risk during the pump?
The recommendation is surfaced to the engineer at the frac van, who retains the decision on whether and how to adjust rate or concentration — the system flags the risk early, but the treatment adjustment stays a field decision. Contact support to see how the alert workflow is typically set up.
How much earlier does this actually catch a screenout compared to watching the pressure chart alone?
The exact lead time varies by formation and stage design, but correlating pressure-rate trend against microseismic activity typically surfaces a risk signal several minutes before it becomes visible as a sharp pressure spike on the chart alone. Book a demo to review lead-time examples from comparable wells.
Can this detect a frac hit into a well that isn't actively being monitored for pressure response?
Microseismic event location trending toward a known offset wellbore can flag frac hit risk even without a pressure gauge on that specific well, though having offset pressure monitoring available improves confirmation. Ask our team about frac hit detection for your specific pad layout.
Does this require a dedicated monitoring team at every stage, every well?
The correlation and flagging runs continuously without a dedicated analyst watching every stream manually, though most operators still keep an engineer reviewing flagged alerts rather than automating the treatment response entirely. Book a call to discuss staffing for your monitoring setup.
Catch the Signal Before It Becomes a Lost Stage
iFactory correlates microseismic, tiltmeter, and treating pressure data in real time during the pump — surfacing screenout, frac hit, and height growth risk while adjustment is still possible.