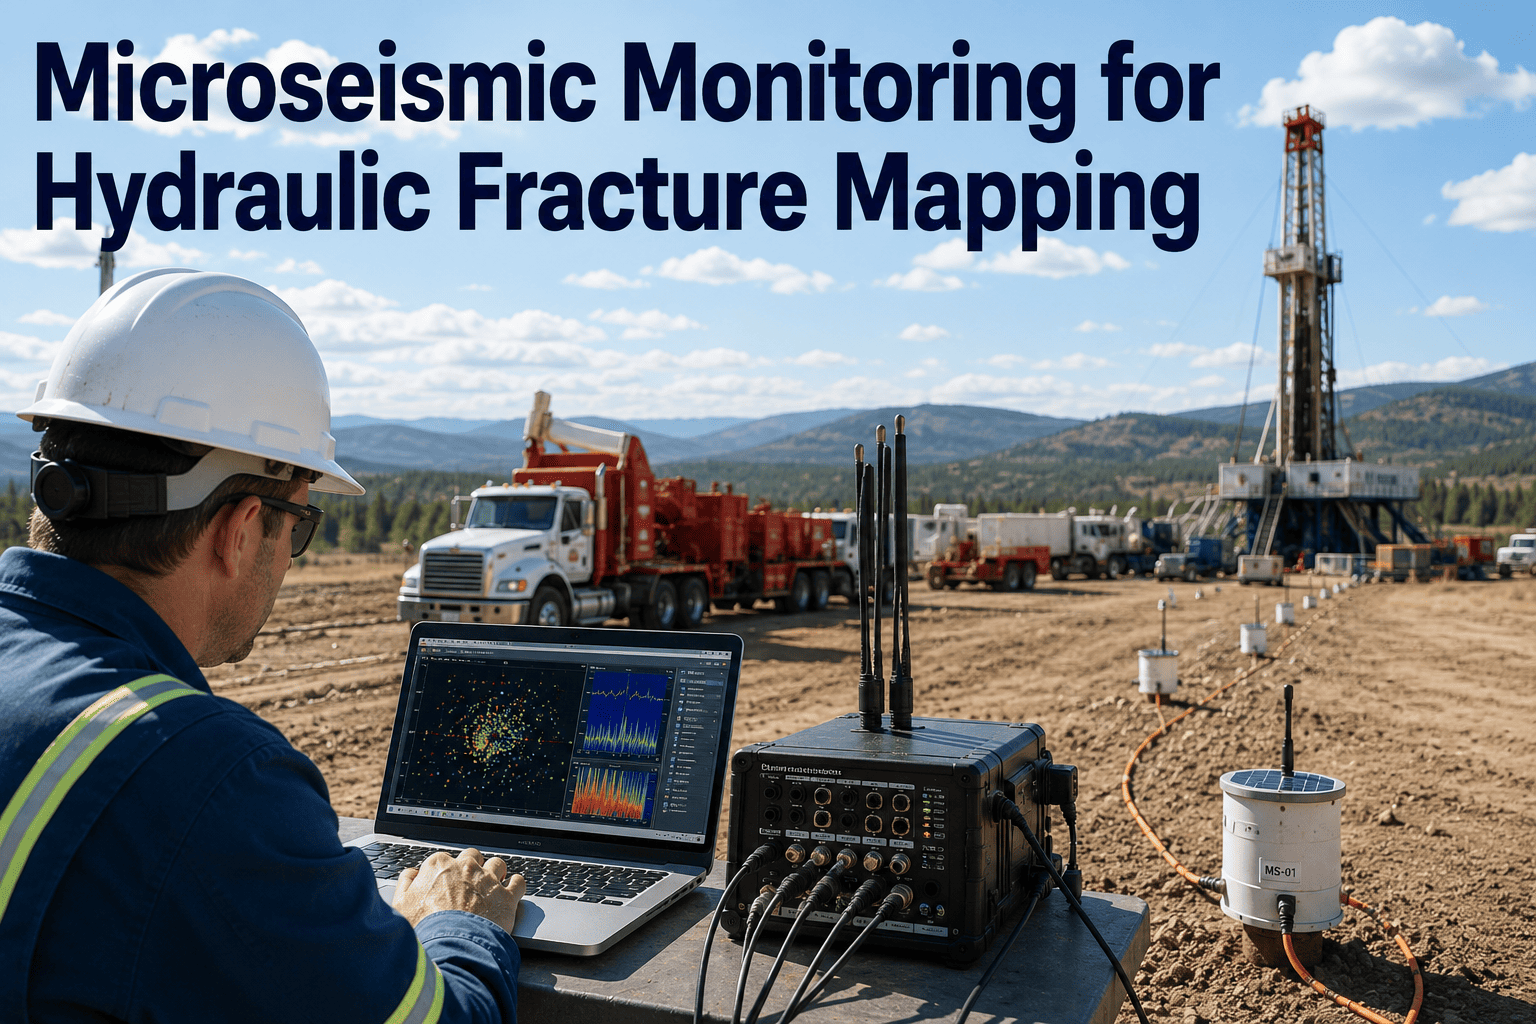
Hydraulic fracturing operations in unconventional reservoirs spend millions per well on stimulation treatments, yet most operators still rely on surface pressure data and fracture simulation models to estimate what happened thousands of feet below the surface. The actual fracture geometry, the height growth beyond the target zone, and the interaction between adjacent fracture stages remain largely invisible without downhole seismic monitoring. Microseismic monitoring places sensitive geophone arrays in nearby observation wells to detect the tiny seismic events generated when rock breaks during fracturing, converting each event into a precise location in three-dimensional space that reveals the true shape and extent of the stimulated rock volume. This article explains how microseismic monitoring maps hydraulic fractures in real time and what parameters it measures to improve completion design. You can book a demo to explore how iFactory's analytics platform processes microseismic data for your fracture mapping workflow.
OIL AND GAS · SEISMIC DATA ANALYTICS · FRACTURE MAPPING
Microseismic Monitoring for Hydraulic Fracture Mapping: See What Actually Happens Underground
Detect, locate, and interpret microseismic events in real time to build accurate three-dimensional fracture geometry models, validate stimulation designs, and prevent costly inter-well communication during multi-well pad development.
FRACTURE INTELLIGENCE
What Microseismic Events Reveal About Hydraulic Fracture Behavior That Surface Data Cannot
Surface pressure and rate data tell you what you pumped into the well. Microseismic data tells you what the rock actually did in response. The four categories below represent the critical fracture behaviors that operators can only observe through downhole seismic monitoring of induced microseismic events during stimulation.
Fracture Extent and Geometry
The spatial distribution of located microseismic events defines the three-dimensional shape of the stimulated rock volume including fracture half-length, height, and asymmetry between the two wings of the fracture from each perf cluster.
Height Growth Containment
Event depth distribution reveals whether fractures stayed within the target formation or grew into overlying or underlying zones where they could connect with water-bearing layers or cause environmental and regulatory concerns.
Fracture Complexity and Branching
Dense clusters of events with non-linear spatial patterns indicate complex fracture networks rather than simple planar fractures, which directly affects stimulated surface area and long-term production performance in unconventional reservoirs.
Stage Isolation and Overlap
Comparing event clouds between adjacent stages shows whether stages are properly isolated or whether fractures from one stage extended into the treatment zone of the next, indicating poor cement quality or inadequate plug seating.
MONITORING WORKFLOW
How Microseismic Monitoring Works: From Rock Break to 3D Fracture Map in Six Steps
The entire process from rock failure to fracture visualization happens in seconds during an active treatment, creating a continuously updating map of the growing fracture network that completion engineers monitor in real time from the frac van or remote operations center.
01
Hydraulic Fracture Initiated
High-pressure slurry injection creates tensile stress that exceeds the rock strength, initiating fractures from perforation clusters along the horizontal wellbore in the target formation.
02
Rock Failure Produces Seismic Energy
Each micro-fracture event releases elastic strain energy as compressional P-waves and shear S-waves that propagate outward through the surrounding rock at known seismic velocities determined by the local geology.
03
Downhole Geophones Detect Wave Arrivals
A string of multicomponent geophones cemented or temporarily deployed in a nearby observation well records the arriving seismic waveforms with precise timing stamps synchronized to a common clock.
04
P-Wave and S-Wave Arrivals Picked
Automated picking algorithms identify the first-arrival times of compressional and shear waves on each geophone channel, with quality control flags for low signal-to-noise or ambiguous picks.
05
Event Location Triangulated in 3D
Using the arrival time differences between geophones and a calibrated velocity model, the processing system triangulates the exact x, y, z position of each microseismic event source in the subsurface coordinate system.
06
Fracture Geometry Mapped in Real Time
As events accumulate during the stage, the growing point cloud reveals fracture geometry on the monitoring dashboard, enabling operators to make immediate decisions about rate adjustments or stage termination.
Stop Guessing Fracture Geometry From Surface Pressure Data Alone
iFactory's analytics platform processes microseismic event streams into real-time fracture maps that show exactly where your fractures are growing, how tall they are, and whether they are staying in zone. Book a demo to see fracture mapping on your treatment data.
GEOMETRY PARAMETERS
Fracture Parameters That Microseismic Data Quantifies With Measured Confidence
Each fracture geometry parameter below is derived directly from the spatial and temporal distribution of located microseismic events. The confidence levels reflect the typical measurement precision achieved with downhole monitoring arrays in common unconventional reservoir settings.
Measured from the wellbore to the furthest detected event in each direction, providing the total fracture wingspan and asymmetry ratio between fracture wings.
Vertical extent of the event cloud from the shallowest to the deepest detected event, indicating whether the fracture stayed within the target pay zone.
Dominant orientation of the event cloud in the horizontal plane, which should align with the maximum horizontal stress direction predicted by the geomechanical model.
Convex hull volume enclosing the event cloud, used as the primary input for production forecasting models and completion efficiency comparisons between stages.
Distance that events extend above or below the target formation boundary, critical for assessing environmental risk and adjusting treatment design to improve height containment.
Measured distance between the event clouds of adjacent stages, identifying where stage spacing may be too tight and where gaps in stimulation coverage exist between stages.
FRAC HIT DETECTION
Identifying Inter-Well Fracture Communication Before It Impacts Production
When a hydraulic fracture from a child well grows into the fracture network of a parent well, the pressure communication can damage parent well production, cause proppant flowback, and create sustained fluid channeling between wells. Microseismic monitoring detects these frac hits in real time by identifying events that occur near the offset wellbore during treatment of the new well.
No Communication Detected
HEAD TO HEAD
Fracture Simulation Models vs Microseismic Monitoring: Full Capability Comparison
The table below compares predicted fracture models against measured microseismic data across the operational dimensions that determine which approach provides actionable information for completion optimization.
MEASURED OUTCOMES
Results From Microseismic Monitoring Programs in Unconventional Reservoirs
These figures reflect measured outcomes from operators who deployed microseismic monitoring on multi-well pads in shale and tight reservoirs, with each result tracked over a minimum of six completed wells per program to ensure statistical validity.
340%
Improvement
Fracture Model Accuracy After Microseismic Calibration
Operators who used microseismic event clouds to calibrate their fracture simulation models achieved a three-fold improvement in predicted versus measured fracture geometry on subsequent wells, reducing design uncertainty dramatically.
47%
Reduction
Frac Hits Through Real-Time Monitoring and Adaptive Pacing
Real-time microseismic monitoring enabled operators to detect frac hits within seconds and adjust pump rates or pause treatment, reducing the severity and frequency of inter-well communication events on child well completions.
$2.3M
Savings Per Pad
From Optimized Stage Spacing Based on Measured Half-Lengths
By measuring actual fracture half-lengths instead of assuming them, operators adjusted stage spacing to eliminate overlap and gaps, reducing the number of stages required per well while maintaining or improving stimulation coverage.
89%
Containment Rate
Stages With Fracture Height Within Target Zone Boundaries
Microseismic data revealed which treatment designs kept fractures in zone and which allowed height growth, enabling operators to refine pump schedules and fluid systems to achieve consistent height containment across the pad.
Your Fractures Are Already Breaking Rock — The Seismic Data Is There to Map Them
iFactory's analytics platform turns the microseismic signals that your fractures generate into structured fracture geometry data in real time, giving your completion engineers the visibility they need to optimize every stage. Book a demo to see microseismic fracture mapping on your field data.
FREQUENTLY ASKED QUESTIONS
Questions From Completion Engineers About Microseismic Fracture Mapping
How accurate is microseismic event location, and what factors affect location precision?
Microseismic event location accuracy typically ranges from 10 to 50 feet depending on the geometry of the monitoring array, the distance from the event to the receivers, the velocity model quality, and the signal-to-noise ratio of the recorded waveforms. Surface arrays generally provide lower accuracy than downhole arrays because the signal travels through more complex near-surface geology that distorts the wavefield. Downhole arrays positioned in a nearby observation well achieve the highest accuracy because the geophones are close to the events and the velocity structure between receivers and the fracture zone is relatively well understood. iFactory's platform applies advanced velocity model calibration and arrival-time picking algorithms to maximize location precision for your specific monitoring configuration.
Book a demo to see location accuracy on your field data.
Can microseismic monitoring be performed without a dedicated observation well using surface arrays?
Surface microseismic monitoring uses large arrays of geophones deployed on the surface above the treatment area, eliminating the need for a dedicated observation well and reducing mobilization costs significantly. However, surface monitoring provides lower location accuracy and reduced detection sensitivity compared to downhole arrays because the seismic signals attenuate considerably as they travel upward through thousands of feet of overburden rock. Surface arrays are most effective in areas with simple near-surface geology and relatively shallow treatment depths where signal attenuation is manageable. For deep unconventional reservoirs where high-precision fracture geometry data is critical for completion optimization, downhole monitoring remains the preferred approach for most operators.
Contact our support team to discuss which monitoring configuration suits your well pad layout and budget.
How quickly are microseismic events located and displayed during an active frac stage?
iFactory's microseismic processing pipeline locates events within seconds of detection, enabling real-time fracture geometry updates that display on the monitoring dashboard as the treatment progresses. The system automatically picks P-wave and S-wave arrivals, computes preliminary locations using a fast grid-search algorithm, and then refines those locations using a more precise optimization method to improve accuracy. During a typical frac stage lasting two to three hours, operators can watch the fracture cloud grow in real time and make immediate decisions about pump rate adjustments, stage termination, or diversion if the fracture geometry deviates significantly from the design plan. This real-time capability is what transforms microseismic monitoring from a post-treatment analysis tool into an active completion optimization tool.
Book a demo to see real-time event processing on live treatment data.
What is the difference between microseismic monitoring and tiltmeter-based fracture mapping?
Tiltmeter-based fracture mapping measures the tiny surface or downhole deformation caused by fracture opening, using the tilt pattern to estimate fracture orientation and approximate dimensions from the measured displacement field. Tiltmeters provide reliable azimuth and dip estimates but cannot resolve fracture length, height, or complexity with the spatial detail that microseismic event locations deliver. Microseismic monitoring detects individual rock failure events along the fracture, producing a point cloud that reveals fracture geometry, branching, complexity, and height growth at much higher spatial resolution than any deformation-based method. Tiltmeters cost less to deploy and work without an observation well, making them suitable for orientation-only applications where detailed geometry is not required for completion decisions.
Contact our support team to discuss which fracture mapping method fits your technical objectives and budget constraints.
How does microseismic data integrate with existing completion and reservoir simulation models?
Microseismic event locations provide direct measurements of where the fracture actually grew, which serves as validation data for the fracture simulation models that engineers use to design completions and predict production. Operators import the event location cloud into their reservoir modeling software to calibrate the stress model, adjust fracture conductivity assumptions, and refine the stimulated rock volume estimate used in production forecasting and economic analysis. The event cloud also reveals whether fractures grew out of zone, whether adjacent stages overlapped or left gaps, and whether the fracture azimuth matched the predicted maximum horizontal stress direction from the geomechanical model. iFactory's platform exports event data in standard formats compatible with major reservoir simulation and geological modeling tools, and the analytics dashboard provides summary statistics that completion engineers use to adjust stage spacing and pump schedules.
Book a demo to see how microseismic data flows into your existing modeling workflow.
Every Fracture Stage Generates Seismic Data Worth Analyzing
iFactory's platform captures, processes, and visualizes microseismic event data in real time, turning invisible underground fracture growth into actionable geometry maps that improve your completion design well after well. Book a demo to start mapping your fractures with actual data instead of model assumptions.