A flare stack burning at the edge of a refinery looks the same whether the reported flow rate is accurate or off by forty percent, and that gap is exactly the problem regulators and plant managers are trying to close. Most flare gas volumes reported today still come from engineering estimates built on assumed gas composition, orifice calculations, and periodic spot checks rather than continuous measurement, and the resulting numbers can diverge sharply from what actually left the stack. Every unmeasured pound of hydrocarbon is a compliance exposure, a lost product value, and a blind spot in the emissions inventory a facility reports to the EPA. iFactory brings continuous, AI-corrected flare flow measurement into that blind spot, and the underlying methodology is explained at iFactory support.
Flare Intelligence
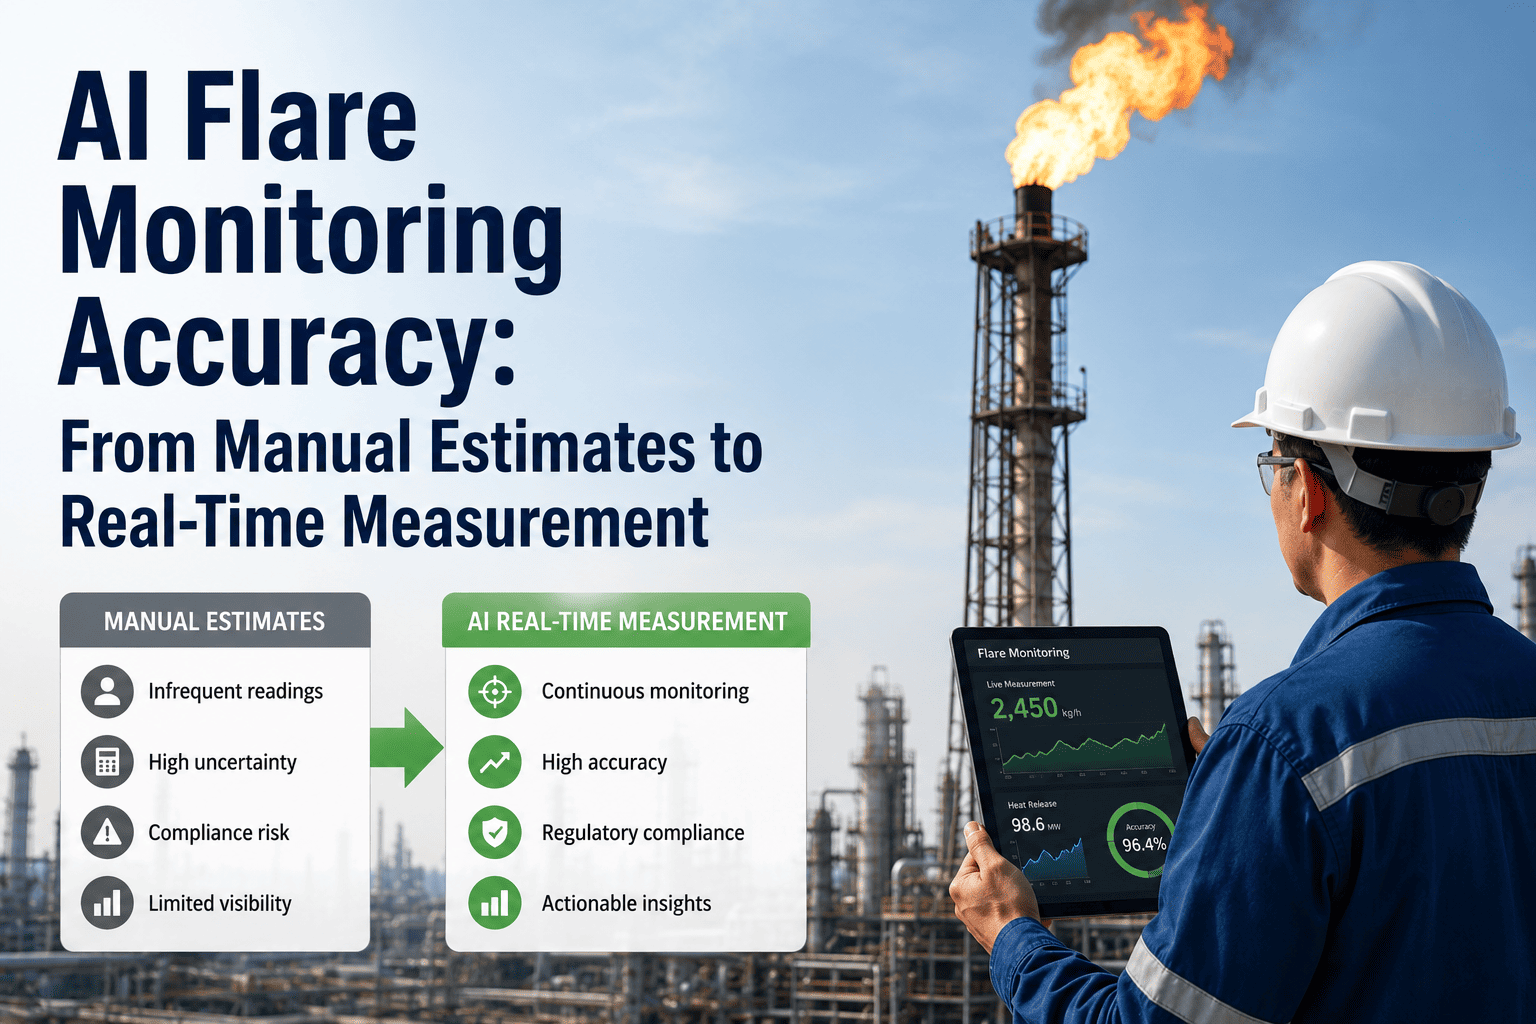
AI Flare Monitoring Accuracy: From Manual Estimates to Real-Time Measurement
Manual flare flow estimation routinely deviates 30 to 50 percent from actual flow. Continuous ultrasonic and thermal measurement, corrected in real time by AI against live gas composition, closes that gap to single-digit accuracy.
30-50%
Typical deviation between engineering-estimate flare volumes and continuously measured volumes
±5%
Accuracy regulators commonly require of flare flow meters across the full measuring range
1000:1
Turndown ratio a flare meter must hold accuracy across, from pilot-level flow to emergency blowdown
Seconds
Time an AI-corrected system takes to re-align accuracy after a gas composition shift, versus days for manual recalibration
Why Manual Estimates Fail
The Physics That Defeats a Static Flow Calculation
Flare gas is one of the hardest streams in a plant to measure accurately, and the reasons are physical, not procedural. A static estimate built once during design review cannot track any of the following as they shift hour to hour on a live flare header.
01
Composition Drift
Flare gas composition changes as different units contribute to the header, and a flow meter calibrated to one gas mixture can lose ten percent accuracy or more when the mixture shifts without a matching recalibration.
02
Extreme Turndown
A flare sits near-idle under normal operation and spikes to emergency blowdown flow during an upset, and most flow technologies lose accuracy at one end of that range or the other.
03
Low-Flow Blind Spots
The average flare spends most of its operating life at the low end of its flow range, which is precisely where legacy meter technologies and manual estimation methods are least reliable.
04
Installation Geometry
Bends, tees, and short straight-run piping ahead of a meter distort the flow profile, and a meter installed without accounting for that geometry carries a built-in bias no calibration certificate will catch.
05
Wind and Weather
Crosswind at the flare tip affects combustion efficiency and visible plume behavior in ways a stack-base flow number alone cannot capture, leaving a gap between what was measured and what was actually destroyed.
06
Infrequent Recalibration
A manual estimate or a meter left on a stale calibration curve accumulates error silently for months until an audit, a regulatory inspection, or a mass balance discrepancy forces a correction.
Measurement Technology Comparison
How the Leading Flare Measurement Approaches Actually Compare
No single technology is correct for every flare header, and the right choice depends on flow range, gas composition variability, and existing infrastructure. The table below lays out how manual estimation stacks up against the instrumented approaches an AI monitoring layer can draw on.
Method
Typical Accuracy
Low-Flow Performance
Composition Sensitivity
Engineering Estimate
30-50% deviation from actual
Not measured, assumed
Not tracked, uses design-basis assumption
Orifice / DP Meter
10-15% at low turndown
Poor below 10:1 turndown
Requires manual recalculation
Ultrasonic Flow Meter
2-3% across wide range
Good, degrades at very low velocity
Algorithm-corrected in real time
Thermal Mass Meter
Below 1% of reading
Strong down to ultra-low velocities
Multiple stored calibration curves
AI-Corrected Mass Balance
95%+ agreement with reference method
Cross-validated against upstream sources
Continuously reconciled with gas chromatograph data
Every Emissions Report Depends on a Number That Was Never Actually Measured. That Is the Exposure an Auditor Finds First.
iFactory layers AI correction over ultrasonic and thermal flow data, reconciles it against live gas composition, and gives your emissions team a defensible, continuously logged flare volume.
The AI Correction Layer
What Actually Happens Between the Sensor and the Reported Number
1
Continuous Field Signal
Ultrasonic transit-time and thermal mass sensors stream raw flow, velocity, and temperature data from the flare header continuously rather than at scheduled intervals.
2
Live Composition Matching
Gas chromatograph readings or inferred composition models are matched against the flow signal in real time, so a shift in molecular weight is reflected in the flow calculation within seconds instead of waiting for a manual recalibration cycle.
3
Mass Balance Cross-Check
The corrected flow reading is reconciled against upstream relief valve activity, header pressure, and known contributing streams, flagging any reading that falls outside a physically plausible range.
4
Thermal Imaging Validation
Infrared and thermal camera data on flame characteristics provide an independent visual check against the instrumented flow reading, catching sensor drift or fouling before it corrupts the reported volume.
5
Auditable Output
Every reported volume carries a timestamped chain of the sensor readings, composition data, and cross-checks that produced it, ready for regulatory submission or third-party audit.
Field Example
A Gulf Coast Refinery Closing a Reported Emissions Gap Without Adding New Flow Meters
A refinery's environmental team had been carrying a persistent discrepancy between its flare header's reported hydrocarbon volume and the mass balance implied by upstream relief valve activity, a gap that widened during turnarounds when multiple units vented into the same header simultaneously. The existing ultrasonic meters were within their calibration window, but the gas composition assumption feeding the flow calculation had not been updated since original commissioning, even as the unit slate feeding the flare had changed twice in the interim.
iFactory connected the existing meter data stream to a live gas chromatograph feed and an AI correction layer that recalculated the flow-to-volume conversion continuously rather than on the site's prior quarterly review cycle. The reconciliation immediately surfaced that roughly eighteen percent of reported flare volume during high-throughput periods had been undercounted due to the stale composition assumption. Within one reporting quarter the site's emissions inventory shifted to reflect the corrected figure, closing the mass balance gap the environmental team had been unable to explain for three prior audit cycles, and the corrected data pipeline has since flagged two sensor drift events before they affected a compliance report.
18%
Previously undercounted flare volume identified
1 quarter
Time to corrected emissions inventory
2 events
Sensor drift issues flagged before affecting a report
Regulatory Reporting Landscape
The Rules That Make Accurate Flare Measurement Non-Negotiable
Flare measurement accuracy is not just an engineering preference, it is written directly into the regulations a facility has to comply with, and the specific rule that applies depends on location, facility type, and production volume.
A
30 CFR Part 250
Applies to offshore facilities producing over 2,000 barrels of oil per day, requiring daily reported volumes of gas flared, gas vented, and liquid hydrocarbons burned.
B
40 CFR Part 98 Subpart W
The EPA's Greenhouse Gas Reporting Program requirement for petroleum and natural gas systems, which sets specific methodology requirements for calculating and reporting flare emissions.
C
40 CFR Part 60 Subpart OOOO
Commonly referred to as Quad O, this New Source Performance Standard sets monitoring and reporting obligations aimed at reducing methane and volatile organic compound emissions from oil and gas operations.
D
Refinery Sector Rule 40 CFR 63
Requires refineries to measure and report flare gas flow at rates as low as 0.1 standard feet per second, a threshold most legacy metering approaches were never designed to hit reliably.
E
State and Regional Overlays
Many states and air quality districts layer additional flare monitoring and reporting requirements on top of the federal baseline, often with tighter accuracy or reporting-frequency expectations.
F
Meter Uncertainty Thresholds
Regulators commonly require meter uncertainty below 7.5 percent and increasingly expect 5 percent or better, a bar that is difficult to hit consistently without continuous composition correction.
Self-Assessment
Signs a Flare Measurement Program Needs an Upgrade
1
Composition Assumption Older Than the Unit Slate
If the gas composition used in the flow calculation predates the most recent change to which units feed the flare header, the reported volume is very likely already drifting from actual.
2
Mass Balance Discrepancies That Reappear Every Audit
A recurring, unexplained gap between reported flare volume and the mass balance implied by upstream relief activity is a strong signal that the measurement, not the process, is the source of the error.
3
Recalibration on a Calendar, Not a Trigger
Meters recalibrated only on a fixed quarterly or annual schedule, rather than in response to a known composition or unit-slate change, spend long stretches operating on assumptions that no longer hold.
4
No Independent Cross-Check on Reported Volume
A single flow reading with no thermal imaging, mass balance, or upstream relief-activity cross-validation has no way to flag sensor drift or fouling before it corrupts a compliance report.
5
Reporting Prepared Manually Under Deadline Pressure
If emissions reporting still involves manually pulling and reconciling data from multiple systems shortly before a filing deadline, the process is more exposed to both error and missed anomalies than a continuously logged pipeline would be.
Frequently Asked Questions
What Plant Environmental and Instrumentation Teams Ask First
Does moving to AI-corrected measurement mean replacing our existing flow meters?
In most cases no, the existing ultrasonic or thermal meters remain the physical measurement device, and the AI correction layer sits on top of that data stream to continuously reconcile it against gas composition and mass balance checks. Facilities that are still relying on engineering estimates without any installed meter do need a physical instrument added, but for sites with meters already in place, the improvement comes primarily from continuous composition correction rather than new hardware. Details on integrating with existing instrumentation are available through
iFactory support.
How quickly does the system respond when flare gas composition changes?
A properly configured AI correction layer re-aligns the flow-to-volume calculation within seconds of receiving an updated composition reading from the gas chromatograph or inferred composition model, which is a dramatic improvement over the manual recalibration cycles many sites still run on a monthly or quarterly basis. This matters most during turnarounds and upset conditions, when composition can shift multiple times within a single shift as different units contribute to the flare header.
What accuracy level should we realistically expect to achieve?
Facilities moving from engineering estimates to a fully instrumented, AI-corrected measurement system typically see reported accuracy improve from a 30 to 50 percent deviation range down to single-digit agreement with reference methods, often in the 95 percent or better range depending on the underlying meter technology and installation geometry. The exact figure depends heavily on flow range, gas composition variability, and how well the meter installation follows recommended straight-run and geometry guidelines, so a site-specific assessment is the most reliable way to set expectations.
Can this data be used directly for regulatory emissions reporting?
Yes, the system is built to produce a timestamped, auditable record of the sensor readings, composition inputs, and cross-checks behind every reported volume, which is exactly the chain of evidence regulators and third-party auditors look for during a compliance review. Many sites use the continuous data stream to replace what was previously a manual, periodic reporting process, reducing both the labor involved and the risk of an unsupported number appearing in a submitted report. To review reporting format compatibility with your specific regulatory jurisdiction,
book a demo.
How long does implementation typically take at an operating facility?
For a site with existing flow instrumentation, connecting the data stream and standing up the AI correction and mass balance reconciliation layer is typically a matter of weeks rather than months, since no process shutdown or new field instrumentation installation is required. Sites that need new flow meters installed on an uninstrumented flare header should expect the timeline to extend based on the scope of the instrumentation project itself, though the AI correction and reporting layer can be configured in parallel with that installation work.
Stop Reporting a Flare Volume Nobody Actually Measured.
Continuous, AI-corrected flare flow measurement that reconciles against live gas composition and gives your emissions team a defensible number, every time.