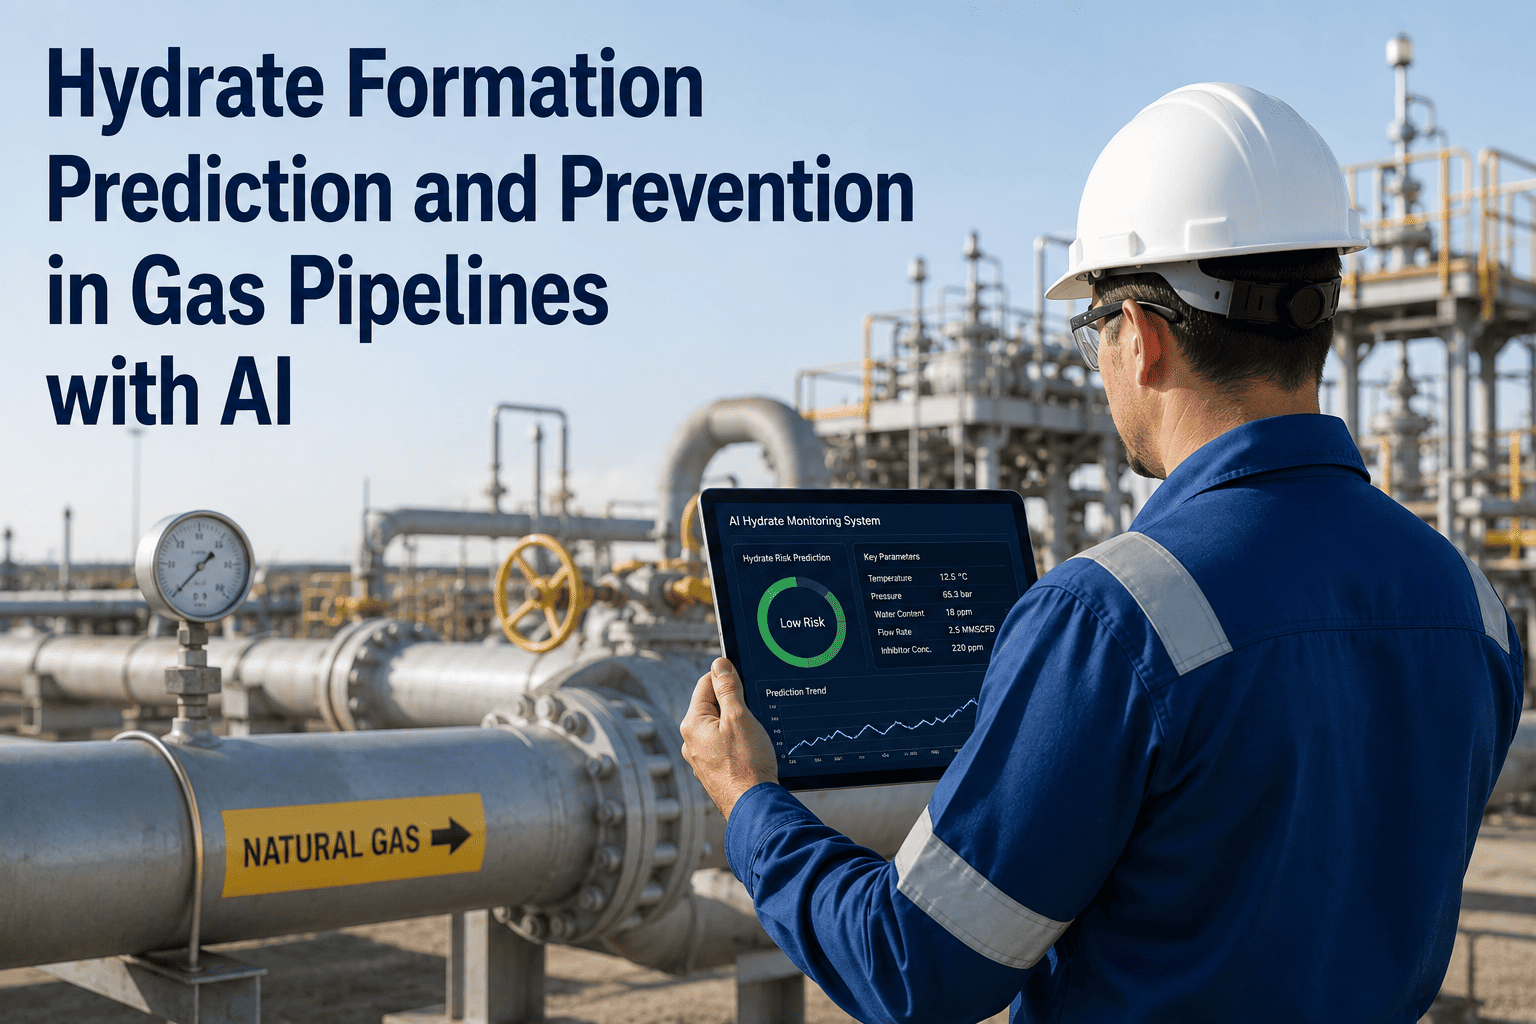
Hydrate plugs are among the most operationally damaging events in wet gas pipeline systems. When natural gas combines with water under elevated pressure and low temperature, it forms ice-like crystalline structures — gas hydrates — that can block a pipeline completely within hours, shutting in production for days or weeks while remediation crews work to safely dissociate the plug. The financial exposure from a single hydrate event in a deepwater or cold-environment pipeline runs from hundreds of thousands to several million dollars in deferred production, intervention costs, and restart procedures. For U.S. gas processors, midstream operators, and offshore production engineers, hydrate prevention is not a theoretical concern. It is a daily operational discipline that requires real-time chemical injection management, thermodynamic monitoring, and process data integration to execute reliably.
Monoethylene glycol (MEG) and methanol are the two primary thermodynamic hydrate inhibitors deployed in commercial gas pipeline operations, each with distinct performance profiles, recovery economics, and injection system requirements. Choosing between them — or managing both — requires accurate hydrate formation curve calculation, continuous process condition monitoring, and injection rate optimization that accounts for fluctuating flow rates, temperatures, and water production. This guide covers the thermodynamic basis of hydrate formation in wet gas pipelines, the operational differences between MEG and methanol injection systems, injection rate calculation methodology, and how Book a Demo with iFactory's process analytics platform demonstrates real-time hydrate risk monitoring for pipeline operations teams.
How Gas Hydrates Form: Thermodynamic Conditions in Wet Gas Pipelines
Gas hydrates form when light hydrocarbon molecules — primarily methane, ethane, and propane — become encaged in hydrogen-bonded water lattice structures at the intersection of sufficient pressure and low enough temperature. The hydrate stability zone is defined by the hydrate formation curve (also called the hydrate equilibrium curve), which maps the pressure-temperature boundary above and to the left of which hydrates are thermodynamically stable in the presence of free water.
In practical pipeline terms, any point in the system where operating conditions cross to the left of the hydrate formation curve — and free water is present — is a hydrate nucleation risk. This commonly occurs in subsea flowlines where seawater temperatures approach 2–4°C at operating pressures of 100–300 bar, in onshore pipelines crossing mountain passes or arctic terrain, and at gas processing facilities where Joule-Thomson cooling at pressure letdown points creates localized temperature drops. The hydrate formation temperature for a typical 0.65 specific gravity natural gas at 100 bar is approximately 20–22°C, meaning a pipeline operating at those conditions needs either temperature control, dehydration, or inhibitor injection to prevent plug formation.
MEG vs. Methanol: Inhibitor Selection for Pipeline Hydrate Prevention
Both MEG and methanol prevent hydrate formation by depressing the hydrate formation temperature — shifting the equilibrium curve to lower temperatures so that operating conditions remain outside the hydrate stability zone. Their mechanisms are the same; their operational profiles are significantly different, and the economics of each depend heavily on the pipeline system characteristics.
| Comparison Factor | MEG (Monoethylene Glycol) | Methanol |
|---|---|---|
| Inhibitor Concentration Required | 20–50 wt% in aqueous phase for typical deepwater conditions | 20–40 wt% in aqueous phase; higher volatility means vapor-phase losses |
| Recovery & Regeneration | Recoverable via MEG regeneration unit (MRU); closed-loop systems economically justified for high water rates | Not typically recovered; single-pass injection with disposal in produced water stream |
| Vapor Loss | Negligible vapor pressure; losses confined to liquid phase carryover | Significant vapor-phase losses to gas stream; must be accounted for in dosing calculations |
| Injection Rate (Water Rate Basis) | 0.25–0.5 L MEG per L produced water at 30 wt% target concentration | 0.2–0.35 L methanol per L produced water; additional vapor-phase dose required |
| Hydrate Depression Per Unit | ~0.3–0.4°C per wt% (Hammerschmidt correlation) | ~0.45–0.55°C per wt% — slightly more effective per unit mass in liquid phase |
| System Complexity | Higher — requires MEG regeneration, storage, and injection equipment; slug risk management at startup | Lower — simpler injection skids; no regeneration required; preferred for intermittent or low-rate systems |
| Typical Application | Deepwater tiebacks, long subsea flowlines, high water cut producers with continuous injection requirement | Onshore gas gathering, intermittent deepwater operations, startup/shutdown hydrate prevention, batch treatment |
| Environmental & Regulatory | Biodegradable; lower environmental impact; preferred for offshore discharge-constrained environments | Toxicity considerations limit offshore use in some jurisdictions; disposal handling required |
The Hammerschmidt equation — ΔT = (K × W) / (M × (100 − W)) — provides the industry-standard calculation for hydrate temperature depression as a function of inhibitor weight percent in the aqueous phase. For MEG, K = 2,222; for methanol, K = 2,335. The target subcooling margin — the temperature buffer between the operating temperature and the hydrate formation curve — is typically set at 3–5°C for normal operations and 5–8°C for startup or transient conditions where pipeline temperatures are most uncertain.
MEG Injection Rate Calculation: From Water Rate to Pump Setting
Accurate MEG injection rate calculation requires three inputs: the produced water rate at the injection point, the target MEG concentration in the aqueous phase, and the MEG concentration of the injection stream (lean MEG purity from the regeneration unit). The calculation determines the volumetric injection rate needed to achieve the target inhibitor concentration in the total aqueous phase arriving at the injection point.
Methanol Injection: Vapor-Phase Losses and Total Dose Calculation
Methanol injection calculations carry an additional complexity that MEG calculations do not: methanol partitions between the aqueous phase, the liquid hydrocarbon phase, and the gas phase. The vapor-phase loss to the gas stream is significant at typical pipeline operating conditions and must be included in the total methanol dose, or the aqueous-phase inhibitor concentration will be lower than calculated — potentially leaving the system underinhibited.
The Nielsen-Bucklin correlation provides a more accurate hydrate depression estimate for methanol at high concentrations than the Hammerschmidt equation: ΔT = −72 × ln(x_w), where x_w is the mole fraction of water in the aqueous phase. For methanol concentrations above 25 wt%, this correlation better represents experimental data. Total methanol injection rate must include: the aqueous-phase requirement calculated from the target concentration, the vapor-phase loss calculated from the Yaws or GPSA correlation for methanol in gas at the pipeline conditions, and the condensate-phase partitioning estimated from distribution coefficients.
Methanol economics for intermittent operations — startup, pigging, and shutdown hydrate prevention — are typically favorable over MEG because capital cost for a simple injection skid and tank is far lower than a MEG regeneration system. For continuous high-water-rate operations exceeding approximately 500 m³/day produced water, MEG with recovery becomes cost-competitive and eventually mandatory as methanol disposal cost dominates. Book a Demo of iFactory's inhibitor economics module to compare MEG and methanol total cost of ownership for your production profile.
Deepwater Pipeline Hydrate Risk: Startup and Shutdown Procedures
The highest hydrate risk windows in deepwater pipeline operations are not steady-state production — they are startup, shutdown, and pigging operations, when pipeline inventories cool to near-ambient seabed temperatures and inhibitor distribution is non-uniform. Understanding the risk profile of each transient operational phase is the prerequisite for designing adequate chemical inhibitor procedures.
Expert Review: What Pipeline Operators Underestimate in Hydrate Inhibitor Programs
Frequently Asked Questions
Conclusion: Hydrate Prevention Is a Real-Time Data Problem
MEG and methanol injection provide reliable hydrate prevention in wet gas pipelines when injection rates are correctly calculated and continuously adjusted to match actual production conditions. The thermodynamic basis is well-established — Hammerschmidt and Nielsen-Bucklin correlations, hydrate formation curve mapping, subcooling margin targets — and the calculation methodology is straightforward when accurate input data is available. The operational failure mode is almost never a wrong formula. It is a correct formula applied to stale data: a water rate from last quarter's production report, a lean MEG purity that has degraded since the last lab sample, an injection setpoint that has not tracked the field's increasing water cut.
For U.S. midstream operators and offshore production engineers, the value of integrating pipeline process data with inhibitor injection management is not primarily analytical — it is operational. Real-time subcooling margin tracking converts hydrate prevention from a periodic engineering exercise into a continuous, alarm-driven process discipline. That shift is what separates operations that respond to hydrate events from operations that prevent them.