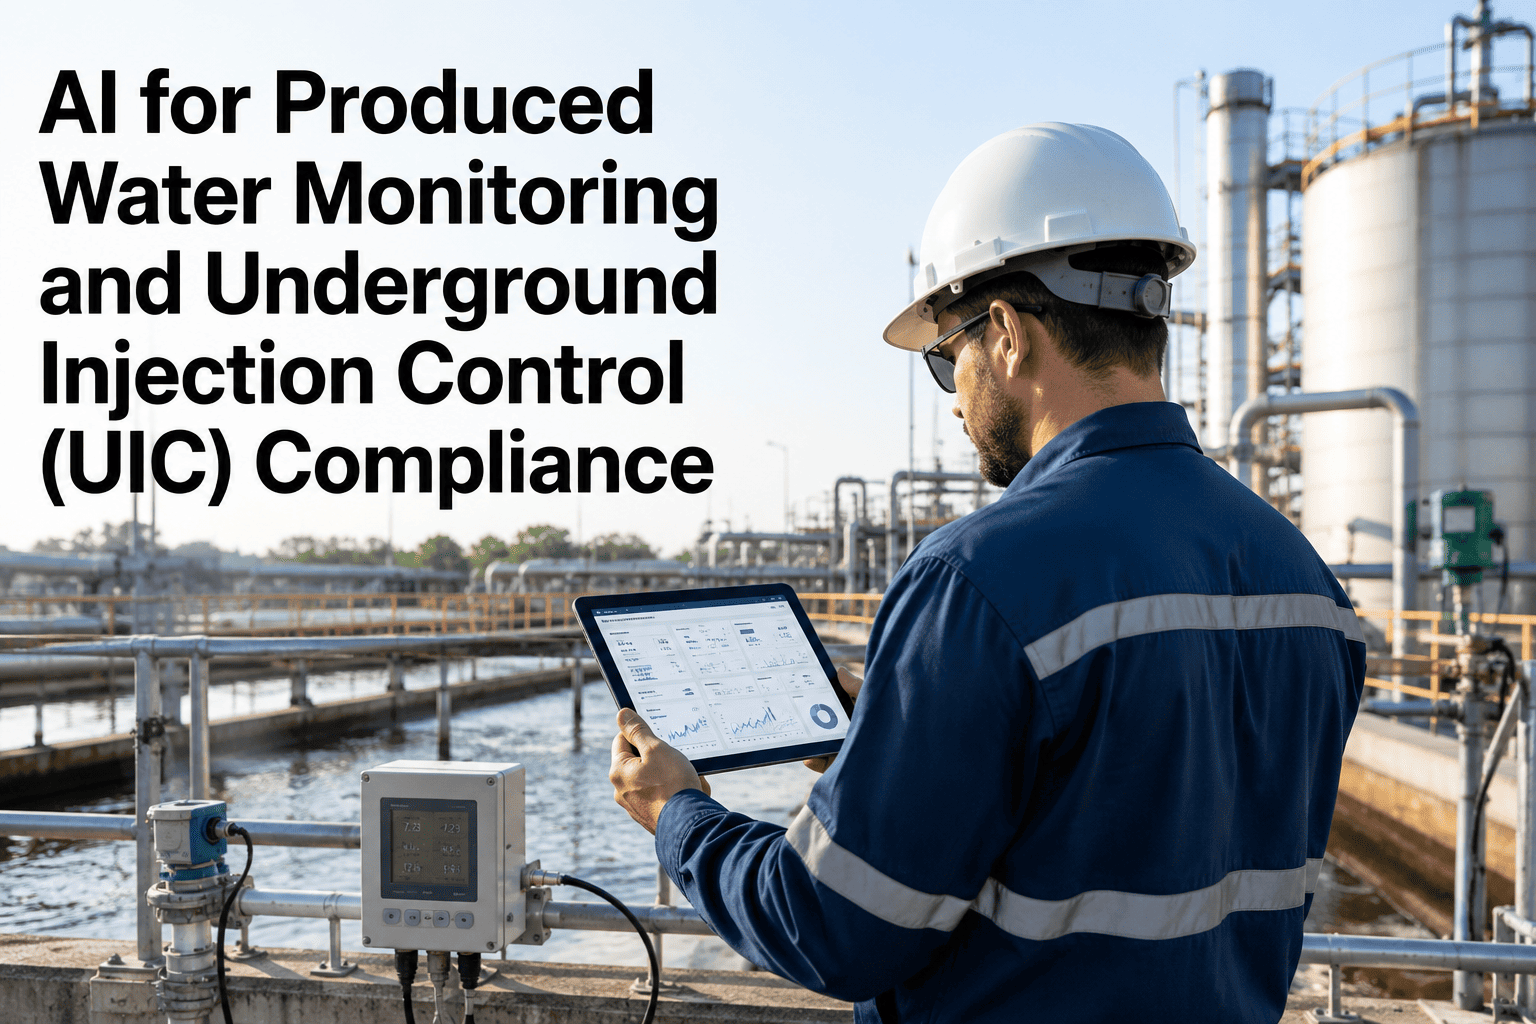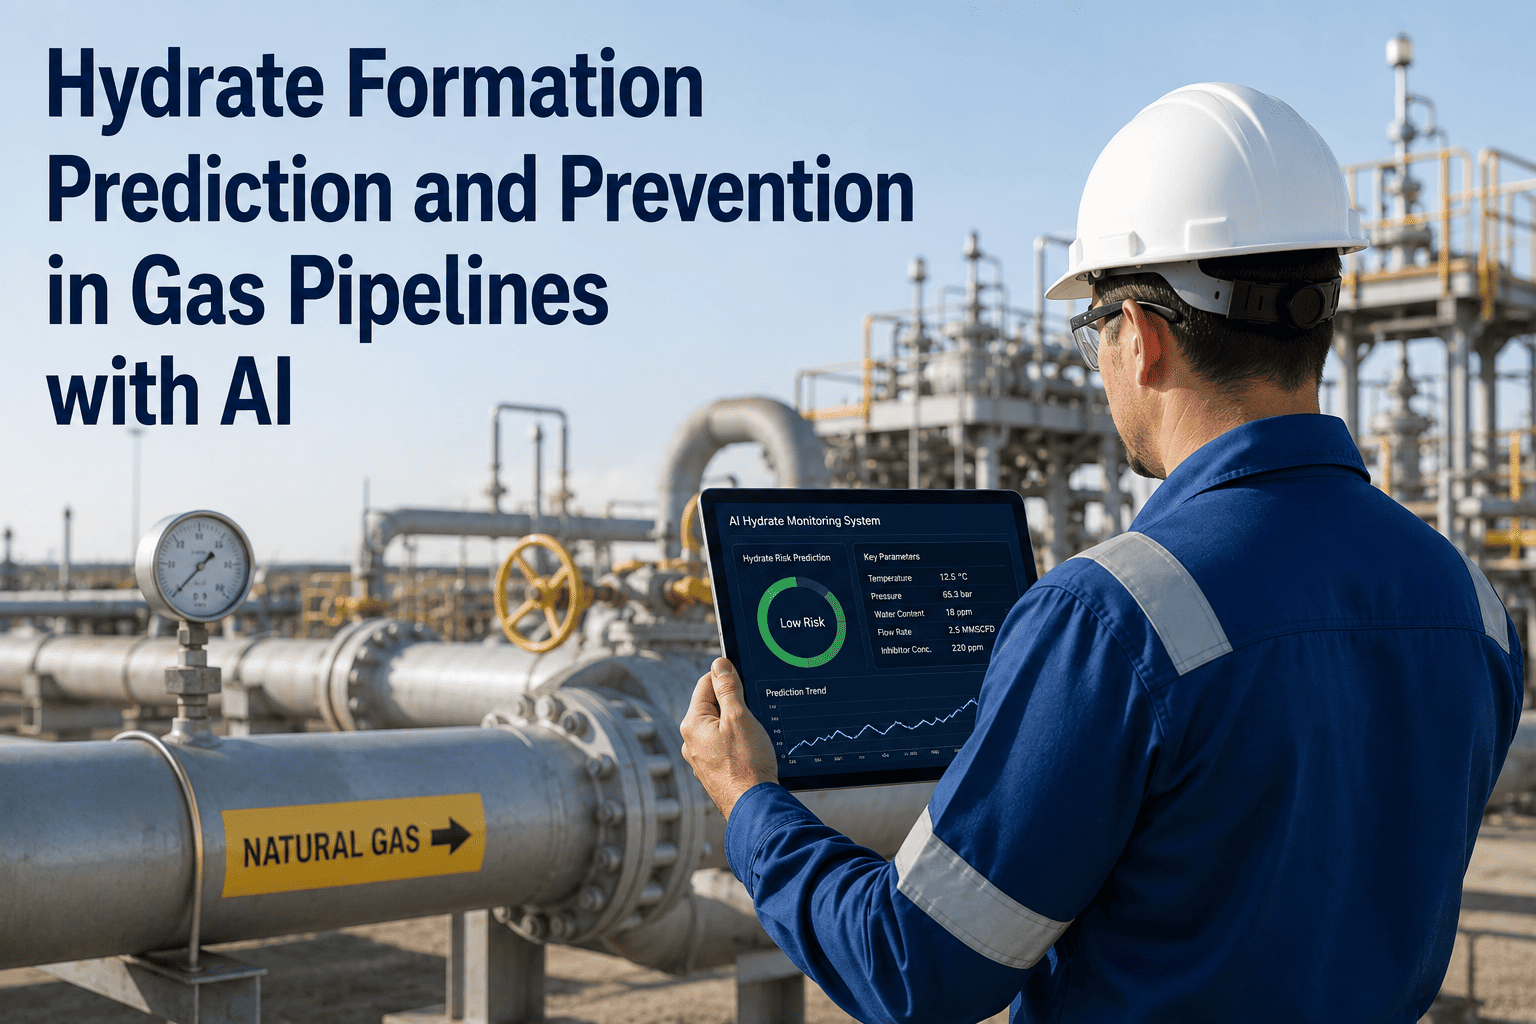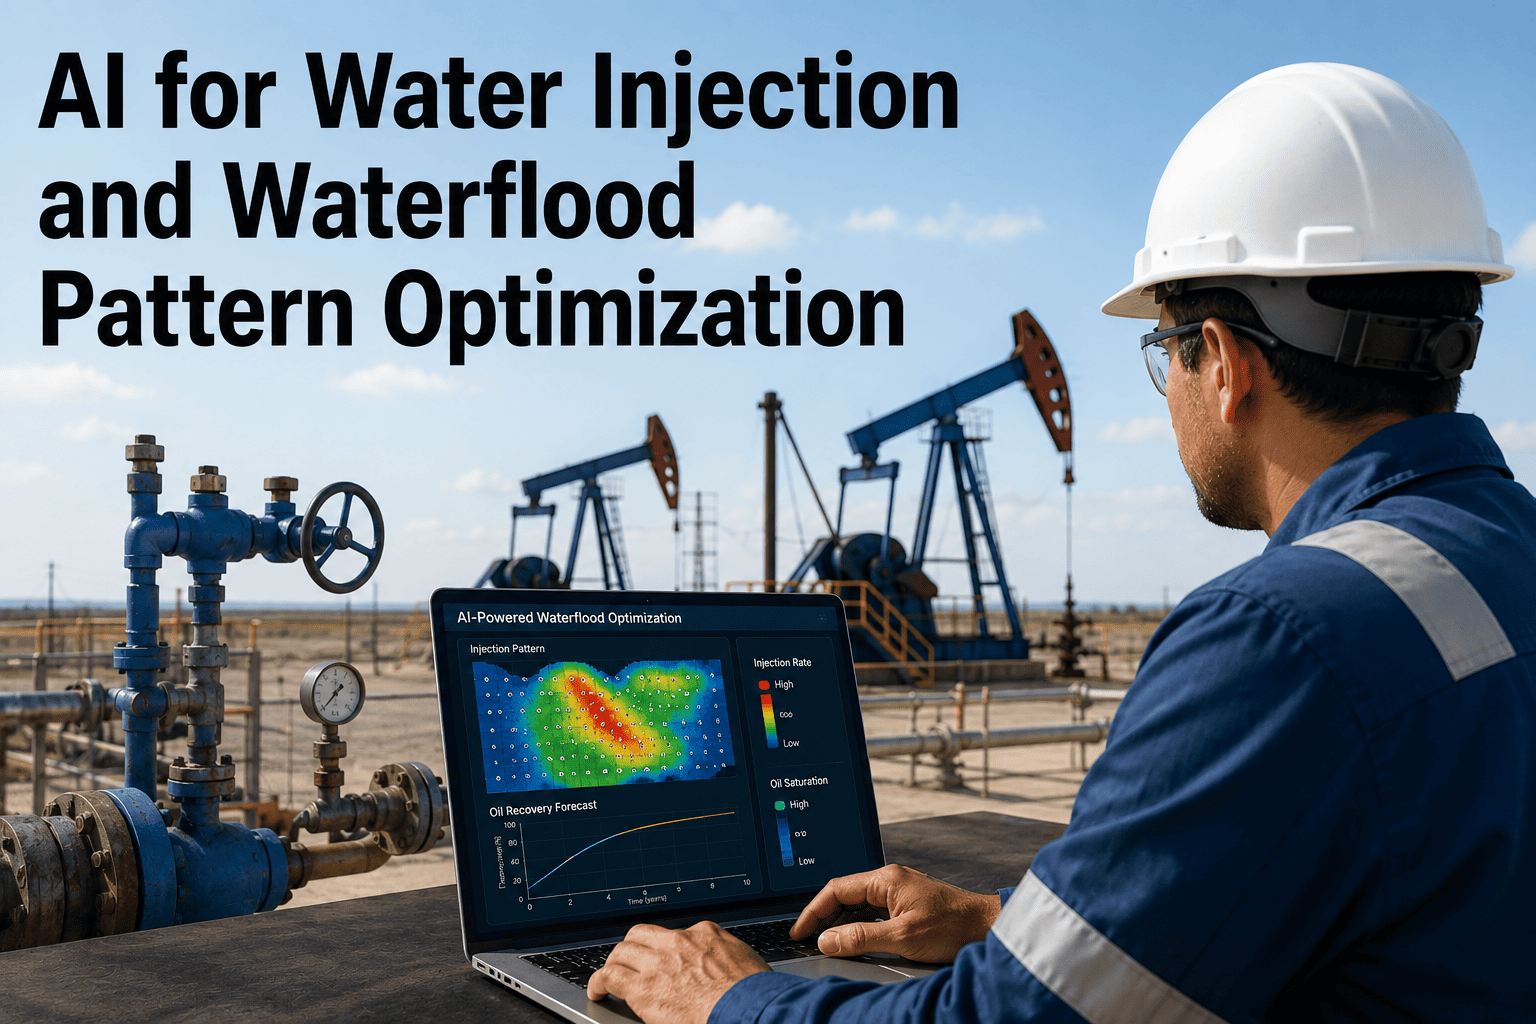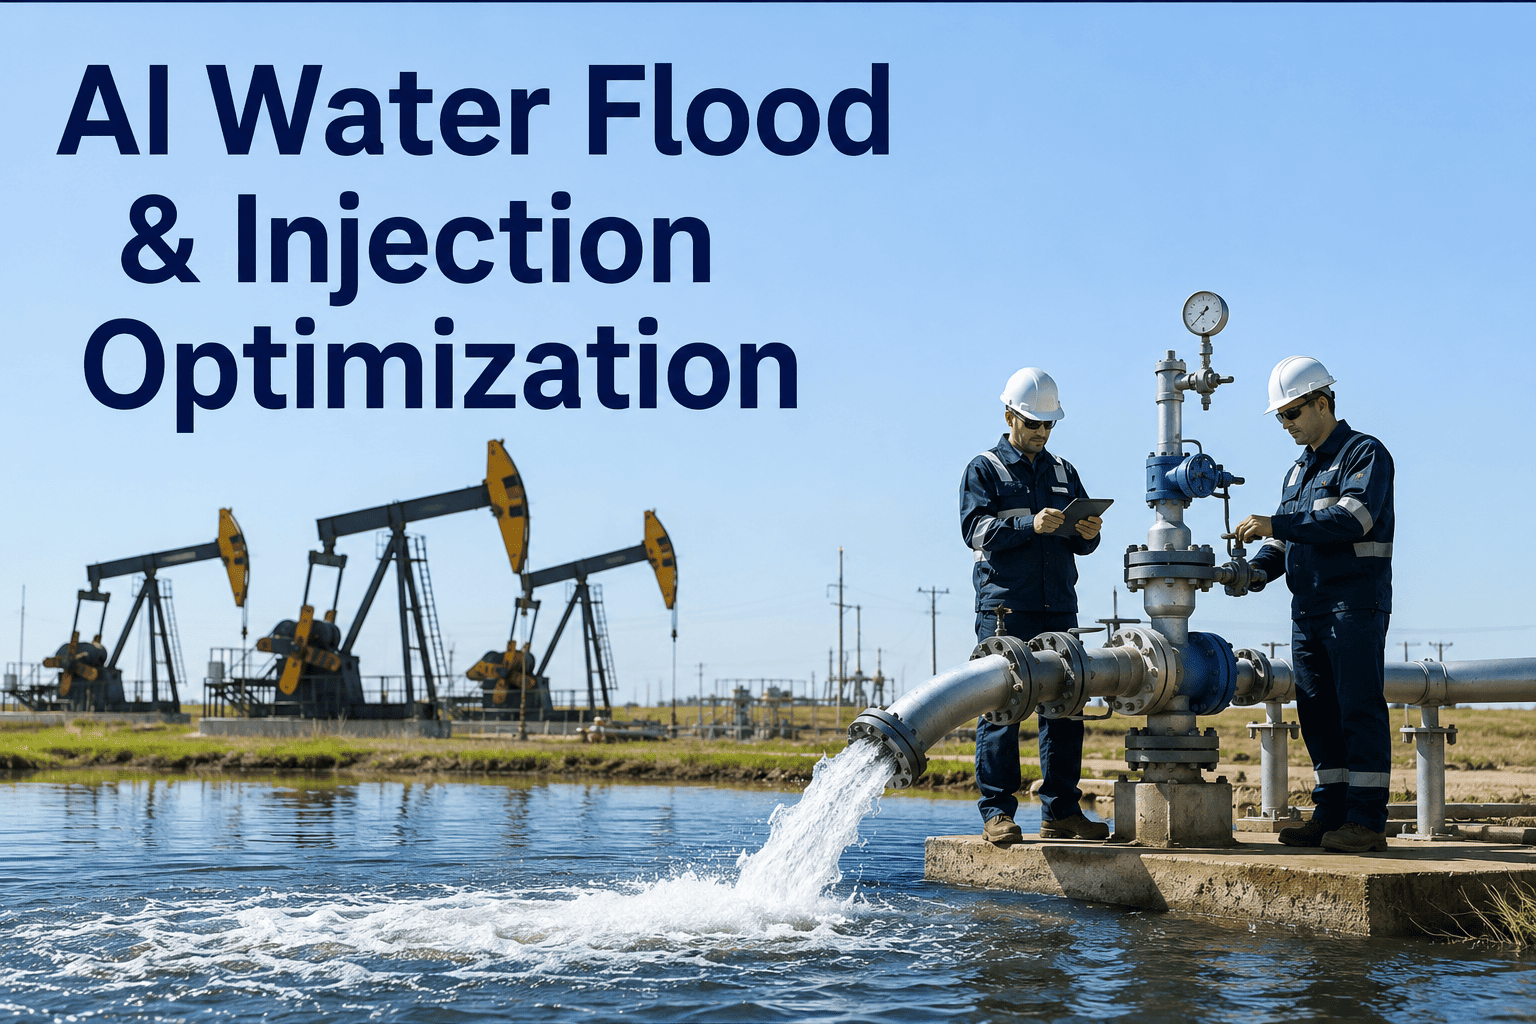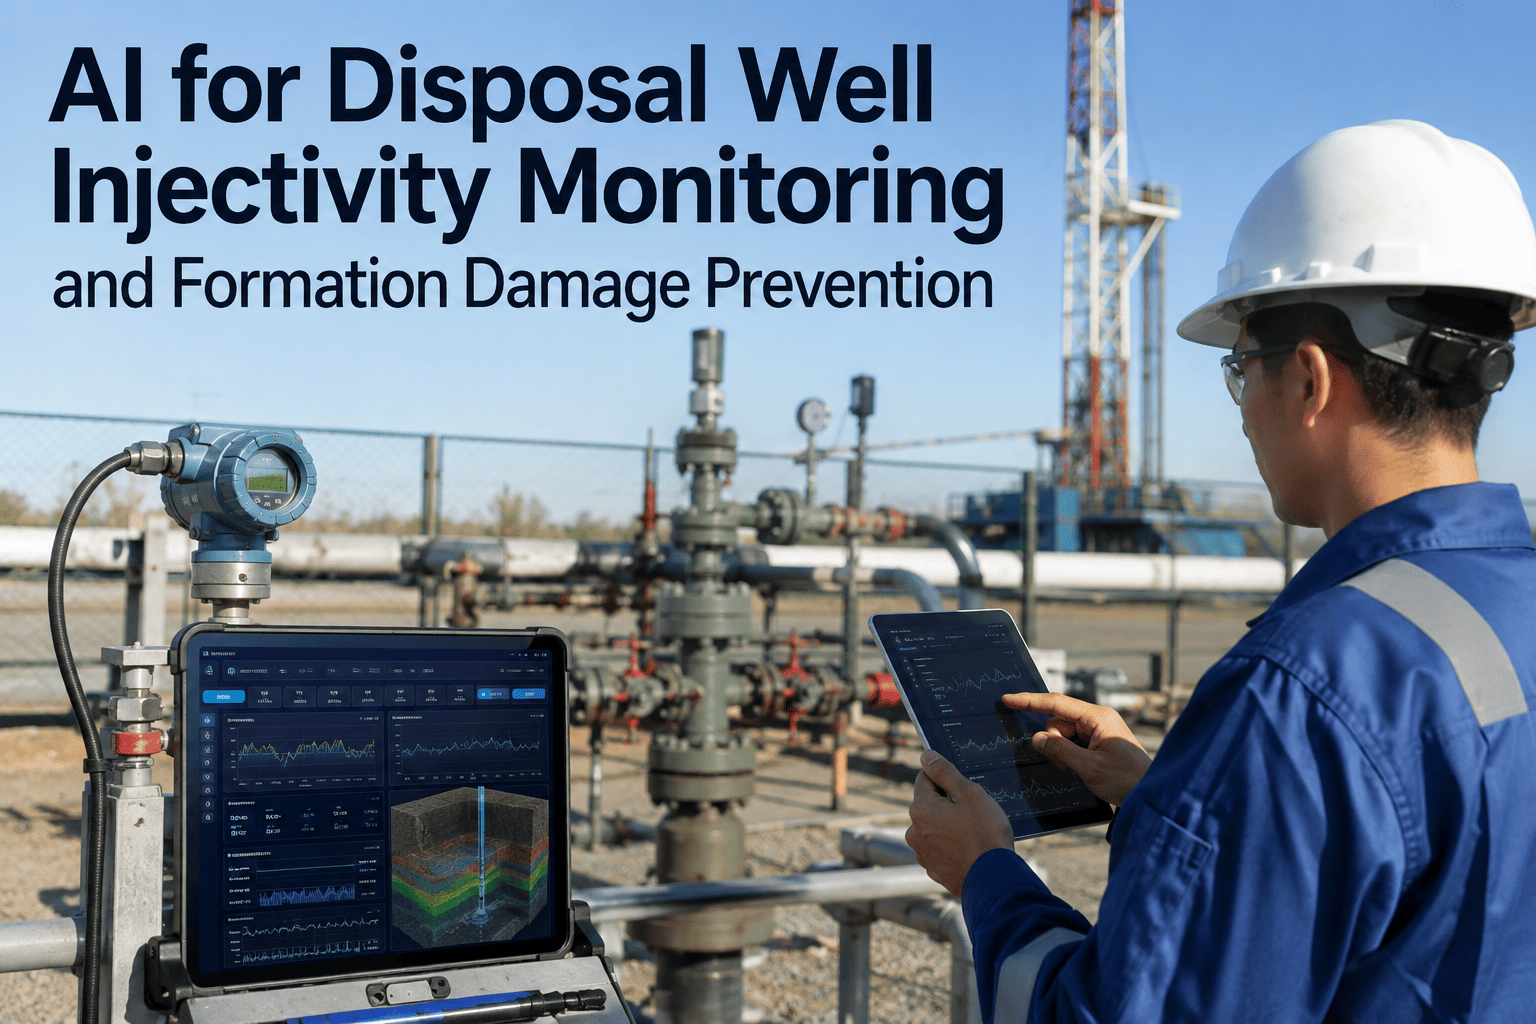
A saltwater disposal well rarely fails all at once. What actually happens is a slow climb in wellhead injection pressure at the same injection rate, week after week, until an operator either catches it early or gets a call from the regulator. Disposal water carries suspended solids, residual oil, biofilms, and treatment chemicals that plug perforations and damage the near-wellbore formation matrix long before anyone notices a problem on a monthly report. By the time injection pressure approaches the permitted maximum — typically capped at roughly half a psi per foot of depth to the injection interval in most U.S. jurisdictions — the well may already be operating on borrowed time, one bad batch of produced water away from a permit exceedance. The mechanisms behind that pressure climb are well documented in the literature; what most disposal well operators lack is a way to watch the trend closely enough to act on it before the regulator does. That gap is where continuous AI monitoring changes the equation, and it's worth walking through exactly how before your next injection pressure exception lands on someone's desk — details are available through support.
Catch Injectivity Decline Before It Becomes a Permit Problem
iFactory's AI tracks injection pressure against rate, continuously, well by well — flagging formation plugging, scale buildup, and near-wellbore damage while there is still time to intervene, instead of after the wellhead pressure trips a regulatory limit.
Three Mechanisms Behind Every Injectivity Decline
Rising injection pressure at constant rate is the symptom. The underlying cause is almost always one of three mechanisms, and each one leaves a slightly different signature in the pressure trend — which is exactly what a continuous monitoring model is trained to tell apart.
Suspended solids, carryover oil, and biofilms from commingled produced water build up in casing, tubing, and perforations, physically blocking flow paths into the formation.
Incompatibility between injected water chemistry and native formation brine precipitates inorganic scale in the near-wellbore region, reducing effective pore space.
Fines migration, clay swelling, or mechanical skin from workovers reduces permeability immediately around the wellbore, independent of injected water quality.
What Regulators Actually Enforce
Injectivity decline is an operations problem long before it becomes a compliance problem — but it becomes one fast once wellhead pressure approaches the permitted ceiling. These are the thresholds most Class II disposal well permits are built around.
How a Healthy Well Becomes a Permit Exceedance
Injectivity decline moves through predictable stages. The problem is that most operators only look closely once a well is already in Stage 2 or 3 — by which point the fix is a workover instead of a water treatment adjustment.
Baseline Operation
Pressure-rate relationship holds steady near its historical curve. No visible trend on a monthly report, and nothing that would prompt a closer look.
Early Deviation
Pressure begins drifting above the historical curve at the same rate — a change of a few percent, easy to miss in a monthly snapshot but visible in a continuous trend.
Accelerating Decline
The rate of pressure increase itself starts climbing, consistent with plugging or scale compounding on itself. A fall-off test at this stage typically confirms rising skin.
Limit Approach or Exceedance
Injection pressure nears or crosses the permitted maximum. Options narrow to rate curtailment, stimulation treatment, or a permit-triggered shut-in and review.
What the AI Watches for Each Mechanism
Because the three damage mechanisms leave different signatures, the model doesn't just flag "pressure is rising" — it narrows down which mechanism is most likely driving the trend, so the intervention matches the cause.
The model's job is to narrow the diagnosis and surface it early — a field engineer still confirms the mechanism with a fall-off test or water sample before committing to a treatment.
Know Which Wells Are Approaching Their Limit
Bring wellhead pressure and rate history from your disposal well network and see, well by well, how close each one is running to its permitted maximum — before the next regulatory report is due.
Five Reasons Injectivity Decline Gets Caught Late
None of these are unusual practices — they are simply the default way most disposal well networks are monitored, and each one adds weeks or months of delay between the first pressure deviation and someone noticing it.
Monthly reporting hides a weekly trend
A pressure that has been drifting upward for six weeks looks unremarkable on a monthly report, because the comparison point is a single prior month, not a continuous curve.
Pressure reviewed without rate context
Injection pressure alone means little — the same pressure at a lower rate can indicate serious formation damage that a rate-blind review would miss entirely.
Water quality data lives in a separate system
Suspended solids and oil carryover data sit in a treatment facility log disconnected from wellhead pressure data, so the correlation that would explain a pressure rise never gets made.
Fall-off testing happens on a fixed schedule, not a trigger
Diagnostic testing waits for the next scheduled mechanical integrity test instead of being triggered the moment a pressure trend crosses a meaningful threshold.
No well-specific baseline, just a permit ceiling
Tracking only the permitted maximum means a well can lose significant injectivity and still look fine on paper, right up until it doesn't.
Frequently Asked Questions
How early can the model actually detect injectivity decline compared to a manual review?
Because the model compares continuous pressure and rate data against each well's own historical curve rather than waiting for a monthly snapshot, it typically surfaces a meaningful deviation within days of the trend starting, not weeks. The exact lead time depends on how noisy a given well's baseline is and how much historical data exists to establish that baseline confidently. The clearest way to see the difference against your own wells is to book a demo and run a sample of pressure history through the model.
Can the AI tell the difference between plugging, scale, and near-wellbore damage without a fall-off test?
It narrows the likely mechanism using the shape and timing of the pressure trend along with correlated data such as water quality logs and workover history, but it does not replace diagnostic testing. What it does is tell your team which mechanism is most probable so the fall-off test or water sample that follows is targeted and confirmatory rather than exploratory, which shortens the time between suspicion and a confirmed treatment plan.
Does this require new downhole sensors, or does it work with what we already collect?
Most disposal well networks already collect wellhead injection pressure and rate data for regulatory reporting, and that is the core data the model needs to start. Water quality data from treatment facility logs improves the model's ability to distinguish plugging from scale, and workover history improves near-wellbore damage detection, but none of these require new field hardware — they typically just need to be connected to the same platform. The support team can walk through what your specific data sources look like.
What happens once the model flags a well as approaching Stage 2 or Stage 3?
The well is surfaced on a dashboard with the pressure trend, the most likely mechanism, and a recommended next step — typically a targeted fall-off test, a water quality check, or a rate adjustment depending on the signature. Your engineering team makes the final call on treatment, since a stimulation decision depends on well economics and disposal capacity needs that sit outside the pressure trend itself. The goal is to get that decision in front of your team weeks earlier than a monthly report would.
How does this help with regulatory reporting specifically, beyond just catching problems earlier?
Continuous monitoring gives you a documented, timestamped record of when a pressure trend was first identified and what action followed, which is useful evidence of active well management if a regulator ever reviews a well's compliance history. It also means fewer surprise exceedances, since the whole point of catching Stage 1 deviations is to resolve them before they become the kind of substantial permit violation that triggers a review in the first place.
The Fix Is Almost Always Cheaper the Earlier It's Caught
A well caught in Stage 1 deviation is a water treatment or scale inhibitor adjustment. The same well caught in Stage 3, at or near its permitted pressure ceiling, is a stimulation treatment, a curtailed disposal capacity, and possibly a regulatory conversation none of that needed to happen. The mechanisms behind injectivity decline are well understood — what most operators lack isn't knowledge of the physics, it's a continuous enough view of the pressure trend to catch the deviation while it is still cheap to fix.
See Your Disposal Well Network's Real Injectivity Trend
Book a 30-minute demo with an iFactory water management engineer. Bring pressure and rate history from your disposal wells and leave with a clear view of which ones are drifting and why.