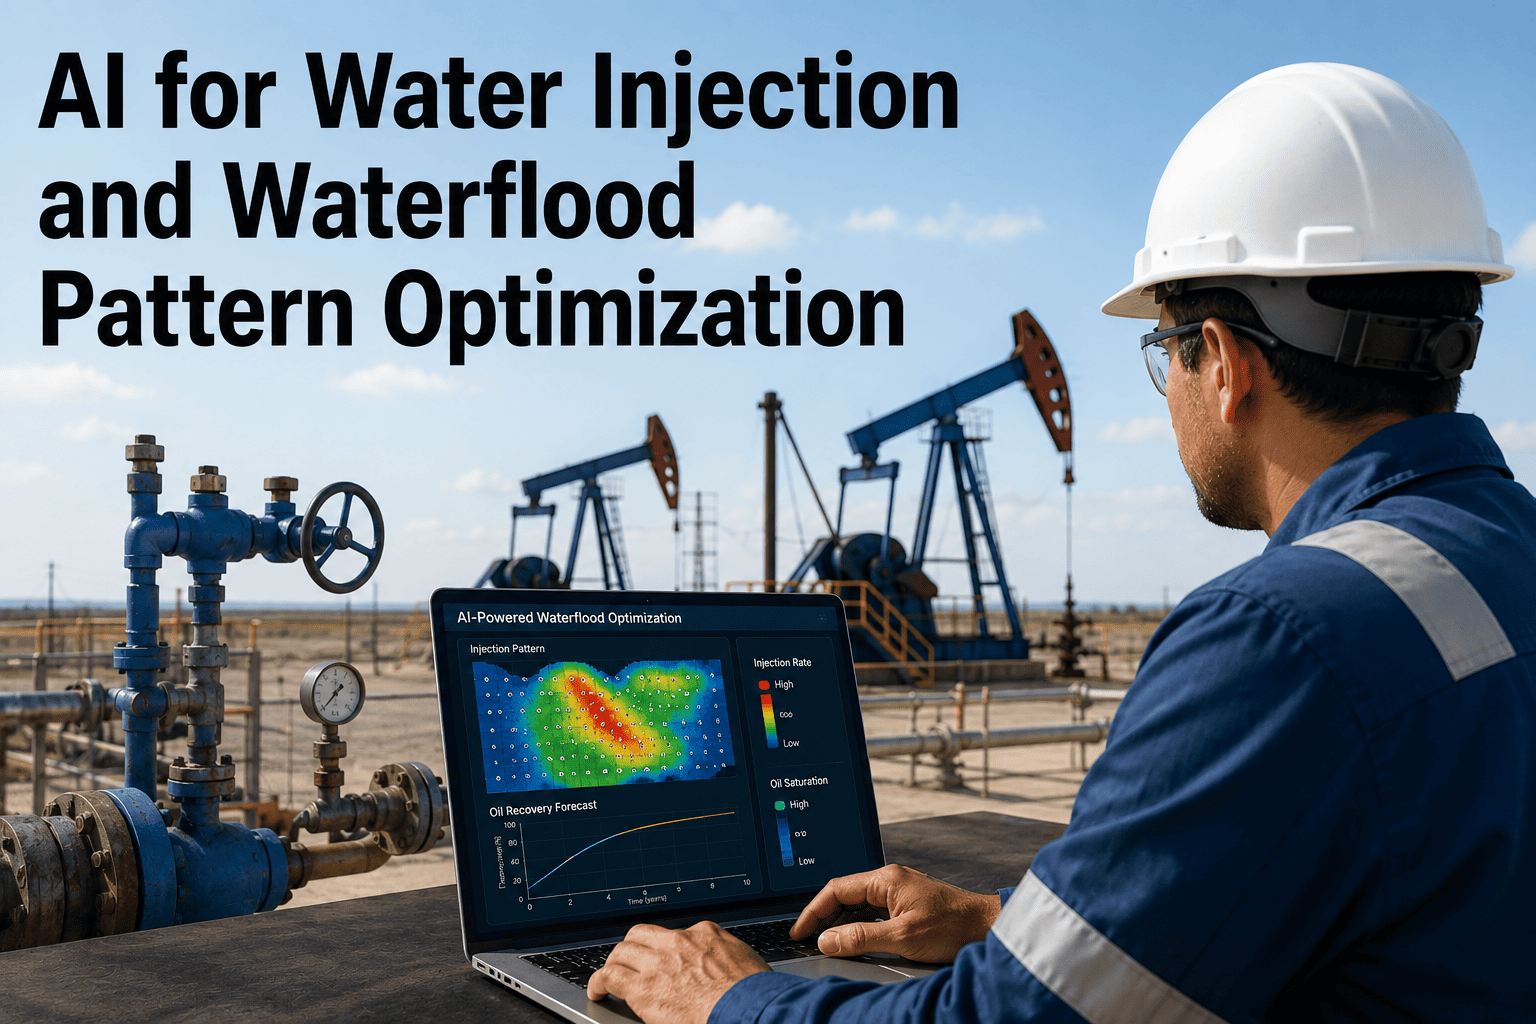
Most waterfloods start with a reasonable injection plan and drift away from it one quarter at a time. A pattern that looked balanced at first-fill develops a fast layer nobody adjusted for, a producer starts cutting water early while its neighbor barely moves, and the response is usually to leave injection rates alone because nobody has a clear enough picture of which well is actually driving the imbalance. Reservoir heterogeneity does not announce itself; it shows up months later as an unswept pocket of oil and a producer that watered out faster than the type curve said it should. Book a demo to see how AI reads pressure response, tracer data, and water cut trends together to catch that drift while it's still cheap to correct.
Upstream Oil & Gas · Water Management
Every Injector in the Pattern Is Telling You Something Different. Are You Listening to All of Them?
iFactory combines reservoir pressure response, tracer breakthrough timing, and production well water cut trends into a live per-well injection rate recommendation, so sweep efficiency stops depending on how the pattern looked on day one.
~5%Reservoir oil rate gain reported from connectivity-based injection reallocation on a mature field
~2.5%Oil productivity increase seen from ML-optimized per-well injection rates in field studies
1stCause of premature breakthrough is almost always reservoir heterogeneity, not injection volume
Where Sweep Efficiency Actually Leaks Out
The Pattern Was Balanced Once. It Isn't Anymore, and Nobody Set a Date to Check.
A waterflood pattern is designed once, against a geologic model that was the best available picture at the time. Every quarter after that, real injection and production data quietly reveals where that model was wrong, and most operations don't have a standing process for translating those revelations back into rate changes. The gap tends to widen slowly enough that no single month looks alarming, which is exactly why it survives so many quarterly reviews unaddressed.
High-Permeability Channels Steal the Flood
A thin high-permeability streak can carry a disproportionate share of injected water straight to a producer, leaving the rest of the pattern under-swept while that one well cuts water early.
Uniform Rates Ignore Layered Reservoirs
Multilayered sandstone reservoirs run at a fixed, equal injection rate across layers routinely end up over-saturated in some zones and barely touched in others.
Tracer Data Gets Run Once and Filed
An inter-well tracer test is often treated as a one-time diagnostic instead of an ongoing input, so a connectivity picture from years ago keeps informing rate decisions long after the reservoir has moved on.
Water Cut Rise Gets Reacted to, Not Anticipated
By the time a producer's water cut climb triggers a conversation about rebalancing the pattern, the injector driving it has often been over-delivering for months.
Where the Underlying Techniques Come From
This Isn't a New Idea. It's an Old One Finally Running Continuously.
Connectivity mapping, streamline-based sweep analysis, and rate optimization based on injector-producer response are all established reservoir engineering techniques. What has historically limited them is speed: a full connectivity study built from tracer and pressure data has traditionally been a project that takes weeks, run once and then left in a drawer until the next major review. The value of automating that analysis isn't a new method, it's running an established method continuously enough to actually keep pace with a changing reservoir, so a rate decision in March doesn't have to rely on a connectivity picture built the previous summer.
Capacitance-Resistance and Connectivity Models
Well-to-well connectivity can be estimated directly from injection and production rate history, giving a data-driven view of the pattern that doesn't depend on the original geologic model being exactly right.
Streamline-Based Sweep Diagnostics
Streamline simulation reveals which injector-producer pairs are carrying disproportionate flow, making it possible to score sweep efficiency well by well rather than for the pattern as a whole.
Machine Learning Rate Optimization
Once connectivity and sweep efficiency are estimated, optimization algorithms can search for the injection rate allocation that improves oil recovery within each well's real operating limits, far faster than manual trial and error.
What Gets Tracked Per Pattern
Three Signals That Only Mean Something When Read Together
Any one of these signals on its own tells an incomplete story. Pressure response without tracer data can't distinguish a fast layer from a fully connected one. Water cut trends without pressure context can't tell you whether the fix is a rate cut or a completely different injector. AI reads all three against each other, continuously, instead of one report at a time, and updates its picture of the pattern every time new data arrives rather than waiting for the next scheduled analysis.
01
Reservoir Pressure Response
Pressure buildup and falloff at each injector and offset producer are tracked to reveal which wells are actually in communication and how strongly, independent of what the original geologic model assumed.
02
Tracer Breakthrough Data
Breakthrough timing and concentration at each producer are used to build and continuously update a connectivity map, so injector-producer pairs with unusually fast or strong communication are flagged as they emerge.
03
Production Well Water Cut Trends
Water cut trajectory at each producer is compared against its expected decline curve, surfacing early divergence that points back to a specific injector before the well is fully watered out.
How It Works
From Raw Field Data to a Per-Well Injection Rate Recommendation
1
Data Consolidation
Injection rates, bottomhole pressures, tracer results, and producer water cut histories are pulled into one continuously updated dataset instead of separate spreadsheets on separate schedules, so the same rate decision doesn't have to be reconstructed from scratch every time it's revisited.
2
Connectivity Mapping
Injector-producer connectivity is estimated from pressure and tracer response, producing a live map of which wells are actually driving which producers' performance.
3
Sweep Efficiency Scoring
Each injector is scored on how efficiently its water is contributing to oil recovery versus how much is simply moving toward an already-flooded producer.
4
Rate Optimization
Injection rates are recommended per well to redirect volume away from over-swept paths and toward under-swept zones, within each well's real operating constraints.
5
Ongoing Recalibration
As new pressure, tracer, and water cut data arrives, the connectivity map and rate recommendations update, instead of waiting for the next scheduled reservoir review.
Find Out Which Injector Is Actually Driving Your Fastest-Watering Producer
See how iFactory builds a connectivity map from your existing pressure, tracer, and water cut data, and what it recommends changing first.
Conventional vs. AI-Optimized
What Changes When Rate Allocation Follows the Data Instead of the Original Plan
| Allocation Approach |
Conventional Pattern Management |
AI-Optimized Allocation |
| Injection Rate Basis |
Set at pattern design and rarely revisited per well |
Continuously recalculated from live pressure and tracer data |
| Connectivity Awareness |
Based on a tracer test run once, years earlier |
Updated continuously as new tracer and pressure data arrives |
| Water Cut Response |
Reviewed at scheduled reservoir meetings, often quarterly |
Flagged as soon as a producer diverges from its expected curve |
| Layer-Level Allocation |
Uniform rate applied across a multilayer completion |
Rate guidance reflects layer-level sweep performance where data allows |
| Decision Turnaround |
Weeks, tied to the next scheduled reservoir review |
Recommendations available as new field data comes in |
Early Warning Signs
What a Pattern Needing Rebalancing Usually Looks Like First
None of these signs are dramatic on their own. That's exactly why they tend to get missed until the water cut trend is impossible to ignore.
One Producer Responds Faster to a Rate Change Than Its Neighbors
A pressure increase at one injector shows up almost immediately at one specific producer and barely at all at the others sharing the same pattern, a strong signal of a preferential flow path.
Tracer Breakthrough Arrives Well Ahead of Model Predictions
When tracer shows up at a producer much sooner than the geologic model expected, it usually means the reservoir has a higher-permeability path than the original characterization accounted for.
Water Cut Climbs While Oil Rate Stays Flat
A producer taking on more water without a corresponding oil rate benefit is a sign the incremental injection is bypassing oil rather than displacing it.
A Producer Underperforms Its Type Curve With No Obvious Mechanical Cause
When a well quietly falls behind its expected decline curve and nothing mechanical explains it, an under-swept zone tied to injection allocation is one of the first things worth ruling out.
Injection Pressure Climbs Without a Matching Rate Increase
Rising injection pressure at constant rate often signals the near-wellbore area is losing injectivity, which can mask a connectivity problem until the well is choked back for unrelated reasons.
A Realistic Scenario
How This Plays Out on a Mature Waterflood
A mature field with over a hundred active producers has been running the same injection allocation for years, adjusted occasionally based on gut feel during monthly reservoir meetings. A connectivity analysis built from pressure response and existing tracer data identifies a small group of injectors that are strongly connected to already high-water-cut producers, while an under-swept area on the pattern's edge barely shows up in the tracer results at all. Reallocating injection volume away from the over-connected wells and toward the edge of the pattern is projected to lift reservoir oil rate by several percentage points, using data the field was already collecting but had never analyzed together in one place. None of the wells involved needed a workover or a new completion; the gain came entirely from redirecting volume that was already being injected, toward where it actually helps recovery instead of where it was easiest to send.
Illustrative scenario based on published connectivity-based reallocation studies in mature waterflood fields
Before Your Next Reservoir Review
Five Questions Worth Asking About Your Current Waterflood Pattern
A team that can answer all five of these for its most mature pattern already has a stronger handle on sweep efficiency than most fields running on the original design rates, and is far better positioned to justify a reallocation decision when one is warranted.
01
When was your last tracer test, and has injection allocation actually been updated based on what it showed?
02
Do you know which specific injector is most responsible for your fastest-watering producer, or only that the pattern as a whole is watering up?
03
Are injection rates set uniformly across a multilayer completion, or adjusted for how each layer is actually sweeping?
04
How long does it take from noticing a water cut anomaly to actually changing an injection rate in response?
05
Is there an area of the pattern you'd genuinely call under-swept, and when did anyone last check?
Frequently Asked Questions
AI for Waterflood Pattern Optimization — Common Questions
Does this replace reservoir simulation, or work alongside it?
It works alongside it. A full-physics reservoir simulator remains the right tool for long-horizon forecasting and major development decisions, but rebuilding and rerunning a simulation every time field data shifts is often too slow for week-to-week rate decisions. Data-driven connectivity and rate optimization is built to be fast enough to keep pace with real field data, and its recommendations can inform when a fuller simulation update is actually warranted, rather than triggering a full reservoir study every time a pattern shows early signs of imbalance.
Contact support to see how the two fit together in your existing workflow.
What data does the system need to start producing useful recommendations?
At minimum, historical and current injection rates, bottomhole or surface pressures, and producer water cut and oil rate histories. Tracer test results significantly sharpen the connectivity picture where available, but a useful first pass can be built from pressure and production data alone, with tracer data layered in as it becomes available. Most facilities already have this data in a historian or production database, which means the setup effort is usually about connecting existing sources rather than launching a new data collection program.
How often should injection rates actually be adjusted based on this kind of analysis?
There's no fixed cadence that fits every field, since it depends on how quickly the reservoir is changing and how much room operators have to adjust rates within existing constraints. The value of continuous analysis isn't that it forces constant rate changes, it's that when a change is warranted, the team knows immediately instead of waiting for the next scheduled review to notice. In practice, most fields settle into a rhythm where routine small adjustments happen frequently and larger reallocation decisions still go through the normal review process, just with better evidence behind them.
Can this help identify candidates for infill drilling or pattern redesign, not just rate changes?
Yes. An under-swept zone that shows up consistently in the connectivity map, without a nearby injector capable of reaching it through rate adjustment alone, is exactly the kind of finding that supports a case for infill drilling or a broader pattern redesign, backed by the same connectivity data used for day-to-day rate decisions. That combination of evidence tends to make the capital case easier to build, since the recommendation is grounded in observed reservoir response rather than only a static geologic model.
Does this work for both mature waterfloods and newer patterns still ramping up?
Yes, though the value looks different in each case. On a mature flood, the priority is usually identifying where years of uniform allocation have created imbalance. On a newer pattern, the priority is catching an emerging preferential flow path early, before it has years to compound into a hard-to-reverse sweep problem. Waiting until a flood is mature to start this kind of analysis usually means correcting an imbalance that has already cost several years of suboptimal recovery, rather than preventing it from forming in the first place.
Book a demo to see which situation matches your current pattern.
Your Reservoir Is Already Telling You Where the Sweep Is Failing
See how AI turns your existing pressure, tracer, and water cut data into a per-well injection rate recommendation built for maximum sweep efficiency.


-optimization.png)