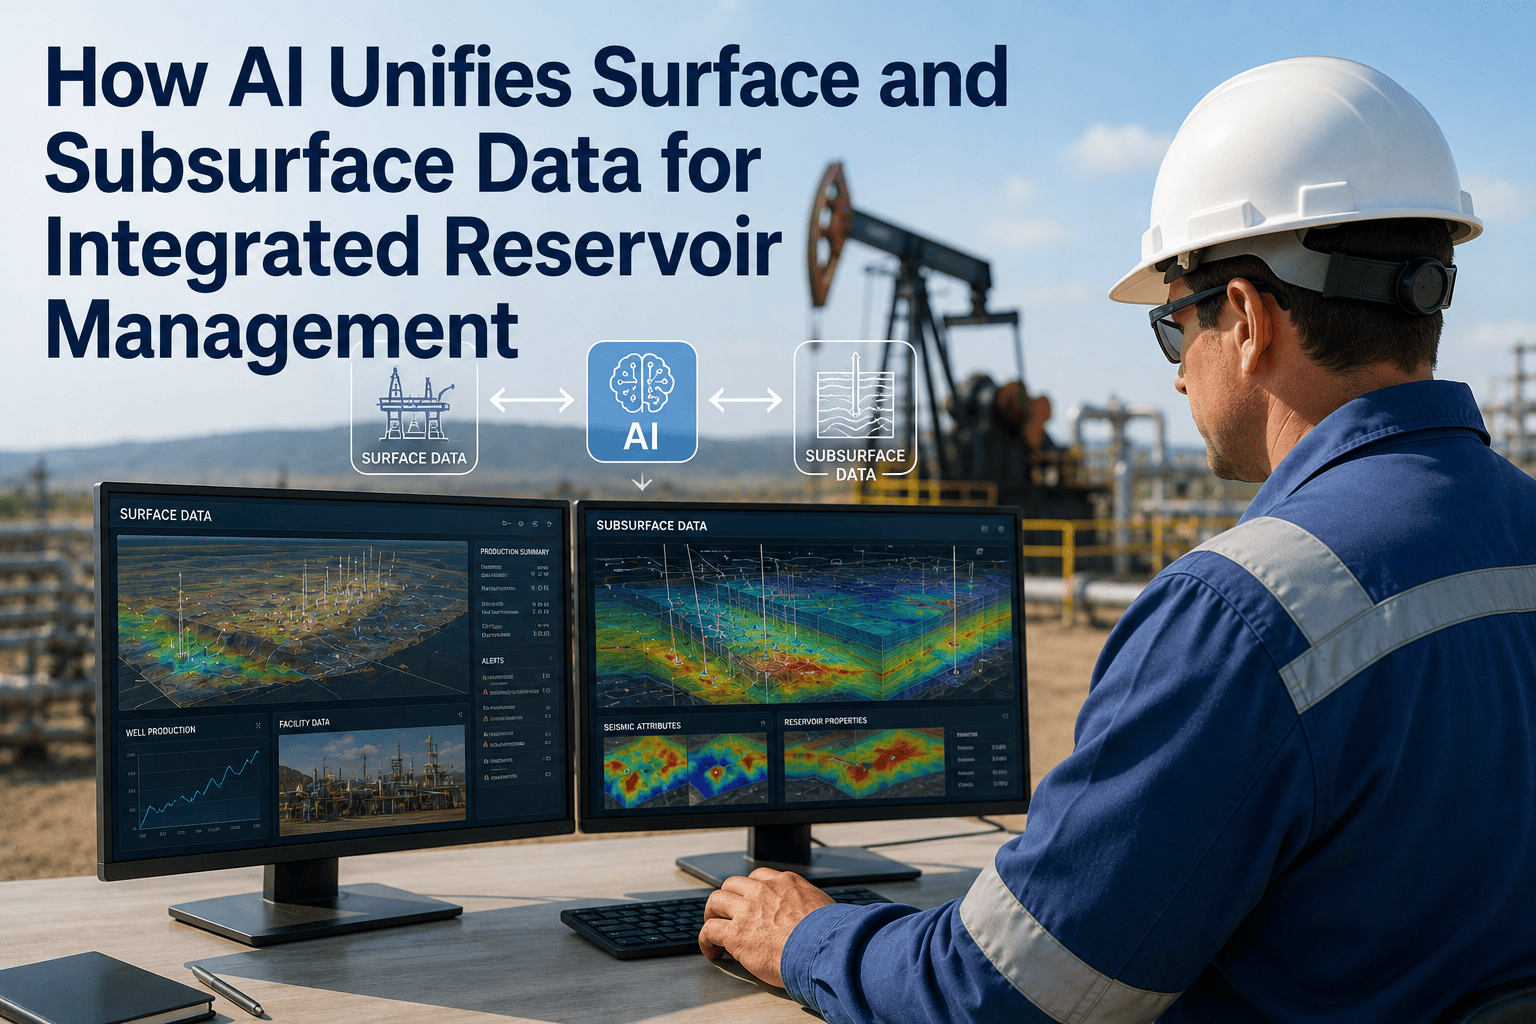
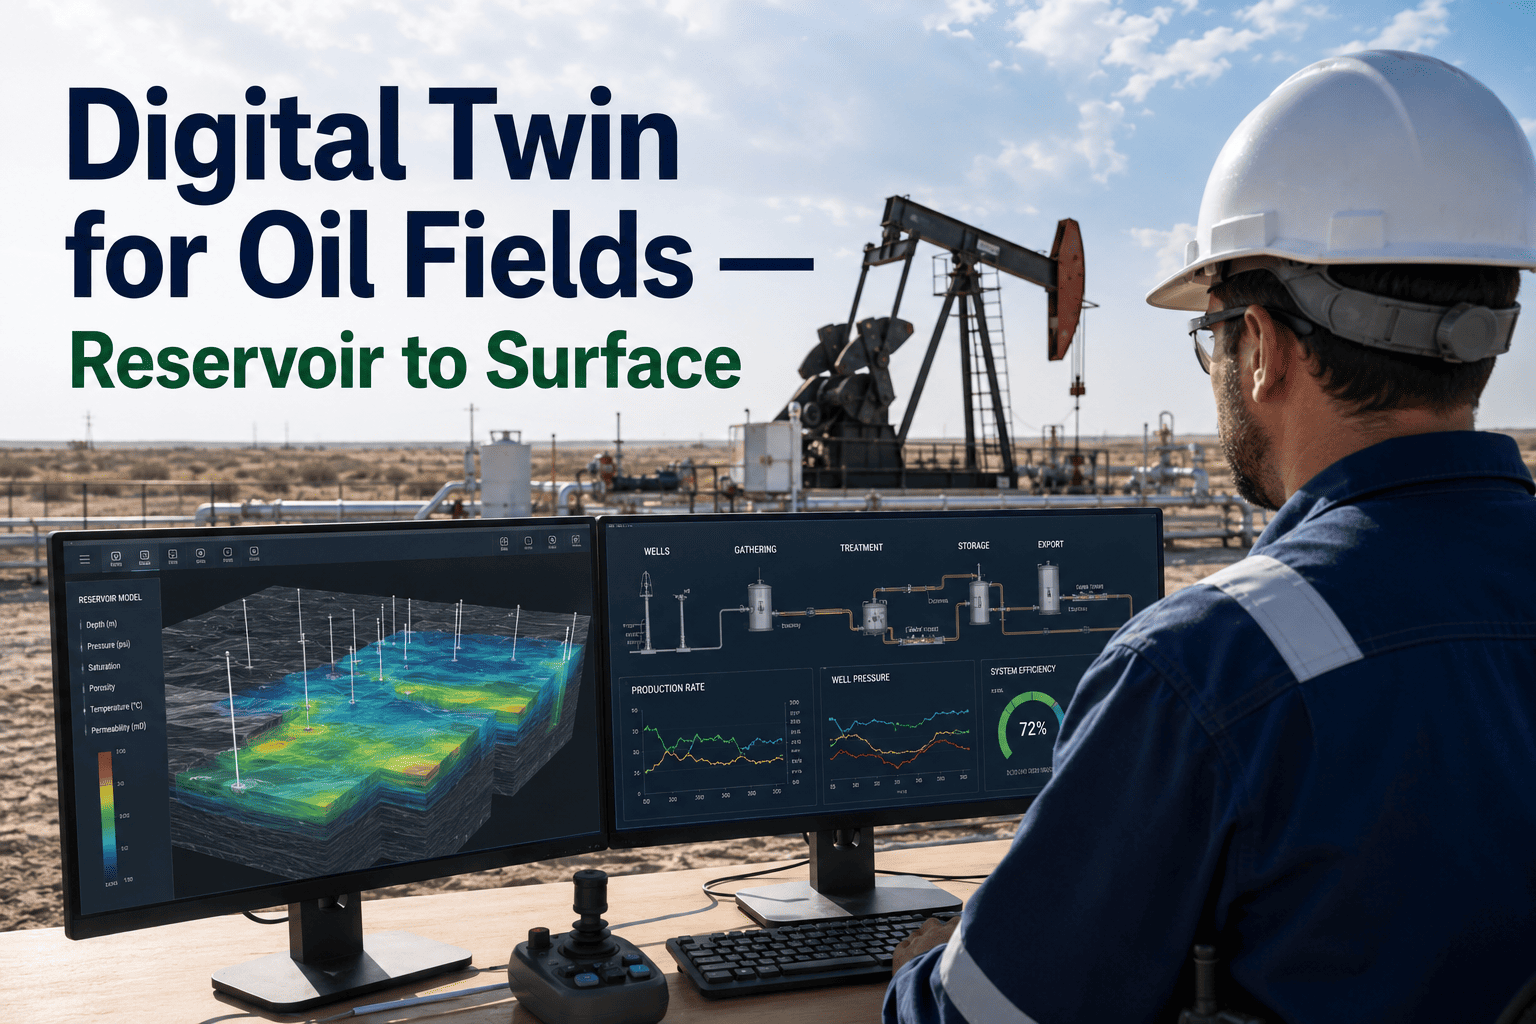
Two teams can sit on the same asset for years and still work from two different pictures of it. The subsurface team sees geology — porosity, permeability, pressure compartments, sweep efficiency — updated on a quarterly simulation cycle. The surface team sees production — choke settings, GORs, water cuts, injection rates — updated daily or in real time. Neither picture is wrong, but they drift apart the moment a well starts producing differently than the geological model predicted, and by the time the quarterly history match catches up, months of operating decisions have already been made against a stale subsurface picture. Integrated reservoir management exists to close that gap continuously instead of quarterly, and iFactory's platform is built specifically to keep surface and subsurface data talking to each other in real time.
Upstream Intelligence · Integrated Reservoir Management
Stop Managing Two Separate Pictures of the Same Reservoir
iFactory connects surface production data and subsurface geological models into one continuously updating system — so a change in water cut on Monday reshapes the reservoir forecast by Tuesday instead of next quarter.
The Structural Problem
Why Surface and Subsurface Data Live in Different Worlds
The disconnect is not a technology failure so much as a historical accident of how the industry built its tools. Geological models were built by geoscientists using seismic and well-log software. Production data was captured by SCADA and historian systems built for operations engineers. The two toolchains matured on separate tracks for decades, and by the time operators tried to connect them, each side had its own file formats, its own update cadence, and its own team culture around what counted as validated data.
Subsurface Side
Static, Specialist-Dependent, Slow to Refresh
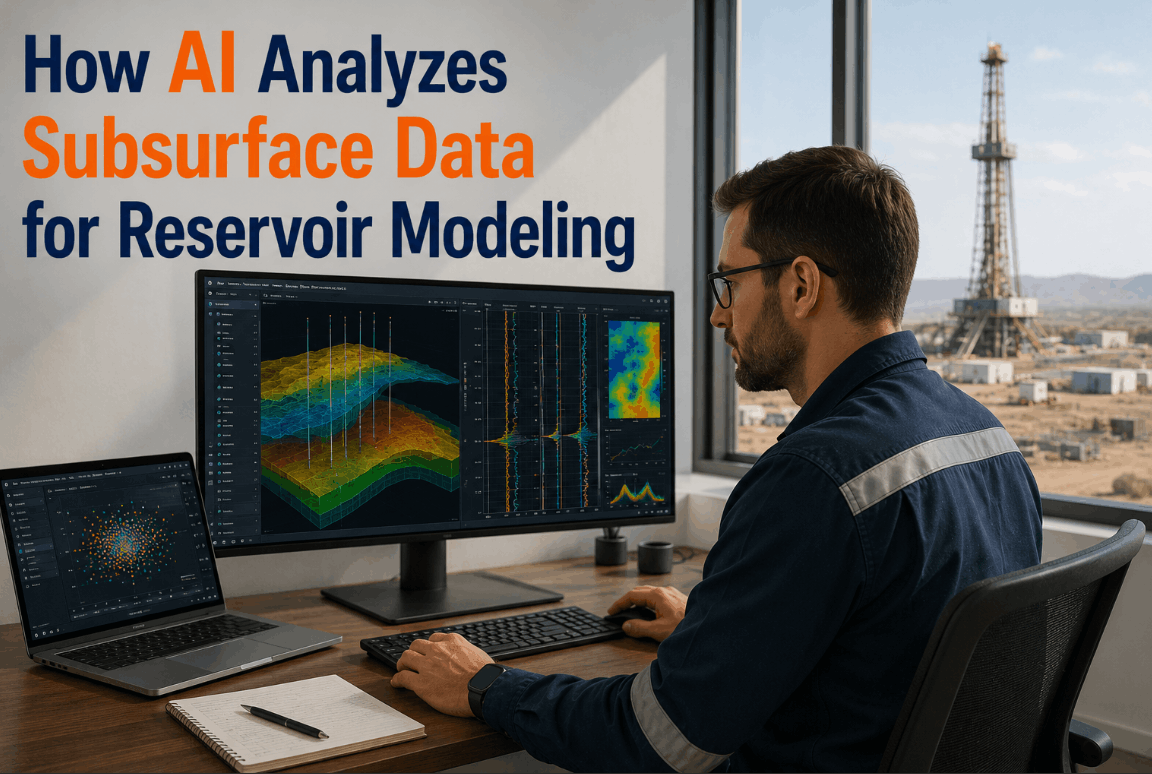
Geological models are built from seismic interpretation, well logs, and core samples, then history-matched against production data in a manual process that traditionally takes weeks per cycle. The model represents the reservoir's best understood state at the moment it was last touched — which for most operators is somewhere between one quarter and one year ago.
Surface Side
Dynamic, High-Frequency, Disconnected from Geology
Production and facilities data streams in continuously from wellhead sensors, chokes, separators, and pipeline meters. It is abundant and current, but on most assets it lives in a SCADA historian that has no automated pathway back into the geological model that is supposed to explain why the numbers are changing.
The cost of that gap shows up in two specific, expensive ways — sweep decisions made against outdated saturation maps, and pressure or connectivity anomalies that surface-side teams notice weeks before anyone thinks to check whether the subsurface model still explains them. Neither failure is dramatic on its own. A choke that stays open a few days longer than it should, an injector that keeps pushing water into a pattern that has already swept, a water-cut trend that gets logged but not escalated until the quarterly review — none of these look like an emergency in the moment. Added together across a field with dozens or hundreds of wells, they represent recoverable barrels that never get recovered, purely because the team making surface decisions did not have a subsurface picture current enough to catch the pattern while it still mattered.
The organizational habit that grows around this gap is often more damaging than the data lag itself. When reconciling surface and subsurface data is a manual, multi-week effort, teams naturally ration how often they do it — nobody re-runs a full history match every time a well's water cut ticks up, because the process is too expensive to run on every small signal. That rationing means the threshold for investigating a deviation quietly rises over time, and issues that would have been caught early in a continuously reconciled system instead wait for a scheduled review that may be months away. Integration does not just speed up the existing workflow — it changes what counts as worth investigating, because checking a signal against the model stops being expensive enough to ration.
One Model, Not Two
Every New Barrel of Production Data Should Update the Geology, Not Just the Spreadsheet
iFactory's integrated modeling layer feeds live production and injection data directly into your reservoir model's history-matching process, closing the loop that used to take a quarter in days.
How the Loop Actually Works
The Bidirectional Data Flow That Makes Integration Real
Integration is not a dashboard that shows both data types side by side — that is aggregation, not integration. A genuinely integrated system runs data in both directions continuously, with each side automatically refining the other rather than waiting for a scheduled review to reconcile them by hand.
01
Subsurface Model Sets the Baseline Forecast
The geological model — built from seismic, well logs, and core data — generates an initial forecast for how each well and injection pattern should perform, including expected pressure decline, water breakthrough timing, and sweep efficiency across the pattern.
02
Surface Data Streams In Continuously
Daily production rates, GORs, water cuts, choke positions, and injection volumes flow in from SCADA and downhole sensors as they are generated, rather than being batched into a periodic extract for manual review.
03
Automated History Matching Reconciles the Two
An ensemble-based calibration process compares the model's forecast against the incoming surface data and adjusts the subsurface parameters — permeability, transmissibility, interwell connectivity — that would explain the observed difference, without requiring an engineer to manually re-tune the simulation.
04
Updated Subsurface Model Feeds Back to Surface Decisions
The refined geological picture immediately informs surface-side decisions — which choke settings to adjust, which injector to throttle, which well is showing early signs of a thief zone — closing the loop instead of leaving it as a one-way report nobody acts on until the next review cycle.
05
Anomalies Get Flagged Before They Become Downtime
Because the reconciliation is continuous rather than quarterly, a pressure deviation that would have taken months to surface in a scheduled review gets flagged automatically, often while it is still a small discrepancy rather than a confirmed production problem.
What Integration Is Worth
The Measurable Impact of Closing the Loop
Operators who have moved from siloed, batch-cycle reservoir management to a continuously integrated model report gains across the same handful of metrics, consistently enough that these numbers now show up across multiple independent case studies rather than isolated pilot results.
75%
Engineer productivity gain on full reservoir model reviews
Reported from an integrated AI reservoir visualization deployment
80%+
Reduction in forecasting cycle time with integrated AI workflows
Across shale and unconventional production programs
Weeks
Earlier detection of pressure anomalies versus quarterly review
Continuous surface-to-subsurface reconciliation
10x
Faster history-matching cycles versus manual full-physics workflows
Automated ensemble Kalman filter assimilation
Batch Cycle vs. Continuous Loop
What Actually Changes When the Loop Closes
| Workflow Element | Siloed, Batch-Cycle Approach | Integrated, Continuous Approach |
| History matching |
Manual parameter tuning, 4-12 weeks per cycle |
Automated ensemble calibration, runs continuously |
| Production data use |
Batched and reviewed on a quarterly schedule |
Streamed in and assimilated as it arrives |
| Anomaly detection |
Surfaces during scheduled model reviews |
Flagged automatically against live model deviation |
| Sweep and injection decisions |
Made against a model that may be one quarter stale |
Made against a model updated within the last day |
| Team coordination |
Subsurface and surface teams reconcile manually |
Shared model both teams see and act on together |
| Scenario testing |
Full-physics run per scenario, days to weeks each |
Proxy model evaluates multiple scenarios overnight |
The pattern across every row in that table is the same one — not a different technology bolted onto the old workflow, but a different tempo. Nothing about the underlying physics of history matching changes; what changes is how often the model gets to learn from what the reservoir is actually doing, and a model that learns weekly makes meaningfully better recommendations than one that learns quarterly, purely because it has more chances to catch itself being wrong.
What Feeds the Integrated Model
Six Data Streams the System Reconciles Continuously
A genuinely integrated model has to ingest and cross-correlate data types that carry very different spatial resolution, update frequency, and physical meaning. Getting the reconciliation right across all six is what separates a real integration layer from a dashboard that just displays two data sets next to each other.
Seismic and Structural Data
Establishes the baseline geological framework — faults, horizons, and fluid contact depths — that the rest of the model is built on, refreshed as new surveys or reprocessing become available.
Well Log and Core Data
Populates the model with petrophysical properties — porosity, permeability, lithofacies — at the specific wellbore locations where physical measurements exist.
Pressure Transient and Well Test Data
Provides dynamic characterization of reservoir boundaries and connectivity, cross-validated against the static geological model to flag inconsistencies.
Production and Injection History
The highest-frequency data stream in the system — daily rates, water cuts, and GORs that drive the continuous history-matching process rather than sitting in a quarterly report.
Downhole and Fiber-Optic Sensor Feeds
Permanent gauges and distributed sensing stream continuous pressure and temperature data that can reveal fluid movement or channeling long before it shows up in surface production numbers.
Surface Facilities and SCADA Data
Choke positions, separator readings, and pipeline meter data close the loop back to the physical operating decisions the integrated model is meant to inform.
Where the Loop Matters Most
Asset Types Where Integration Delivers the Fastest Payback
Every producing asset benefits from closing the surface-subsurface gap, but the payback shows up fastest in operations where the reservoir behavior is complex enough, or the well count high enough, that manual reconciliation was already falling behind before AI ever entered the conversation. The common thread across the categories below is not asset type so much as decision frequency — fields where sweep, injection, or completion decisions get made often enough that a stale model actively costs money every time it goes unnoticed, rather than fields where a quarterly review cadence was already roughly matched to how often decisions actually needed to change.
Mature Waterfloods
Interwell connectivity shifts over the life of a waterflood, and integrated monitoring catches thief zones and conformance issues while there is still sweep efficiency left to recover.
Shale and Unconventional Programs
High well counts and fast production decline make manual, well-by-well history matching impractical at scale, which is exactly the workload continuous integration is built to absorb.
Deepwater and Offshore Developments
High development cost per well raises the stakes on every sweep and injection decision, making the earlier anomaly detection from continuous integration disproportionately valuable.
Enhanced Oil Recovery Operations
EOR programs depend on tightly matched injection and production patterns, and a subsurface model that lags surface reality by a quarter directly costs recovery efficiency.
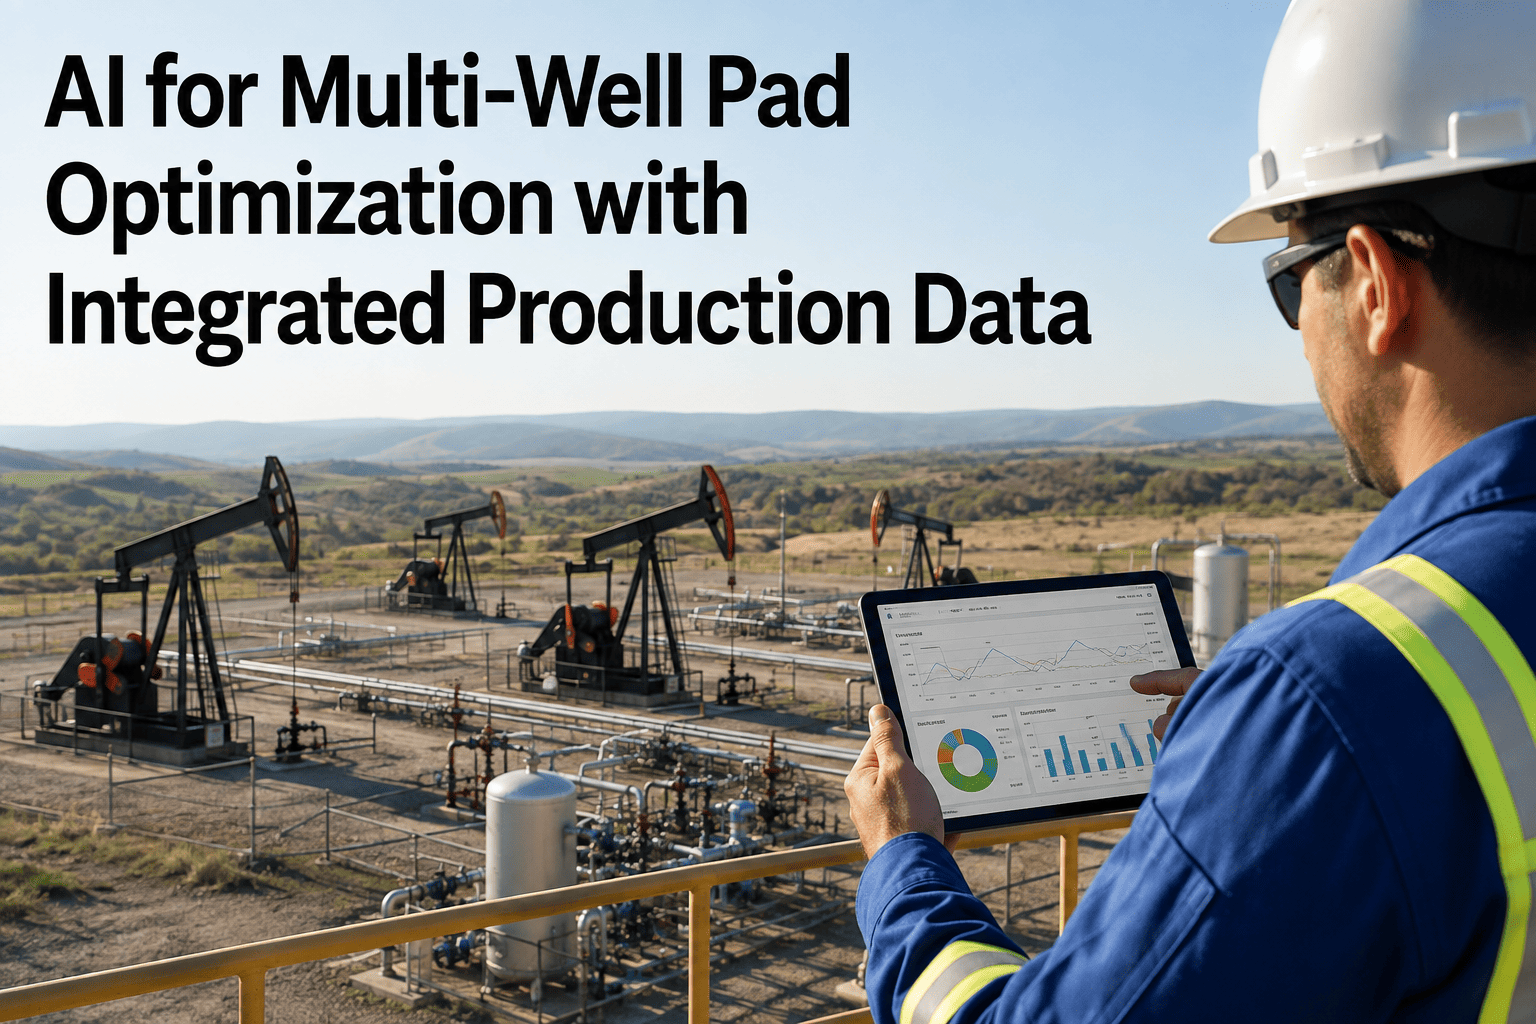
Multi-Well Pad Developments
Interference between closely spaced wells is a surface-visible pattern that only makes sense once it is reconciled against the subsurface connectivity model explaining it.
Brownfield Redevelopment
Legacy fields often carry decades of disconnected historical data across formats, and integration gives redevelopment teams one coherent model to plan infill drilling against.
Common Questions
Frequently Asked Questions
Does integrated reservoir management replace our existing reservoir simulation software?
No — an integrated modeling layer works alongside full-physics simulators like Eclipse or CMG rather than replacing them. Full-physics simulation remains the standard for development planning, reserves estimation, and the rigorous scenario work those decisions require. What the integration layer adds is a fast, continuously updating proxy model that ingests live surface and subsurface data between simulation cycles, so engineers are not operating blind on a stale forecast for the months between full simulation runs. The proxy model can also generate the calibrated parameter sets that make the next full-physics run start from a far more accurate baseline.
Talk to support to see how this fits alongside the specific simulation software your team already uses.
How much historical data do we need before the integrated model becomes accurate enough to act on?
The minimum requirement is production and injection history for the wells being modeled, since that dynamic data drives the history-matching process that calibrates the model to your specific reservoir. Seismic data, well logs, and downhole sensor feeds are not strictly required to start, but each one significantly improves accuracy and shortens the time to reach operational confidence. Assets with a longer, cleaner production history typically reach usable accuracy faster than greenfield developments still building their initial dynamic dataset, simply because there is more historical signal for the calibration process to learn from.
What happens when surface data and the subsurface model genuinely disagree?
A meaningful, sustained disagreement between what the surface data shows and what the subsurface model predicts is treated as a signal worth investigating rather than something the system silently smooths over. Small, expected variance gets absorbed into the routine calibration adjustment. A larger or persistent deviation gets flagged as an anomaly, because it often indicates something the original geological model did not capture — an unmapped fault, an unexpected connectivity path, or a mechanical issue like a failing downhole gauge. That flag is the entire point of continuous reconciliation: catching the disagreement while it is still a data discrepancy, well before it becomes a production problem discovered months later.
Can this work across a portfolio of assets with different reservoir types and data maturity levels?
Yes, though each asset's integration deployment is calibrated to what data actually exists for it rather than forcing every field through an identical template. A mature waterflood with decades of production history and multiple 4D seismic surveys will start from a richer baseline than a newer unconventional asset still accumulating its production track record, and the platform is built to work with whatever data maturity level each asset brings rather than requiring a uniform starting point across the portfolio. Portfolio-wide visibility becomes genuinely useful once several assets are integrated, because it lets reservoir management teams compare performance and connectivity patterns across fields using a consistent modeling approach instead of comparing outputs from several disconnected legacy workflows.
What is a realistic timeline to get an integrated model live on a first asset?
Most deployments follow a phased path — an initial phase connecting to your existing production data historian and any available geological model outputs, a calibration phase where the automated history-matching process tunes itself against your asset's real production behavior, and a rollout phase where surface teams and reservoir engineers begin actively using the shared, continuously updated model in daily decisions. Assets with clean, well-organized historical data typically move through calibration faster than those where data first needs to be consolidated from multiple disconnected legacy systems.
Book a demo to walk through a realistic timeline against your specific asset and data environment.
One Model, Updated Continuously
Give Your Reservoir Team the Picture That Matches What the Field Is Actually Doing
iFactory unifies surface production data and subsurface geological models into a single continuously updating system — so sweep decisions, injection strategy, and anomaly detection all run against the same current reality.