A production engineer covering 320 wells across two mature basins used to start every morning the same way — one login for SCADA trend screens, a second for the historian export, a third for the well test spreadsheet a pumper had emailed the night before, and a fourth for the production accounting system that wouldn't reconcile with any of the other three until the following week. Underperforming wells sat unflagged for days because no single view showed pressure, allocation, and test data together, and by the time a well's decline pattern became obvious in the monthly report, the intervention window that would have caught it cheaply had already closed. This is the exact starting condition of the operator in this case study, and it is the condition most mid-cap upstream operators are still working in today. iFactory unified this operator's SCADA, historian, and well test data into a single AI-driven view, and the fifteen percent production uplift that followed is the subject of this case study.
Upstream Intelligence · Case Study
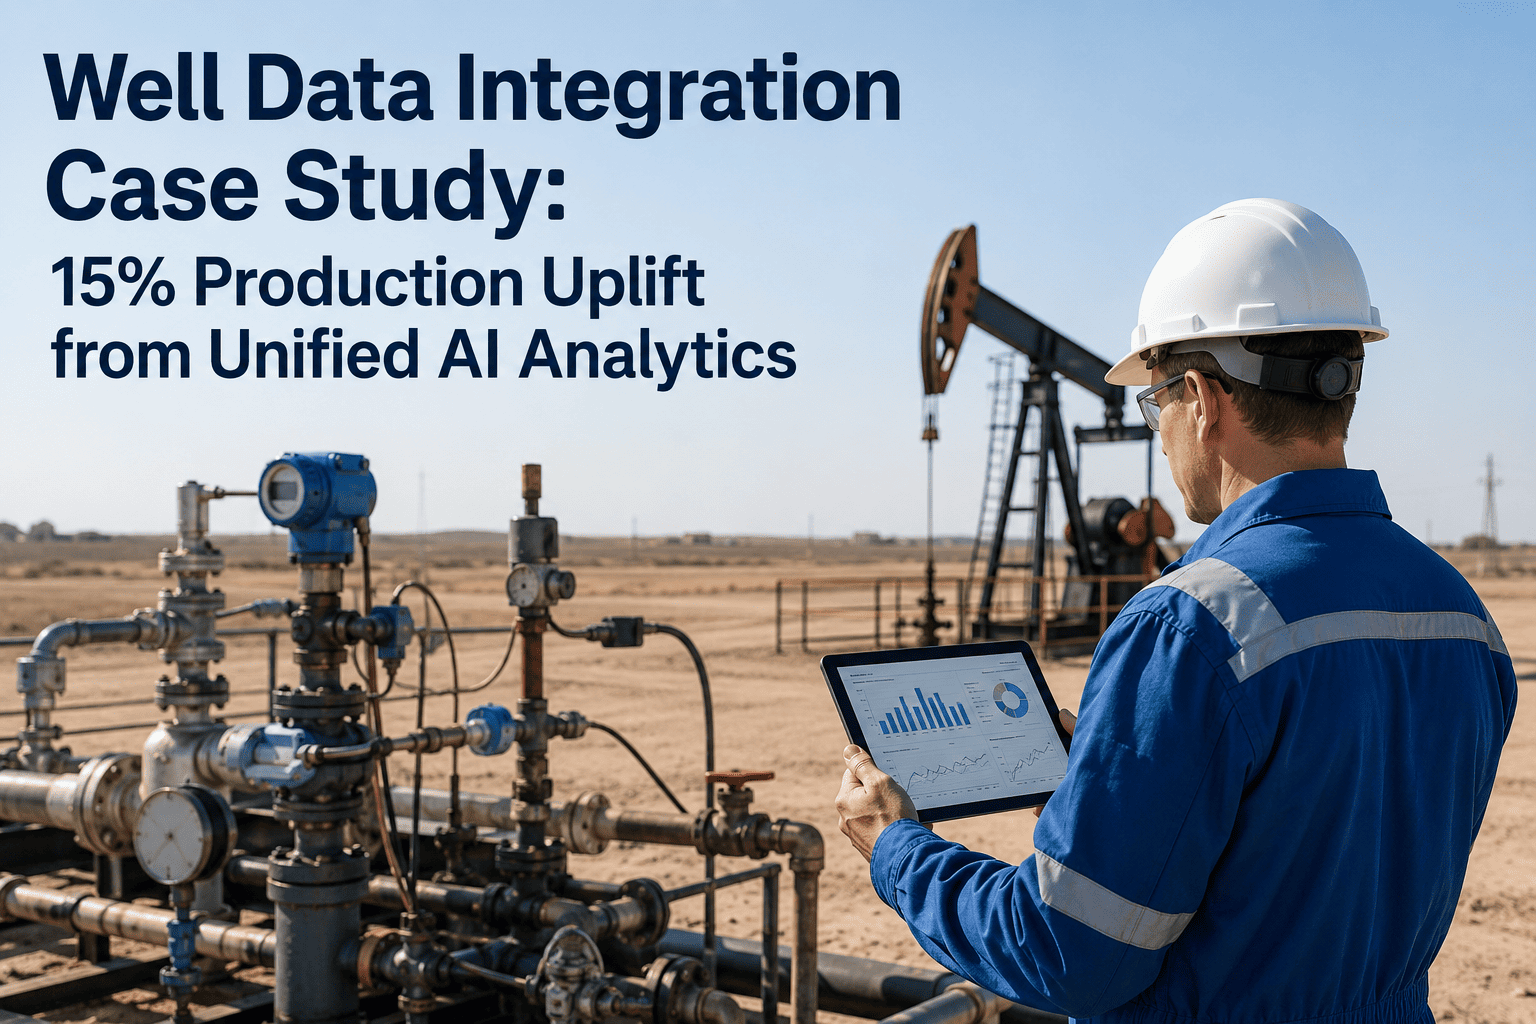
Well Data Integration Case Study: 15% Production Uplift from Unified AI Analytics
SCADA, historian, and well test data lived in three separate systems that never talked to each other. Once they were unified into a single AI-driven analytics layer, this 320-well operator identified underperformance faster, corrected lift settings sooner, and added $8.2M in annual revenue without drilling a single new well.
The Operation
Field Snapshot
The results in this case study come from a composite mid-cap upstream operator built from deployment patterns typical of multi-pad operations in mature domestic basins, reflecting the scale and starting conditions most operators running several hundred wells will recognize.
320
Wells across two basins
2,400 bopd
Baseline gross production
4
Disconnected data systems before integration
6 months
From engagement to full-field rollout
The Baseline Problem
Four Systems, Four Owners, No Shared View
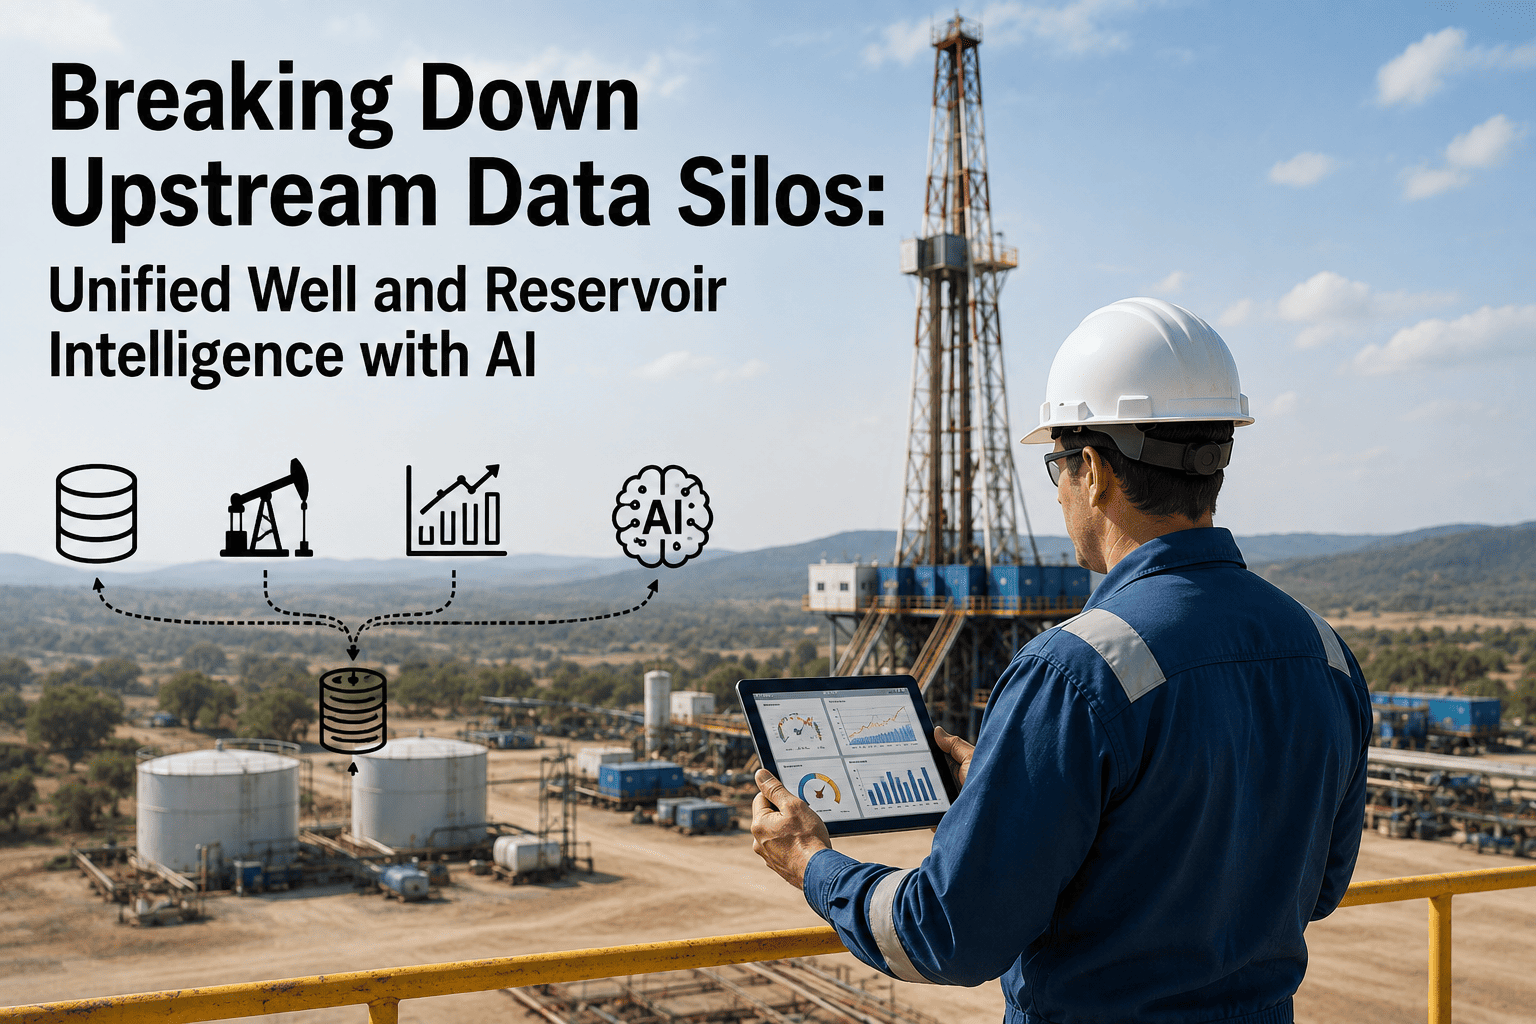
Before integration, the operator's production data existed in the same fragmented state common across the industry — real-time readings, historical trends, periodic tests, and accounting figures each accurate on their own, but never reconciled against each other in time to change a decision. Industry research on upstream data silos puts engineers spending 40-60% of their time gathering data rather than analyzing it, and this operator's team was no exception.
SCADA
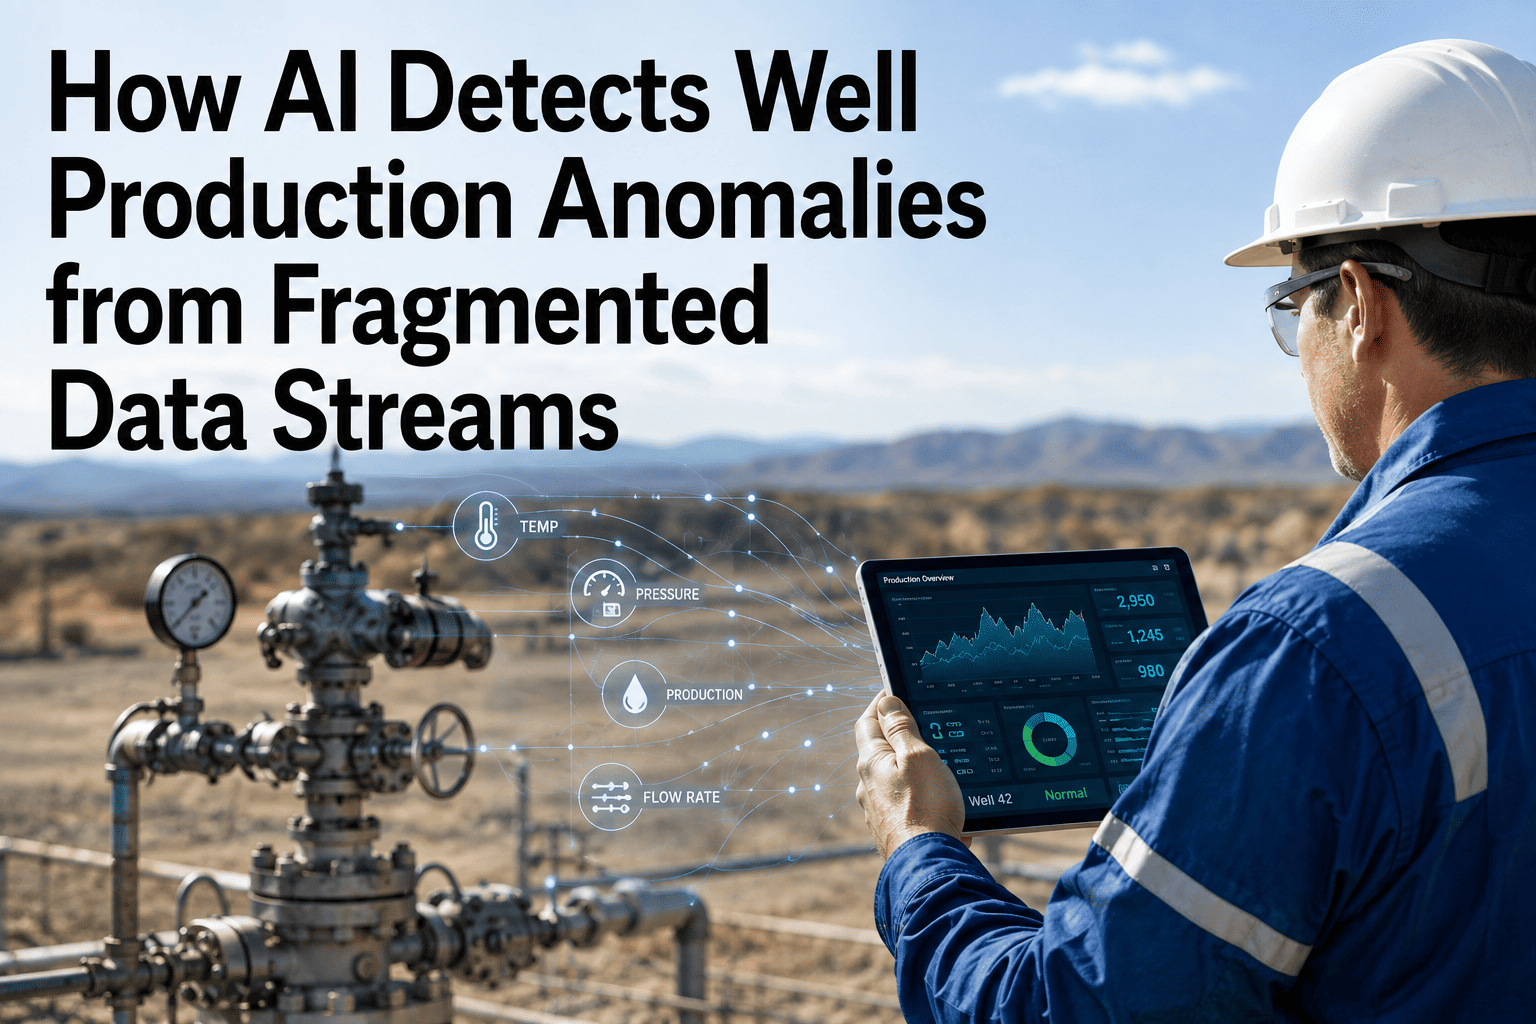
Real-time tubing pressure, casing pressure, and choke position streamed continuously but lived in a control-room screen nobody outside operations checked daily.
Historian
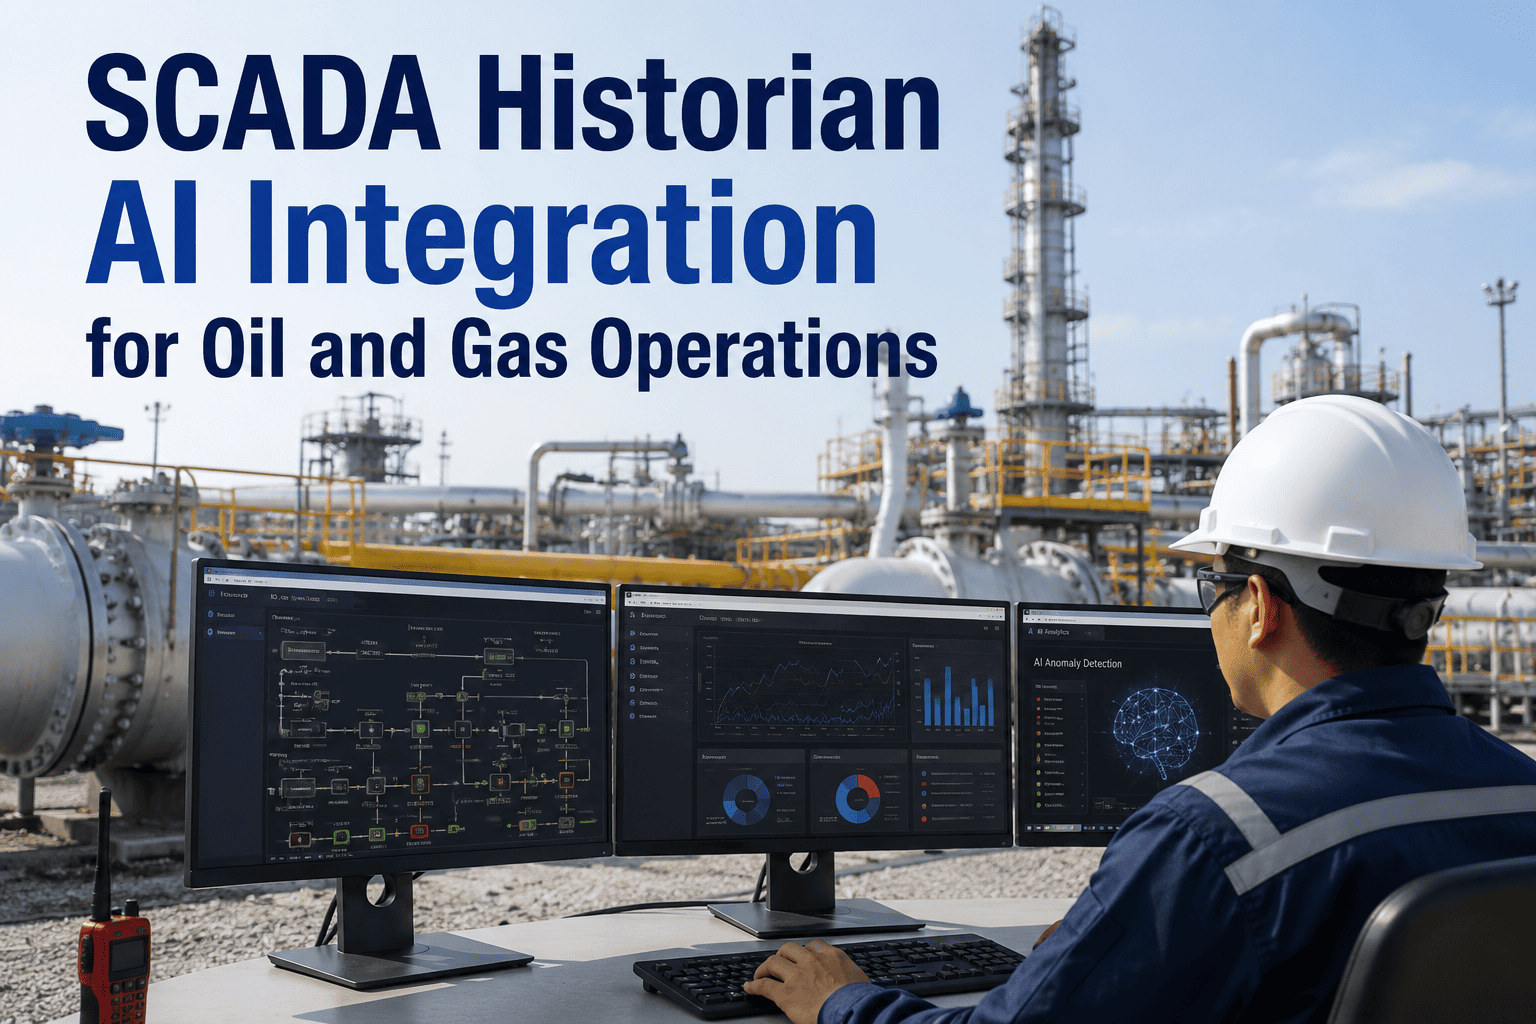
Years of compressed trend data sat archived and queryable only manually, usually after a well had already gone down.
Well Test Data
Periodic separator tests landed in spreadsheets emailed between pumpers and engineers, often days out of date by the time they were reviewed.
Production Accounting
Allocation and revenue figures reconciled on a delayed cycle, meaning the financial impact of a declining well showed up weeks after the decline started.
The Fix Was Never the Algorithm
It Was Getting Every System to Agree on What Each Well Was Actually Doing
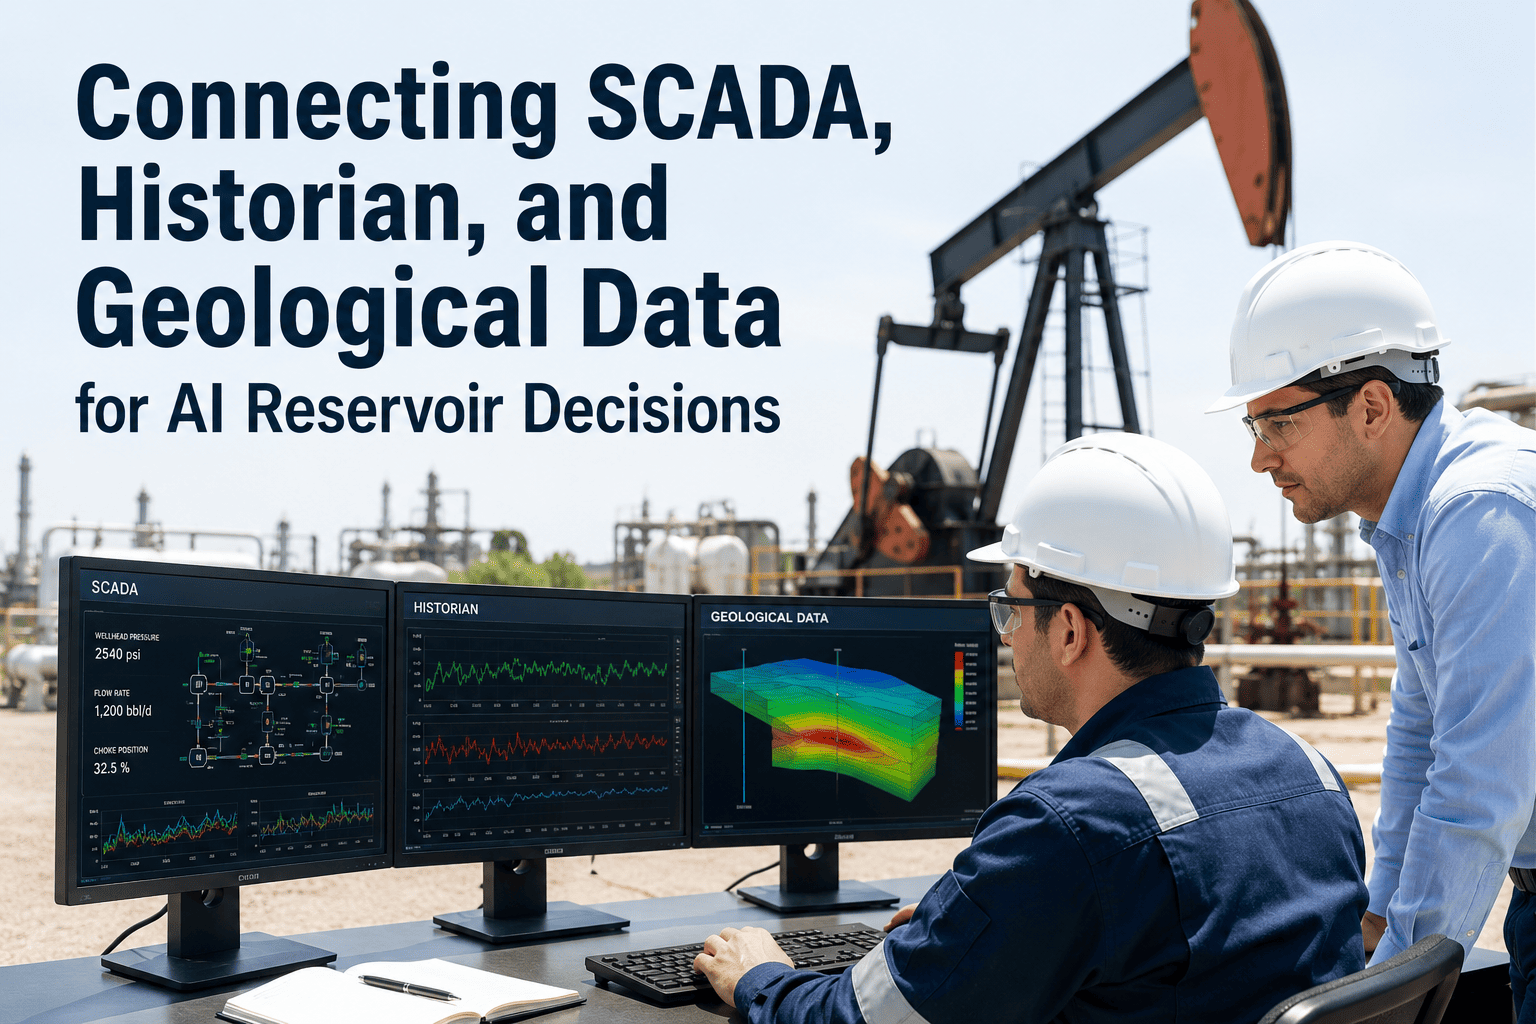
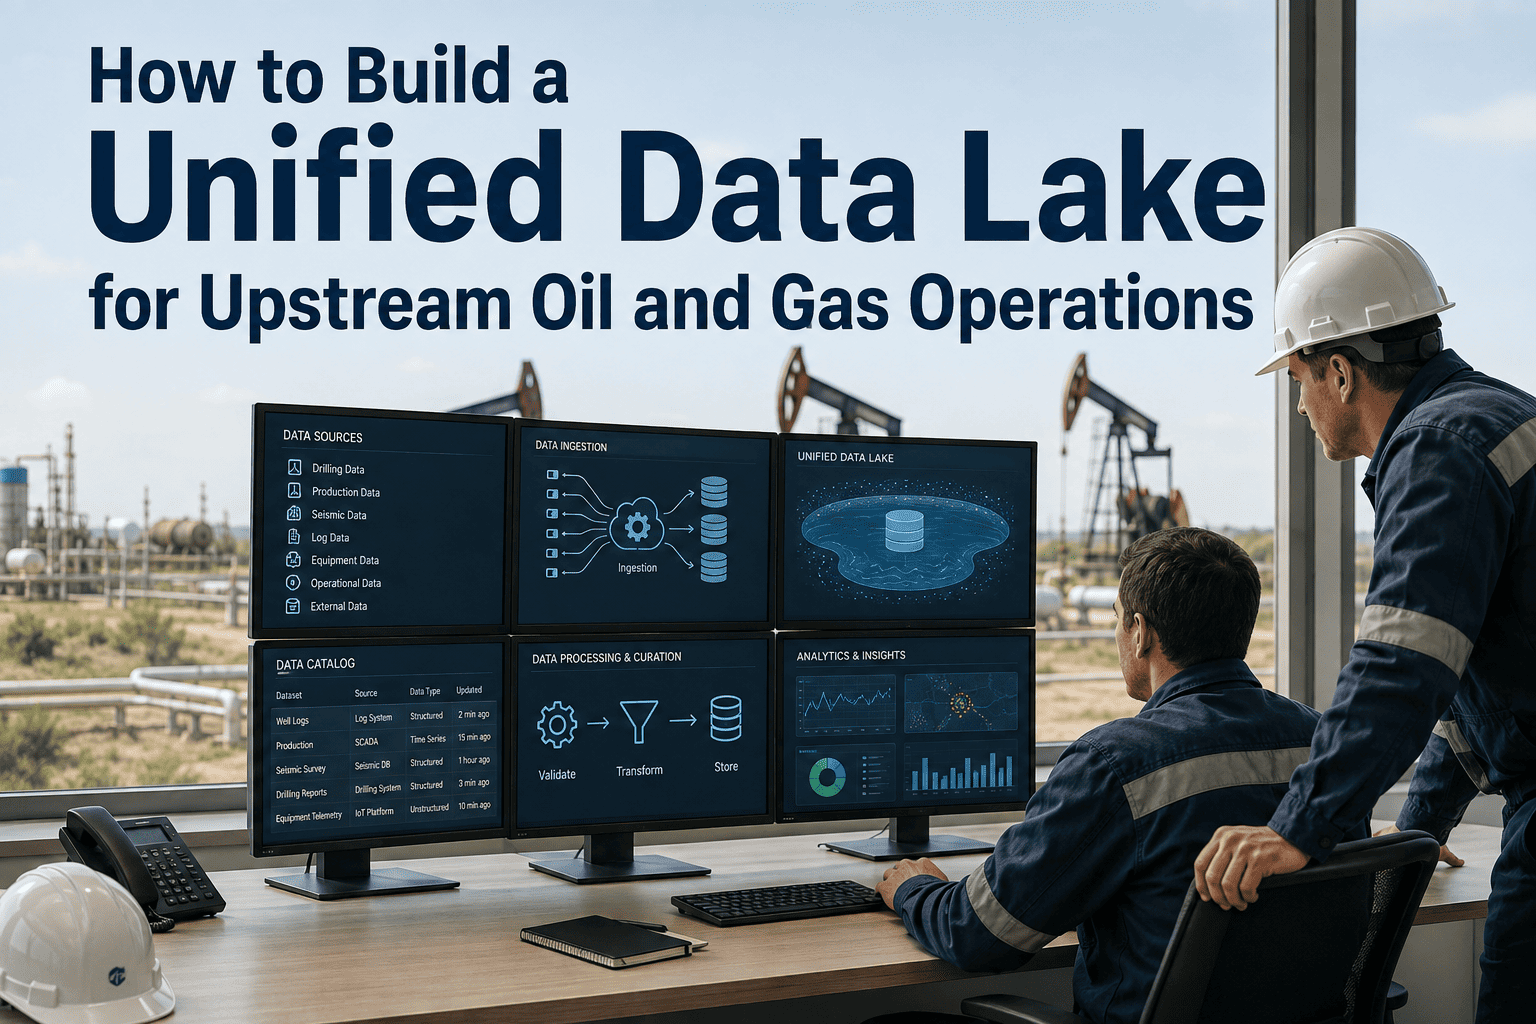
iFactory connects SCADA, historian, and well test systems into one AI-driven view before recommending a single optimization change, the same approach behind this operator's result.
What Changed
Before Integration vs. After Integration
The table below reflects the operating reality at each stage of the review cycle — from first indication that a well is underperforming through to a corrective action being taken in the field.
| Review Stage | Before Integration | After Integration |
| Underperformance detection |
Monthly report review, days to weeks delayed |
Continuous AI monitoring against expected decline curve |
| Data assembly for diagnosis |
Manual pull across four separate systems |
Unified per-well view assembled automatically |
| Root cause identification |
Engineer judgment against partial data |
AI-ranked probable cause: reservoir, lift, or mechanical |
| Lift optimization decisions |
Reactive, driven by complaint or major decline |
Proactive, driven by AI-flagged deviation from baseline |
| Allocation accuracy |
Periodic well tests, stale between tests |
Continuous virtual flow metering between tests |
| Intervention cycle time |
Days to weeks |
Same-shift to next-day |
The Results
Where the 15% Production Uplift Actually Came From
The uplift did not come from one dramatic fix — it came from three separate mechanisms that each closed a different gap the fragmented data had been hiding. Together they moved gross production from 2,400 bopd to a sustained 2,760 bopd, worth $8.2M in additional annual revenue at the operator's realized price.
01
Corrected Lift Optimization
Continuous allocation data revealed the operator had been over-lifting a subset of wells and under-lifting others based on stale test data — correcting the split alone recovered meaningful volume without a single workover.
02
Faster Underperformance Response
Wells that previously drifted below expected decline for weeks before anyone noticed were now flagged within a shift, cutting the average time-to-intervention from weeks to under a day.
03
Fewer Missed Mechanical Failures
Cross-referencing SCADA trend deviation against historian baselines surfaced early ESP and rod pump degradation that would previously have gone unnoticed until a full failure and unplanned downtime.
2,400 → 2,760
Gross bopd, before and after
$8.2M
Additional annual revenue
40-60% → <10%
Engineer time spent gathering vs. analyzing data
How It Rolled Out
Six Months from Engagement to Full-Field Rollout
Weeks 1-3
Data Layer Assessment
Mapping existing SCADA tags, historian archives, and well test formats against a standardized asset model before any integration work began.
Weeks 4-8
Pilot on a 40-Well Pad Cluster
Unified view stood up on a representative subset of wells to validate allocation accuracy and underperformance detection before wider commitment.
Weeks 9-16
Lift Optimization Model Tuning
AI recommendations for gas-lift and ESP settings compared against engineer judgment, with the model refined against real field response.
Weeks 17-22
Full-Field Rollout
All 320 wells brought onto the unified view, with the production team transitioning from monthly review cycles to continuous monitoring.
Weeks 23-26
Sustained Uplift Confirmed
The 15% production gain held steady across a full quarter, confirming the uplift was structural rather than a short-lived pilot effect.
From the Field
What the Production Team Noticed First
The clearest signal that the integration was working wasn't the production number — it was how differently the team's mornings started. Instead of opening four systems to reconstruct what happened overnight, the production engineer's first look of the day was a single ranked list of wells that had drifted from expected behavior, with the probable cause already attached. Interventions that used to wait for the next monthly review cycle started happening the same shift the deviation appeared, and the workover crew's prioritization list stopped being built from gut feel and started being built from a ranked, data-backed queue. That shift in how decisions got made, more than any single fix, is what turned a data integration project into a sustained production gain.
Why This Worked
Three Keys to Success
Started with a Pilot Cluster, Not the Whole Field
Validating allocation accuracy and detection logic against a 40-well subset caught tuning issues early, before they could undermine confidence at full scale.
Kept Existing Systems Instead of Replacing Them
SCADA, historian, and well test systems stayed in place — the integration layer read across them rather than forcing a disruptive data migration.
Measured Time-to-Intervention, Not Just Uplift
Tracking how fast the team responded to a flagged deviation, alongside the production number, showed the uplift was coming from a real process change.
Common Questions
Frequently Asked Questions
How long does a well data integration project like this typically take?
This operator went from initial engagement to full-field rollout across 320 wells in roughly six months, starting with a three-week data layer assessment and a pilot on a representative pad cluster before expanding. Smaller operations with fewer wells or simpler system landscapes can move faster, while operators with more fragmented legacy systems may need a longer assessment phase.
Book a demo to get a timeline estimate specific to your well count and existing systems.
Do we need to replace our existing SCADA and historian systems to do this?
No. The integration layer reads across existing SCADA, historian, and well test systems rather than replacing them, which is what kept this rollout from becoming a disruptive migration project. Your historian already holds years of valuable trend data — the work is building the AI layer that reads across it, not moving it somewhere new.
Where does most of a production uplift like this actually come from?
In this case, it came from three sources working together: correcting lift settings that had been set against stale allocation data, cutting the time between a well drifting off its decline curve and someone noticing, and catching early mechanical degradation before it became an unplanned failure. None of these required new wells or major capital — they came from acting faster and more accurately on data the operator already had.
How is this different from just building better dashboards on top of our existing data?
A dashboard still requires an engineer to notice a problem and decide what it means. This system continuously compares every well against its expected performance baseline and ranks deviations by probable cause, so the team's attention goes to the wells that need it rather than being spread evenly across a report nobody has time to read in full every day.
Can this approach work for an operator with fewer than 320 wells?
Yes — the underlying problem of fragmented SCADA, historian, and well test data shows up at almost any well count, and smaller operators often see the pilot phase move faster because there are fewer systems and stakeholders to align.
Talk to support about what a pilot cluster would look like for your specific field.
Your Data Is Already There. It Just Isn't Talking to Itself Yet.
See What a Unified View Would Show Across Your Wells
iFactory connects SCADA, historian, and well test data into one AI-driven view, the same foundation behind this operator's 15% production uplift.