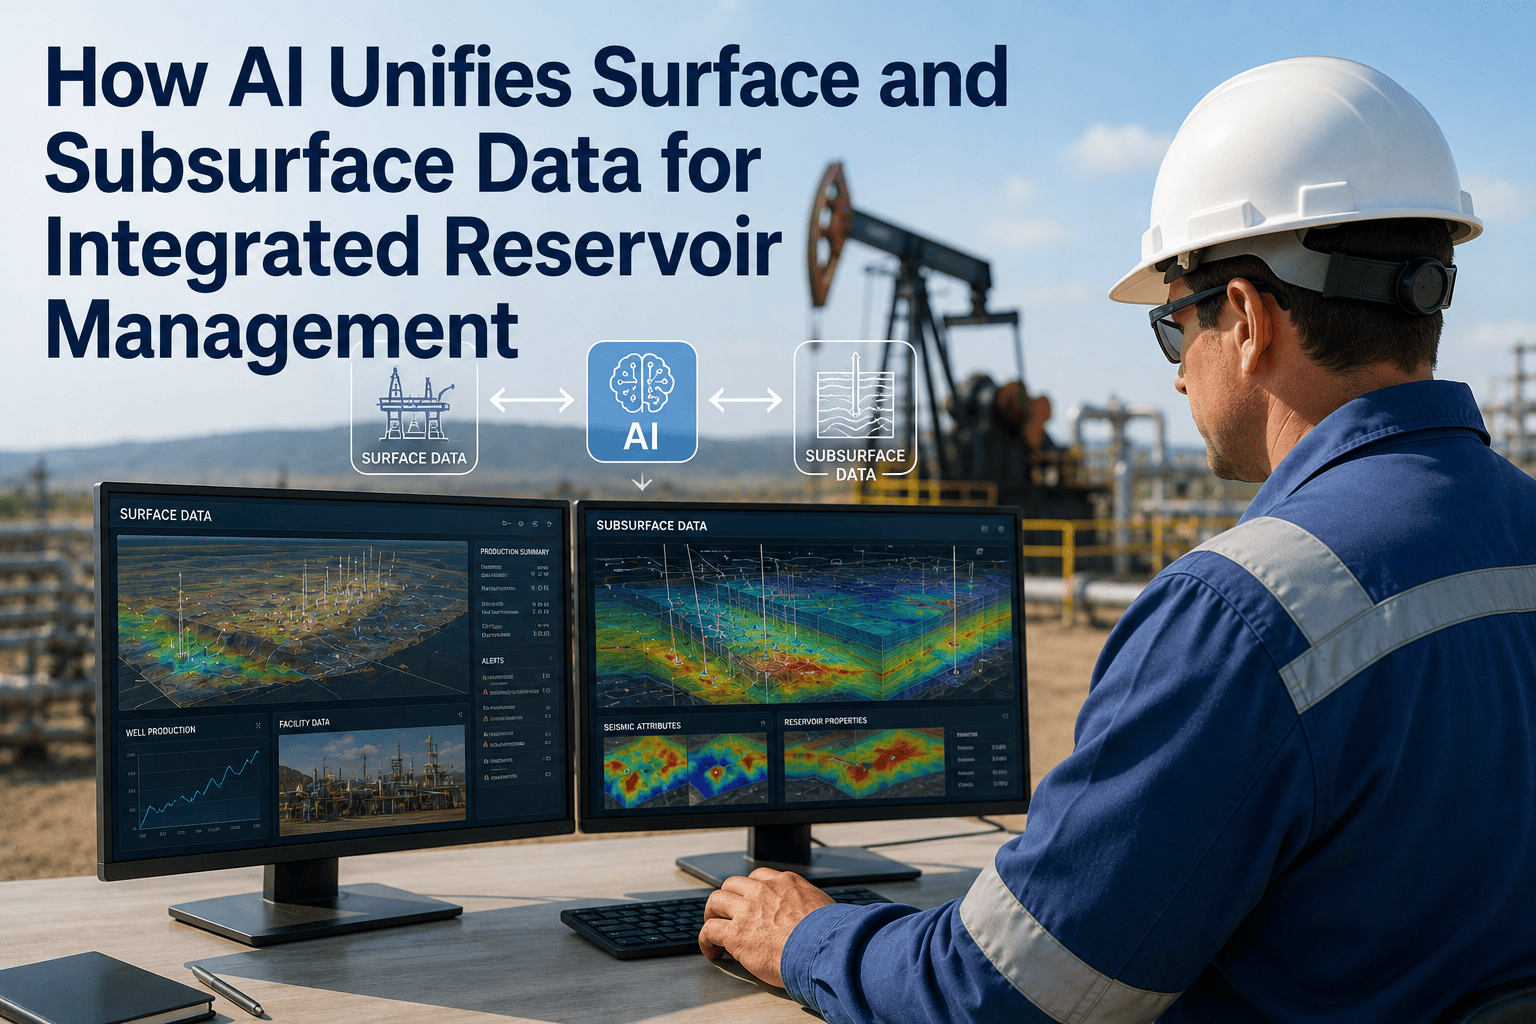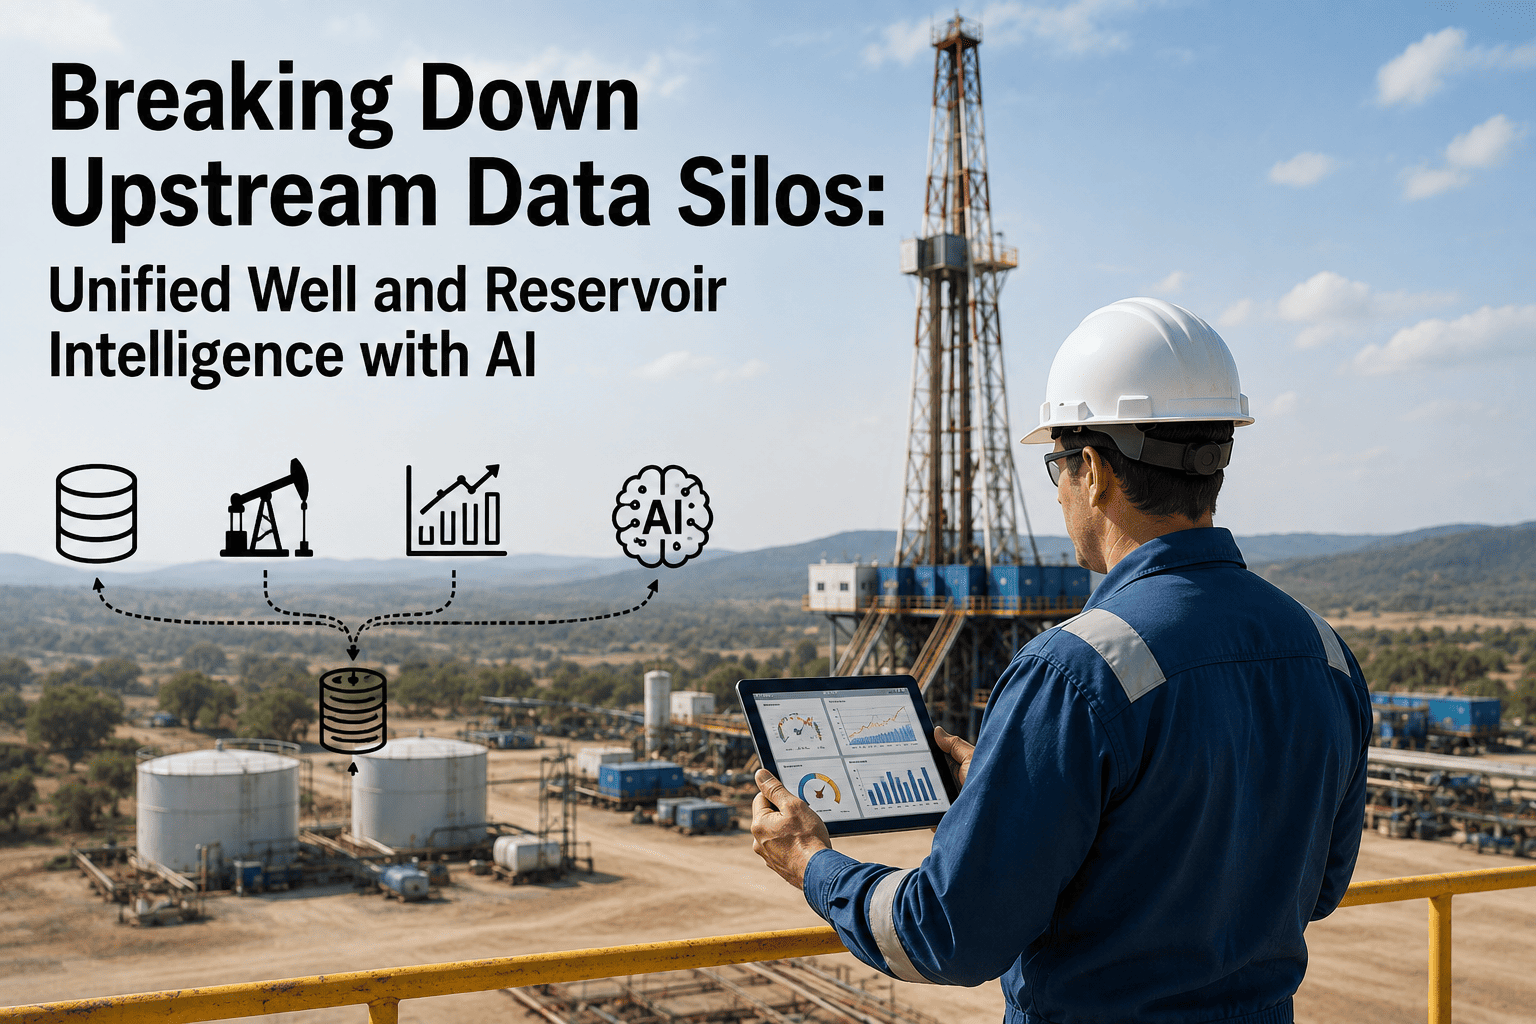
Most reservoir engineers can tell you exactly what a well is doing right now, and exactly what it did five years ago — but almost never on the same screen, in the same units, on the same timeline. SCADA feeds show live flow, pressure, and choke position. The historian holds years of compressed time-series history nobody has time to query by hand. The geological model sits in a separate interpretation package, updated a few times a year by an entirely different team. AI can only make a reservoir decision as good as the data it can actually see across all three sources at once, and most operators have never built that connection. Book a demo to see what your own reservoir data looks like once it's unified.
Upstream Intelligence
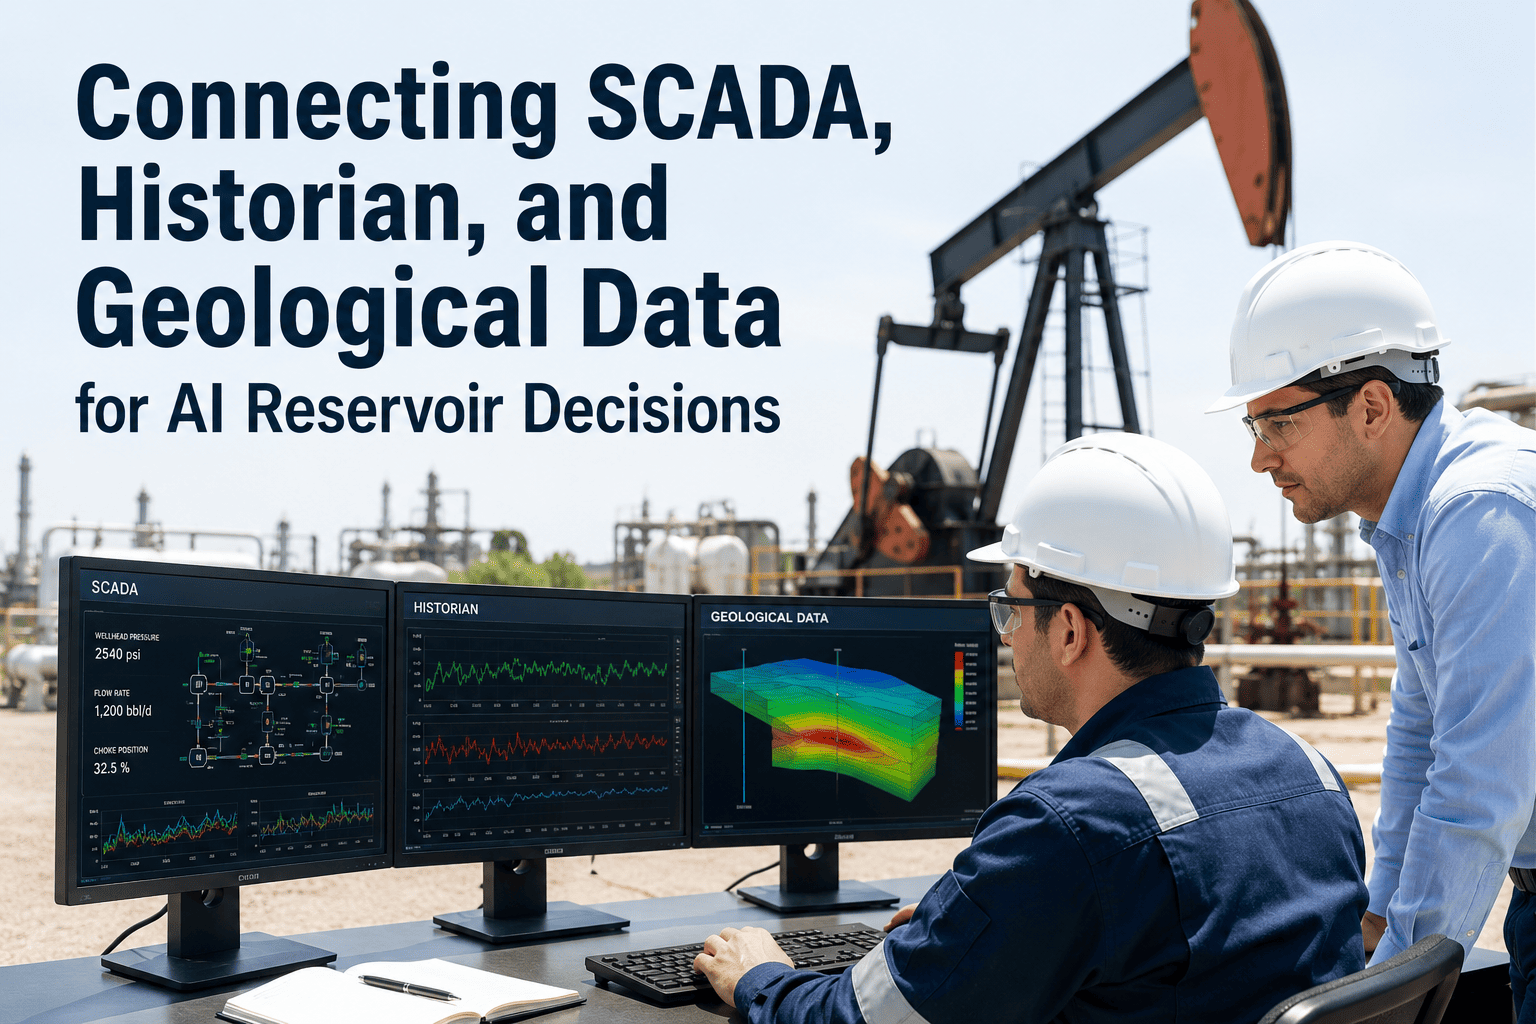
Connecting SCADA, Historian, and Geological Data for AI Reservoir Decisions
Real-time SCADA flow data, compressed historian trends, and static geological models rarely sit in the same place. Here's what changes when an AI layer reads all three as one dataset instead of three disconnected ones — and how to get there without replacing anything you already run.
Foundations
Why These Three Systems Almost Never Talk to Each Other
SCADA, historians, and geological modeling software were built by different vendors, for different teams, at different points in a field's life, and none of them were designed with the other two in mind. SCADA exists to move live measurements from the wellhead to a control room screen, refreshed every few seconds. The historian exists to archive that same stream efficiently, compressing years of readings into a queryable time series that engineers pull up when they need to see a trend. The geological model exists separately again — built from seismic interpretation, well logs, and core data, updated on a project cadence measured in months, not seconds. Each system does its own job well. The problem is that a reservoir decision rarely depends on just one of them. Diagnosing an unexpected pressure decline, for example, needs the live SCADA reading to confirm what's happening now, the historian trend to confirm whether this has happened before, and the geological model to confirm whether the decline lines up with a known compartment boundary or fault. Most operators still do that cross-referencing manually, engineer by engineer, spreadsheet by spreadsheet, which is slow enough that by the time the full picture is assembled, the decision window has often already closed.
The Three Data Layers
What Each System Actually Contributes to a Reservoir Decision
SCADA
Live wellhead pressure, flow rate, choke position, and tank levels, refreshed on a scan cycle of seconds to minutes. SCADA tells an AI model what is happening right now, which matters most for catching a developing problem before it shows up in a monthly production report.
Historian
Years of compressed time-series data — PI System, PHD, or IP.21 archives — that hold the trend behind the live reading. The historian is what lets an AI model tell the difference between a genuine anomaly and a pattern the well has shown every winter for the last six years.
Geological Model
Static structure built from seismic interpretation, well logs, and core analysis — reservoir compartments, fault boundaries, porosity, and permeability. This is what gives production data physical context, so a decline gets explained by geology instead of guessed at from a graph alone.
Integration Path
How the Three Data Layers Get Connected Into One AI-Ready Model
1
Map Existing Connectivity
Audit which SCADA tags, historian archives, and geological model exports already exist and which protocol each one speaks — OPC-UA, OPC-DA, WITSML, or a flat file export — before building any connection.
2
Establish a Common Well Identifier
Reconcile the naming conventions across all three systems into one well and asset ID scheme, since mismatched IDs are the single most common reason cross-system queries silently return incomplete results.
3
Stream SCADA and Historian Data Into a Unified Layer
Connect live SCADA tags and historian archives into a shared time-series layer without duplicating storage, so real-time readings and multi-year trends can be queried side by side instead of in two separate tools.
4
Link Static Geological Context to Every Well
Attach compartment, fault block, and reservoir zone attributes from the geological model to each well record, so production behavior can be automatically grouped and compared by geology rather than by well name alone.
5
Train and Validate the AI Layer on Unified Data
Calibrate models against field-specific production baselines that already reflect geology and history, then validate predictions against known events before rolling recommendations out to the reservoir team.
See Your Own Data Unified
Watch SCADA, Historian, and Geological Data Come Together Live
iFactory connects directly to your existing SCADA, PI System or equivalent historian, and geological model exports — no rip-and-replace required. Book a demo and we'll walk through what a unified view looks like for one of your actual fields.
Side-by-Side
How the Three Data Sources Differ in Practice
| Data Layer | Update Frequency | Granularity | Primary Use in AI Decisions |
|---|---|---|---|
| SCADA | Seconds to minutes | Point-in-time reading | Real-time anomaly detection |
| Historian | Continuous, compressed archive | Multi-year trend | Pattern recognition, baselining |
| Geological Model | Updated per project cycle | Reservoir-wide structure | Physical context for production behavior |
| Production Database | Daily to monthly | Allocated volumes | Economic and allocation validation |
What Changes
What an AI Model Can Do Once It Sees All Three Layers Together
Faster Root-Cause Diagnosis
A pressure drop gets checked automatically against historical trend and geological compartment boundaries in one pass, instead of an engineer pulling three separate reports to confirm the same thing manually.
Fewer False Alarms
Historian context lets the AI distinguish a genuine anomaly from a recurring seasonal or operational pattern the well has always shown, cutting down on alerts that engineers learn to ignore over time.
Geology-Aware Production Forecasting
Forecasts calibrated against compartment-level geology rather than a generic type curve produce tighter prediction bands, which matters most for wells with unusual fault-block behavior.
Cross-Well Comparison by Geology, Not Just Field
Reservoir Compartment Grouping
Wells sharing the same fault block or reservoir zone can be automatically grouped and compared, surfacing patterns that would otherwise stay hidden across a field-wide well list.
Applied Example
A Pressure Decline That Three Disconnected Systems Missed
A mid-size upstream operator running a mature waterflood noticed a gradual pressure decline across a cluster of producing wells over several months, visible in the SCADA readings but not flagged by any alarm, since each individual reading stayed within normal operating range. Engineers reviewing the historian trend separately noticed the decline was steeper than the field's historical pattern, but without geological context, the working theory was simple reservoir depletion. Once SCADA, historian, and geological model data were connected into one view, the pattern lined up cleanly with a known fault compartment boundary — the affected wells all sat on one side of a sealing fault that was compartmentalizing pressure support from the injectors on the other side. The operator adjusted injection allocation to rebalance pressure support across the compartment rather than drilling an unnecessary infill well, avoiding a multi-million dollar decision built on an incomplete picture. The lesson that generalizes: production data alone tells you something changed, but only geology tells you why, and only history tells you whether it matters.
"
Engineers don't lack data in most fields I've worked — they lack a way to see three years of history and this morning's SCADA reading and the fault map all at the same time. Once that connection exists, half the diagnostic meetings I used to sit through simply stop happening, because the answer is already sitting in the model before anyone has to ask the question.
Priya Ravindran
Reservoir Engineering Advisor · 14 years across mature waterflood and unconventional asset teams
Warning Signs
Signs Your Reservoir Data Is Still Siloed
Diagnosis Meetings Take Days, Not Minutes
If confirming a single anomaly requires pulling reports from SCADA, the historian, and the geology team separately before anyone can agree on a cause, the data is siloed even if every system individually works fine.
Alerts Get Ignored More Than They Get Acted On
A rising rate of dismissed alarms usually means the alerting logic has no historical or geological context, so it treats normal recurring patterns the same as genuine problems.
Forecasts Consistently Miss on Specific Wells
Type-curve forecasts that repeatedly miss on the same subset of wells often point to unaccounted-for geological compartmentalization that a generic decline model was never built to see.
Well Interventions Are Decided Without a Fault Map Check
If workover or infill decisions are routinely made from production trend alone, without a routine cross-check against the geological model, the field is exposed to avoidable capital risk.
Connectivity Reference
Common Systems and How They Typically Connect
| System Type | Common Platforms | Typical Protocol | Integration Effort |
|---|---|---|---|
| SCADA | Wonderware, Ignition, iFIX | OPC-UA / OPC-DA | Low to moderate |
| Historian | AVEVA PI System, Honeywell PHD, AspenTech IP.21 | Native connector / REST API | Low — most support open connectors |
| Geological Model | Petrel, Landmark, Kingdom | Structured export / WITSML | Moderate — depends on export cadence |
| Production Database | OFM, PHDWin, Aries | Database link / flat file | Low to moderate |
Day-to-Day Impact
What Actually Changes for a Reservoir Team After Integration
The shift is less about a new dashboard and more about where the first answer to a question comes from. Before integration, a reservoir engineer noticing an unusual trend spends the first hour of investigation just assembling context — pulling the SCADA history, exporting a historian trend, and messaging the geology team to confirm which compartment a well sits in. After integration, that context is already attached to the well record, so the same investigation starts from a model that already knows the fault block, the historical baseline, and the live reading, and the engineer's time goes toward deciding what to do about it rather than gathering the facts needed to decide. Over a full asset team, that shift compounds — fewer redundant reports get built, fewer decisions get made on partial information, and the handoff between production engineering and subsurface teams stops depending on someone remembering to loop the other side in. None of this requires replacing the historian, the SCADA system, or the geological modeling software already in place; it requires a layer above them that reads all three as one connected dataset instead of three separate ones that happen to describe the same wells.
Reservoir Integration Questions
Frequently Asked
Do we need to replace our historian to connect it to an AI layer?
No — most integration approaches connect above the existing historian rather than replacing it, using the native connectors that platforms like AVEVA PI System, Honeywell PHD, or AspenTech IP.21 already support. The historian keeps doing its job of archiving and compressing time-series data; the AI layer simply reads from it alongside SCADA and geological data. Contact support to confirm compatibility with your specific historian.
How often does the geological model need to be updated for this to work?
The geological model doesn't need to update in real time — most operators refresh it on a project cadence of months, and the AI layer simply uses whatever version is current until the next update. What matters more than update frequency is that the model's compartment and fault attributes are consistently linked to the same well identifiers used in SCADA and the historian. Book a demo to see how version updates flow through.
What's the biggest technical obstacle to connecting these three systems?
Mismatched well and asset naming conventions across systems cause more integration delays than protocol incompatibility does, since SCADA tags, historian archives, and geological model exports were often built by different teams using different ID schemes. Reconciling that naming is usually the first and most time-consuming step, well before any AI model gets trained. Talk to our team about mapping your existing identifiers.
Can this work for a mature field with decades of legacy historian data?
Yes — legacy historian archives are often the most valuable part of the integration, since decades of compressed trend data give an AI model the historical baseline it needs to tell a genuine anomaly apart from a pattern the field has shown for years. Older data typically requires more cleanup work but rarely blocks integration outright. Book a call to scope your legacy data.
How long does a typical SCADA, historian, and geological data integration take?
A scoped pilot connecting one field's SCADA, historian, and geological data can often be validated within several weeks, while a full multi-field rollout depends on how many legacy systems and naming conventions need reconciliation first. Most operators start with their highest-value or most data-rich field before expanding. Contact our team for a timeline specific to your asset portfolio.
Stop Reassembling Context by Hand
See SCADA, Historian, and Geological Data as One Reservoir Model
iFactory connects your existing SCADA system, historian, and geological model exports into a single AI-ready layer — so reservoir decisions start from a complete picture instead of three separate ones.