Oilfield production teams managing 50 to 500+ wells across multiple leases and production facilities face a fundamental data challenge — the production data they need to optimize well performance exists, but it is scattered across SCADA systems, flow measurement platforms, artificial lift controllers, chemical injection systems, and monthly allocation reports that each capture a different fragment of the production picture at different time intervals. A production engineer trying to answer the question "which wells are underperforming and why?" typically spends 2 to 4 hours per day pulling data from five or more systems, reconciling discrepancies between SCADA production rates and tank gauge measurements, and manually identifying the wells that have deviated from their expected decline curves. iFactory's upstream AI analytics platform eliminates this fragmentation by ingesting production data from all field systems into a unified well performance model that continuously classifies well status, detects production anomalies, diagnoses root causes, and prioritizes intervention opportunities across the entire field. Book a Demo to see how iFactory's AI delivers real-time production optimization intelligence for upstream operations.
Every Producing Well in Your Field Has an Optimal Operating Point — AI Finds the Wells That Have Drifted Away From It and Tells You Exactly How to Bring Them Back
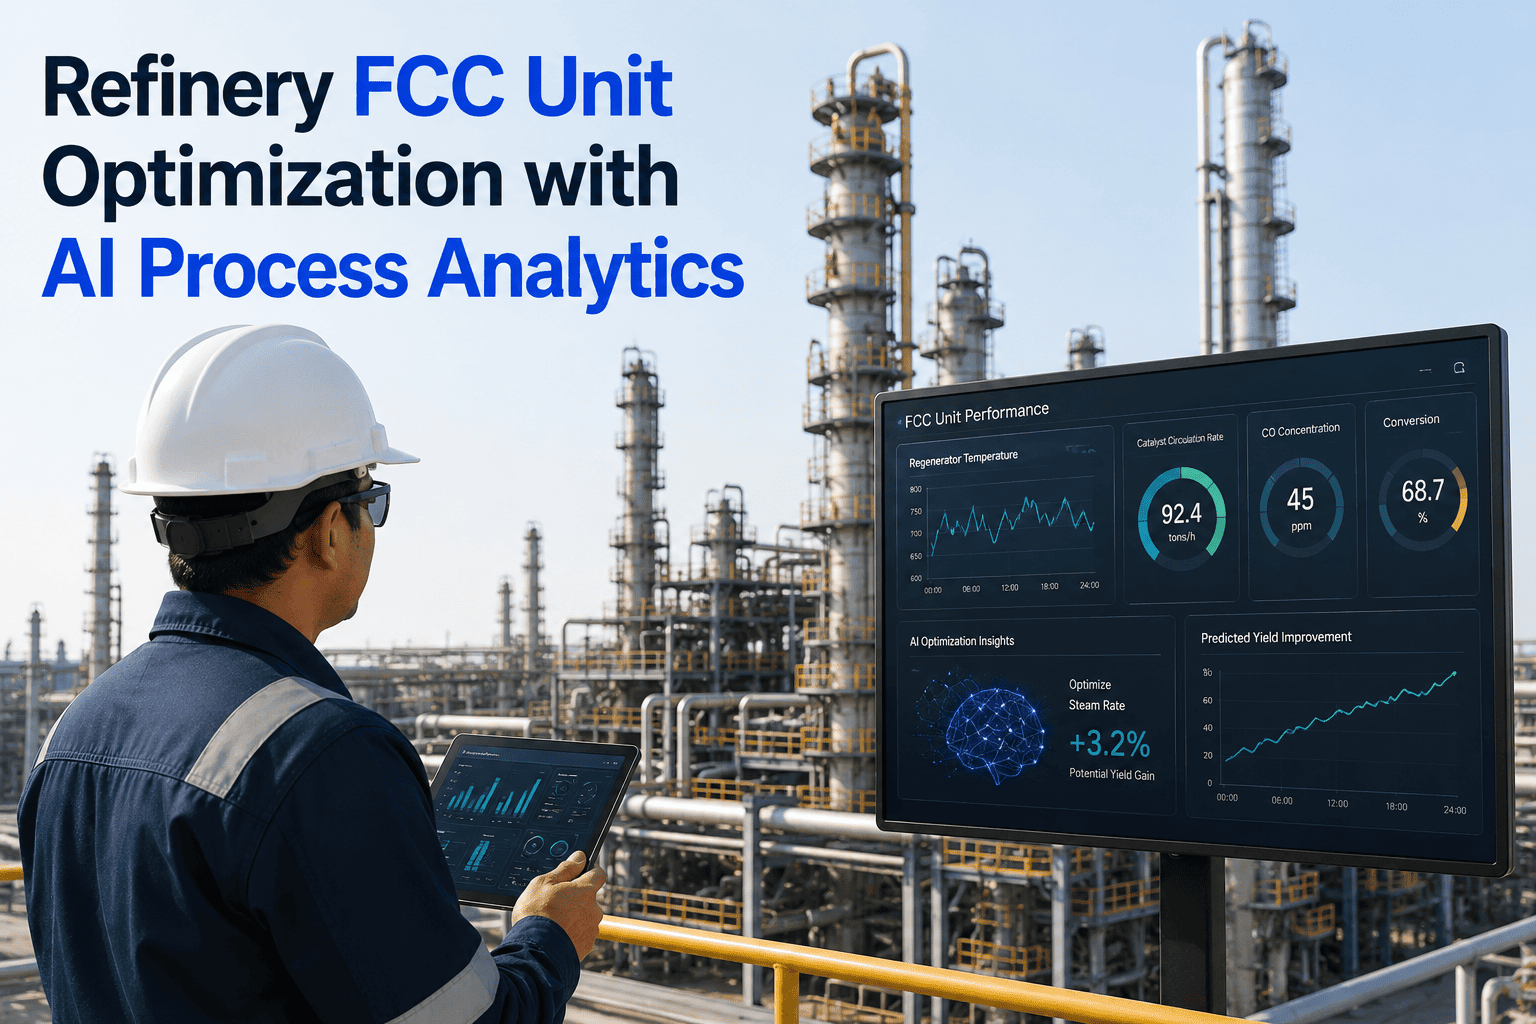
iFactory's oilfield production optimization platform continuously monitors well performance, detects deviation from expected production profiles, diagnoses artificial lift and flow assurance issues, and prioritizes interventions by production impact and implementation cost across your entire field.
The Production Data That Exists at Every Wellhead But Never Reaches the Production Engineer in Time
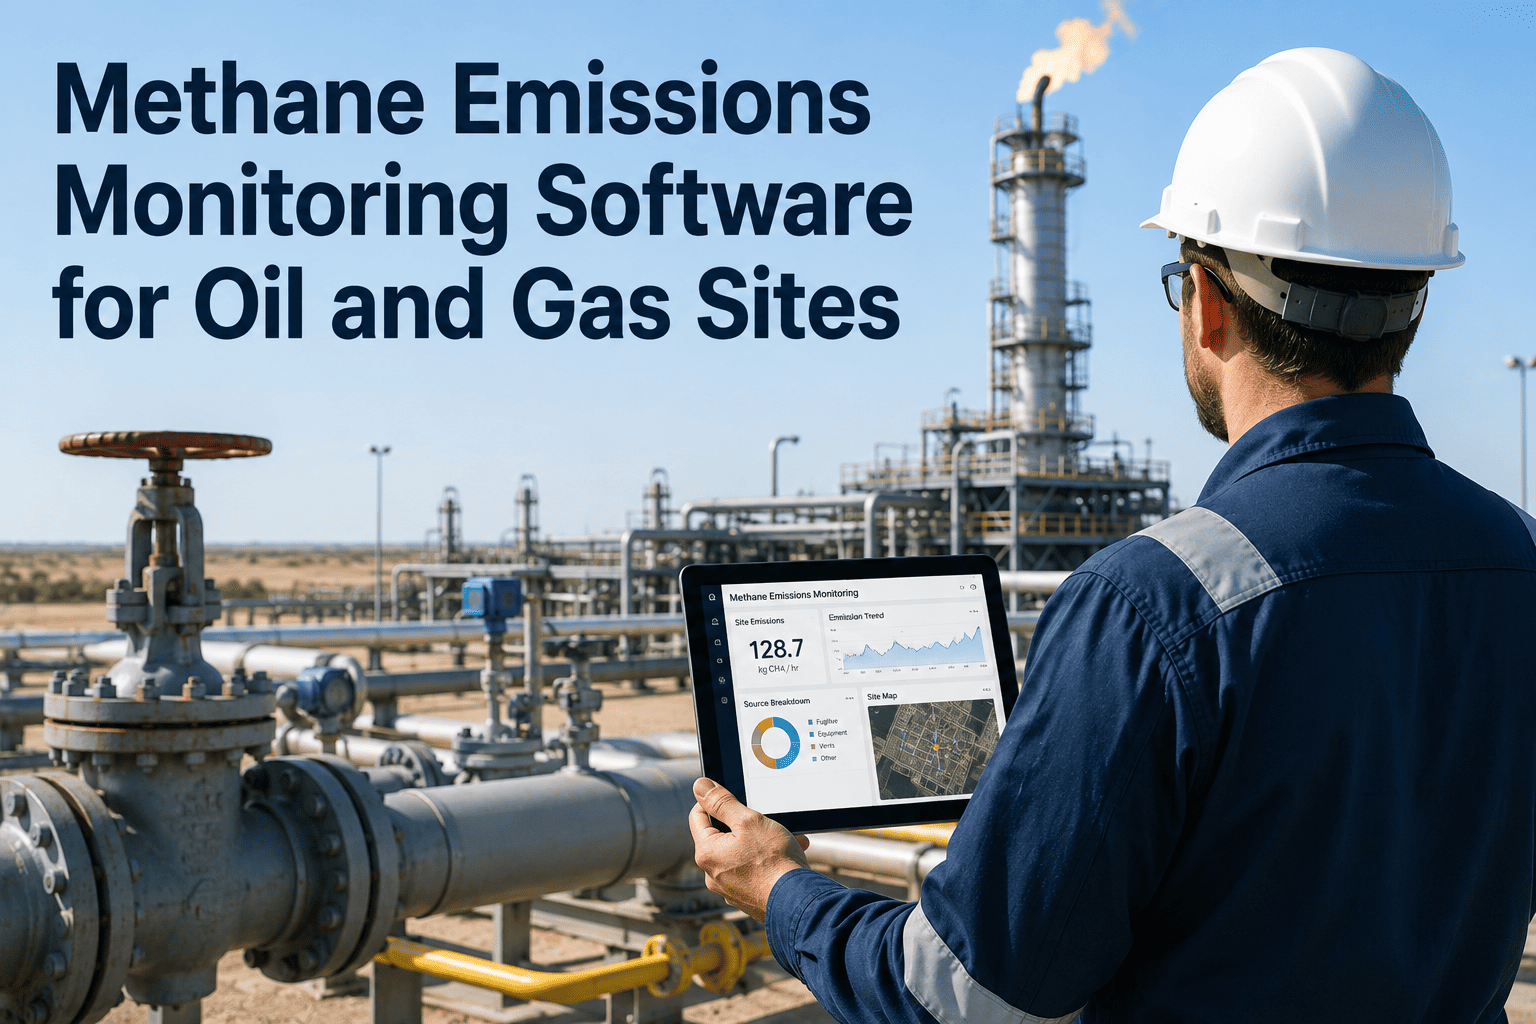
Oilfield operations generate massive volumes of production data, but the journey from wellhead sensor to production engineer's decision is obstructed by system fragmentation, data latency, and manual reconciliation processes that convert real-time signals into stale summaries. The four stat blocks below quantify the visibility gap that iFactory's AI platform is designed to close — measuring the time, data, and production loss that results from fragmented oilfield data systems.
Six Production Domains iFactory's AI Monitors Continuously Across Your Oilfield
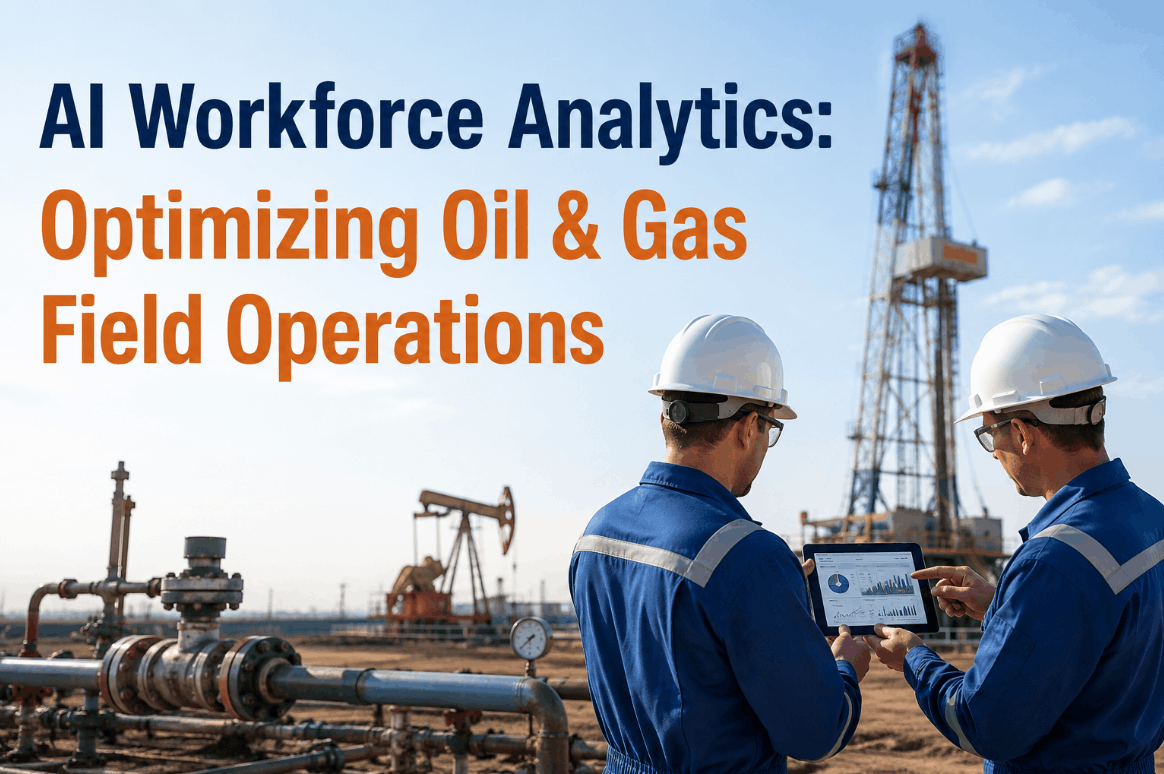
Effective oilfield production optimization requires monitoring multiple interdependent systems simultaneously — the wellbore, the artificial lift equipment, the surface flow path, the produced fluid handling facilities, the injection systems, and the production measurement infrastructure. Each domain generates distinct data patterns that iFactory's AI models analyze to detect issues, quantify production impact, and recommend corrective actions specific to that domain.
Artificial Lift Performance
Wellbore Flow Performance
Surface Flow Assurance
Production Measurement and Allocation
Injection System Performance
Surface Facility Constraints
What Is Actually Stopping Production at Your Wells — Root Cause Breakdown for Upstream Operations
Production downtime at oilfield operations is driven by a distinct set of root causes that differ significantly from refinery or midstream downtime patterns. Understanding the distribution of downtime causes across the field enables the AI platform to prioritize interventions that address the highest-impact loss mechanisms. The following breakdown represents the typical downtime cause distribution across U.S. onshore oilfield operations based on iFactory's deployment experience across Permian, Eagle Ford, Bakken, and DJ Basin assets.
AI Well Performance Classification — Every Well in Your Field Categorized by Status and Action Required
iFactory's AI classifies every well in the field into one of six performance categories based on the comparison between actual production and the AI-generated expected production profile. This classification provides production engineers with an instant view of field health and a prioritized action list that directs attention to the wells where intervention will have the greatest production impact.
Wells that have experienced a sudden production loss exceeding 30 percent within the past 72 hours or have shut in entirely due to equipment failure or safety system activation. These wells require immediate diagnostic investigation and intervention to minimize production loss. The AI identifies the most probable root cause from the available sensor data and recommends the specific diagnostic action — pull a dynocard, check ESP motor current signature, verify gas lift injection pressure — to accelerate the troubleshooting process.
Wells whose production is declining at a rate significantly faster than their expected decline curve — indicating an active degradation mechanism such as progressing artificial lift wear, increasing water cut from coning or channeling, or gradual flowline restriction from scale or paraffin deposition. The AI quantifies the incremental daily production loss from the accelerated decline and recommends the intervention timing that balances the cumulative production loss against the intervention cost.
Wells producing below their AI-estimated potential by 10 to 30 percent due to suboptimal operating parameters — rod pump speed not optimized for current fluid level, gas lift injection rate too high or too low for current reservoir pressure, ESP frequency not adjusted for changing well conditions, or choke setting restricting flow unnecessarily. These wells represent the highest-ROI optimization opportunities because the corrective action is typically an operating parameter change rather than a mechanical intervention.
Wells producing at or within 10 percent of their expected decline curve — the AI model's predicted production rate based on the well's historical decline behavior, current reservoir pressure estimate, and artificial lift performance. These wells require routine monitoring but no immediate intervention. The AI continues to track each stable well for any deviation that would trigger reclassification into a higher-priority category.
Wells where the AI has identified and the operations team has implemented the optimal operating parameters, resulting in production at or above the AI-estimated maximum potential for the current reservoir and lift conditions. These wells serve as the reference standard for the field — the AI analyzes the operating parameters and practices at optimized wells to identify transferable best practices for underperforming wells with similar characteristics.
Wells currently not producing due to scheduled workover, economic shut-in at current commodity prices, regulatory hold, or infrastructure limitation. The AI tracks the reason for shut-in, the estimated restart production rate, the economic threshold for restarting at current prices, and the recommended timing for workover completion or restart authorization.
From Wellhead Sensor to Prioritized Intervention — The AI Analytics Pipeline for Oilfield Production
iFactory's production optimization AI processes well data through a five-stage pipeline that transforms raw sensor readings into prioritized, actionable intervention recommendations. Each stage serves a distinct analytical function, and the pipeline operates continuously — processing new data as it arrives from the field and updating well classifications, diagnoses, and recommendations in real time.
Data Ingestion and Validation
SCADA telemetry from wellhead RTUs, artificial lift controller data, flow meter readings, well test results, injection system data, and facility process data are ingested at configurable intervals from 1 minute to 1 hour depending on the data source and communication infrastructure. Each data point is validated against engineering limits, sensor range, and rate-of-change thresholds — invalid data is flagged and excluded from the analytics pipeline to prevent false anomaly detection.
Production Modeling and Expected Performance
The AI maintains a dynamic production model for each well that predicts the expected oil, gas, and water production rate based on the well's decline curve behavior, current reservoir pressure estimate, artificial lift capacity, and recent operating conditions. The expected production profile is updated continuously as new production data arrives, capturing the natural decline trend and seasonal effects that affect well performance independently of equipment or flow assurance issues.
Anomaly Detection and Classification
Actual production is compared against the expected profile using statistical process control methods adapted for the non-linear, noisy production data typical of oilfield operations. When a deviation exceeds the configured detection threshold — typically 10 to 15 percent below expected production for a sustained period of 12 to 48 hours — the AI classifies the anomaly type using pattern recognition against a library of known failure modes for each artificial lift type and well configuration.
Root Cause Diagnosis and Impact Quantification
For each detected anomaly, the AI identifies the most probable root cause from the diagnostic library — rod pump gas interference, ESP impeller wear, gas lift valve throttling, flowline scale restriction, increasing water cut from coning — and quantifies the production impact in barrels of oil per day, barrels of water per day, and MCF of gas per day. The impact quantification uses the difference between actual and expected production, adjusted for normal operational variability.
Intervention Recommendation and Prioritization
Each diagnosed anomaly is matched to one or more corrective interventions from the intervention library — rod pump speed adjustment, gas lift rate change, flowline chemical treatment, wellbore cleanout, ESP repair or replacement — with an estimated production recovery, implementation cost, and net economic value. All open recommendations across the field are ranked by net economic value to produce the prioritized intervention list that production engineers use for daily planning.
AI Production Forecasting vs Traditional Decline Curve Analysis — Accuracy Comparison
Production forecasting accuracy directly affects capital allocation decisions, reserves reporting, facility sizing, and economic evaluation of infill drilling and workover programs. Traditional decline curve analysis uses deterministic curve-fitting methods that assume constant drainage area, constant relative permeability, and boundary-dominated flow — assumptions that are frequently violated in unconventional reservoirs and mature waterfloods where well interference, changing completion efficiency, and dynamic drainage boundaries make historical decline behavior a poor predictor of future production.
Your Wells Are Telling You Exactly What They Need — But the Data Is Trapped in Five Different Systems That Do Not Talk to Each Other
iFactory's upstream AI platform connects all your wellhead data sources into a single intelligence layer that classifies every well by performance status, diagnoses the root cause of underperformance, and ranks interventions by production impact and cost. Book a demo and see the AI analyzing live production data from your oilfield operations.
Multi-Field Production Performance Comparison — The Executive View Across Your Upstream Portfolio
Oil and gas companies operating multiple fields or basins need to compare production performance, optimization opportunities, and operational efficiency across their entire upstream portfolio. The table below represents the multi-field comparison view that iFactory's dashboard provides — aggregating well-level analytics into field-level summaries that enable direct comparison, best practice transfer, and capital allocation decisions across the portfolio.
| Metric | Permian Basin | Eagle Ford | Bakken | DJ Basin |
|---|---|---|---|---|
| Total Producing Wells | 342 | 187 | 124 | 95 |
| Current Oil Production (BOPD) | 48,200 | 22,800 | 18,400 | 11,600 |
| Wells in Critical or Declining Status | 58 (17%) | 24 (13%) | 28 (23%) | 11 (12%) |
| Wells with AI-Identified Optimization Opportunity | 86 (25%) | 41 (22%) | 38 (31%) | 19 (20%) |
| Estimated Recoverable Production (BOPD) | 3,800 | 1,600 | 2,100 | 890 |
| Artificial Lift Uptime | 91.2% | 94.8% | 87.4% | 95.1% |
| Average Downtime per Event (Hours) | 38 | 29 | 52 | 24 |
| AI Forecast Accuracy (30-Day) | 4.2% | 3.8% | 5.1% | 3.4% |
| Open High-Priority Interventions | 14 | 7 | 12 | 4 |
| Estimated Value of AI-Identified Opportunities | $4.2M/yr | $1.9M/yr | $2.7M/yr | $1.1M/yr |
Quantified Production Uplift From AI-Powered Oilfield Optimization Deployments
The following outcomes represent measured results from iFactory's upstream AI production optimization deployments across onshore U.S. oilfield operations. Each metric reflects a sustained improvement measured over a minimum 6-month period after AI implementation, validated by the operator's production accounting team using standard well test and allocation data.
Common Questions About AI-Powered Oilfield Production Optimization
AI Production Optimization Turns the Data Your Wells Are Already Generating Into the Production Uplift Your Budget Requires
Every producing well in your field generates continuous data streams from SCADA systems, artificial lift controllers, flow meters, and well test facilities — data that contains the signals needed to identify underperformance, diagnose root causes, and optimize operating parameters. The production uplift potential is real and measurable — 5 to 12 percent across the field for most onshore U.S. operations — but it remains unrealized as long as the data sits in fragmented systems waiting for a production engineer who has time to analyze one well at a time.
iFactory's upstream AI platform processes well data continuously, classifies every well by performance status against a reservoir-adjusted expected production profile, diagnoses the root cause of every deviation, and delivers a prioritized intervention list ranked by production impact and implementation cost. The result is faster anomaly detection, more accurate production forecasting, fewer unnecessary workovers, and a systematic approach to capturing the 8 to 15 percent production gap that exists between actual and optimized performance at most oilfield operations. Book a Demo to see iFactory's AI production optimization platform analyzing live well data from your upstream operations.
Every Day a Well Produces Below Its AI-Estimated Potential Is a Day of Revenue You Cannot Recover — iFactory Ensures You See Every Underperforming Well on the Day It Happens
iFactory's upstream AI platform monitors every well in your field, detects performance deviations in hours instead of days, diagnoses the root cause, and ranks the intervention by production impact so your team always works on the highest-value opportunity first. Book a demo and see the AI classifying and diagnosing wells across your oilfield in real time.