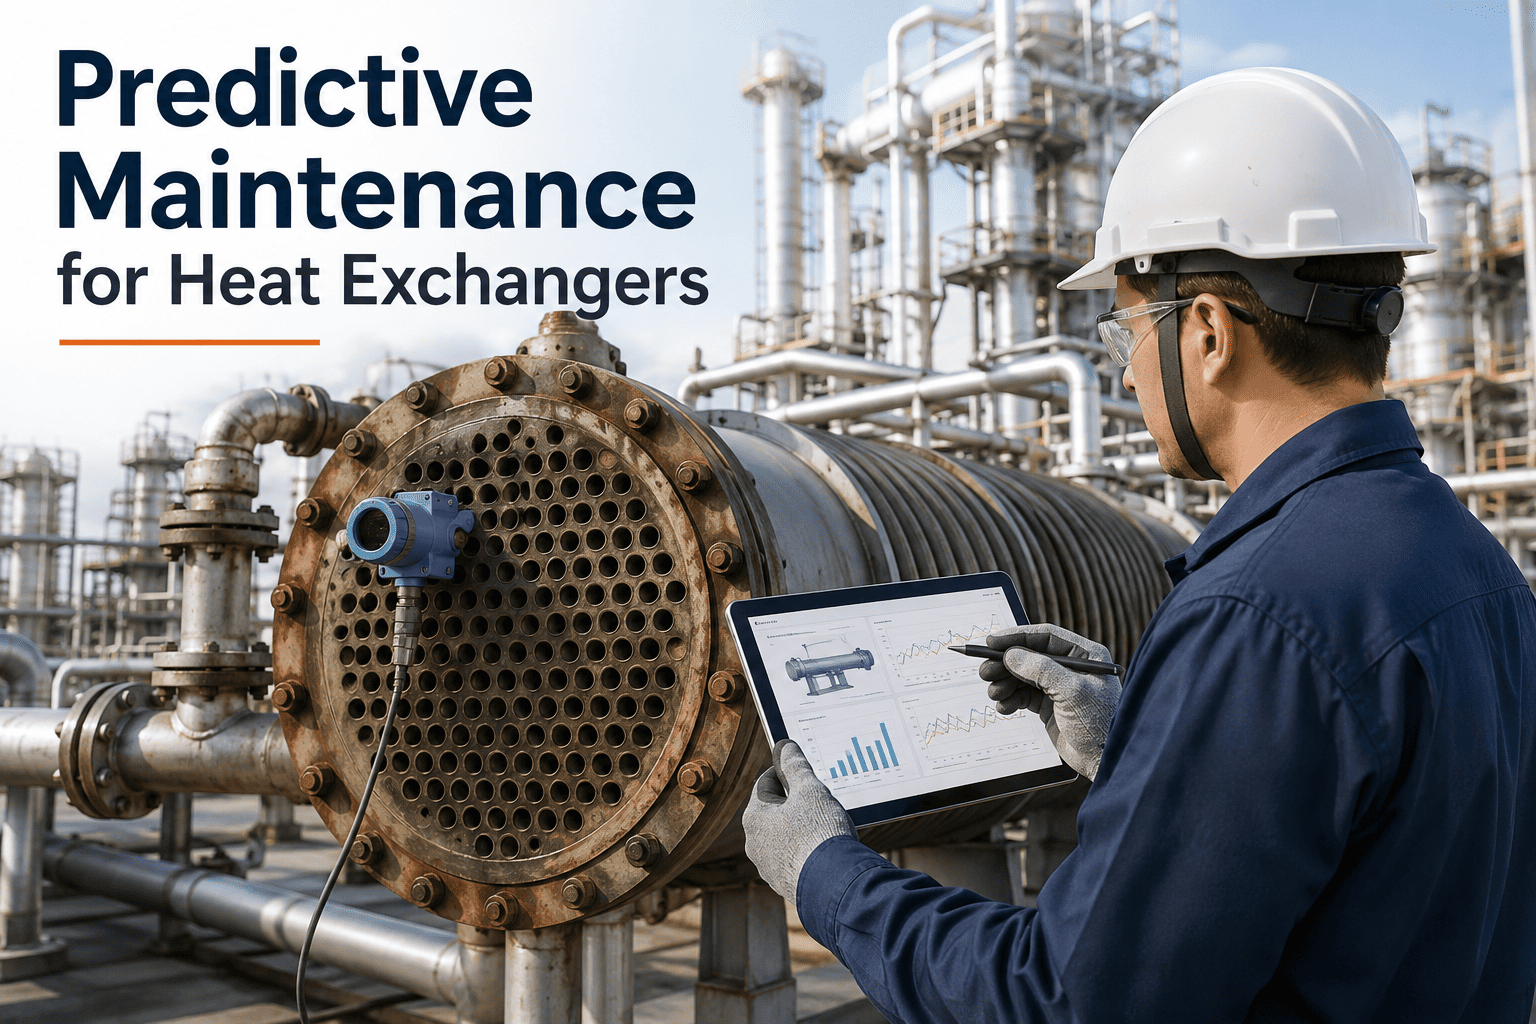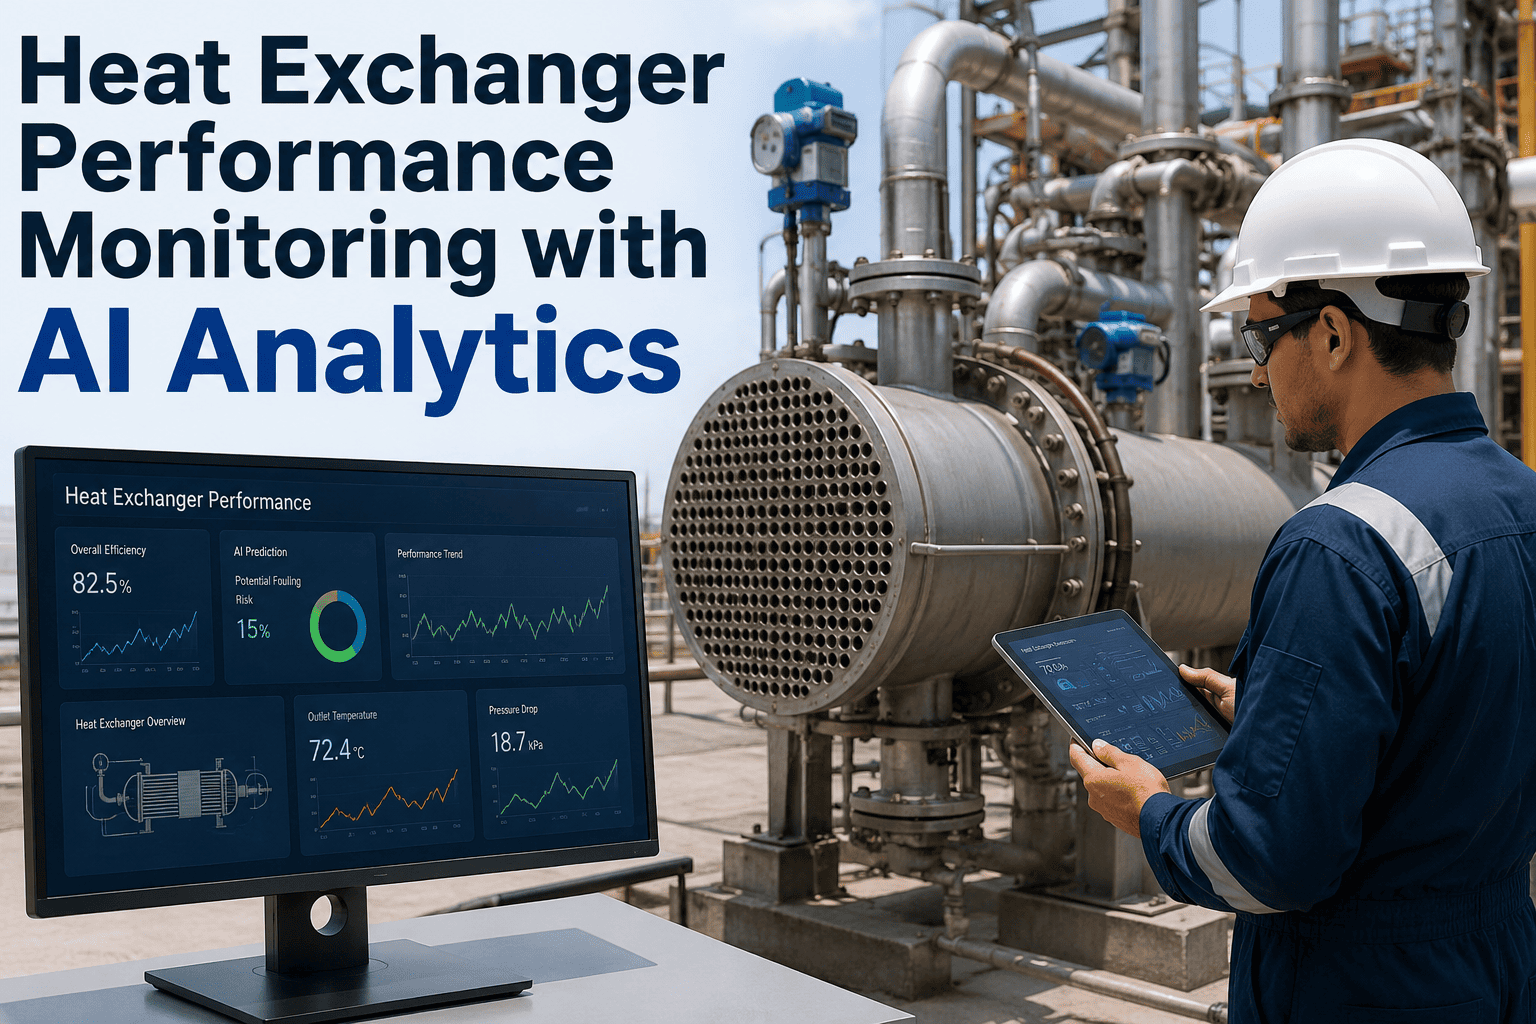
The outlet temperature on E-104 has been sliding for six weeks, half a degree at a time, and nobody has flagged it because half a degree does not trip an alarm. By week eight it is four degrees off baseline, the furnace is burning extra fuel to compensate, and the preheat train is quietly costing the refinery thousands of dollars a day. Fouling never announces itself with a single dramatic event. It builds in the margins between routine checks, invisible until someone finally pulls the performance report and asks why fuel consumption climbed. AI-driven monitoring closes that margin by watching every exchanger's thermal signature continuously and flagging the drift while it is still cheap to fix, well before a scoping call with iFactory's process team becomes a shutdown conversation.
Fouling Is Not a Maintenance Problem. It Is a Silent Fuel Bill.
Heat exchanger fouling is estimated to cost United States industries close to fourteen billion dollars a year in wasted energy and lost throughput, with crude distillation unit fouling alone projected at roughly one to one point two billion dollars annually across the domestic refining sector. Most of that cost sits in production loss and furnace fuel, not in the cleaning invoice.
Why Fouling Slips Past Manual Monitoring Every Time
Operators log outlet temperature, pressure drop, and duty once or twice a shift, sometimes less on units considered low-risk. A single reading tells you where the exchanger is right now. It tells you nothing about the rate of change, and rate of change is exactly what separates a normal seasonal dip from an exchanger that needs cleaning in three weeks instead of three months. Here is what the fouling curve actually looks like once you plot it continuously instead of glancing at it twice a day.
Clean Baseline
Overall heat transfer coefficient sits within two percent of design. Outlet temperature is stable shift over shift. This is the window nobody worries about, which is exactly when the baseline should be recorded.
Early Drift
Outlet temperature slips a fraction of a degree per week. Pressure drop climbs slowly. Individually each reading looks like noise. Plotted against a trend line, it is the earliest and cheapest point to schedule a cleaning.
Compounding Loss
The furnace begins compensating with extra fuel to hold downstream temperature. Duty loss is now measurable in dollars per day. Documented cases show feed temperature dropping from around 210 degrees Celsius toward 170 degrees Celsius once fouling reaches this stage.
Forced Cleaning
Pressure drop or throughput limits force an unplanned outage. Cleaning at this stage costs more, takes longer, and the fuel penalty paid during weeks eight through eleven is never recovered.
What AI Analytics Actually Watches on Every Exchanger
The model is not looking for one number. It is comparing a live thermal signature against a clean-condition baseline built from your own historian data, and it separates real fouling from normal swings caused by ambient temperature, feed rate, or crude slate changes. That distinction is what keeps the system from crying wolf every time the plant runs a different crude blend.
Overall Heat Transfer Coefficient Trend
Calculated continuously from historian tags rather than a monthly spot check, so a slow decline shows up as a trend line weeks before it shows up as a complaint from the furnace operator.
Approach Temperature Deviation
The gap between actual and design approach temperature is tracked per exchanger and normalized for flow rate, isolating fouling-driven loss from load-driven variation.
Pressure Drop Escalation
Rate of pressure drop increase across the exchanger is compared against its own historical cleaning cycles, predicting the week a mechanical limit will be reached rather than waiting for it to happen.
Fuel Gas Compensation Signal
When furnace duty rises to hold outlet temperature steady, the system attributes the incremental fuel cost to the specific exchanger driving the loss, turning an abstract efficiency number into a dollar figure.
Cleaning Window Recommendation
Combining fouling rate with the plant's turnaround calendar, the model recommends the cleaning window that minimizes both fuel penalty and unplanned downtime risk.
Stop Reading Fouling Off a Fuel Bill
See how AI-driven performance monitoring turns your existing historian data into an early warning system for every exchanger in the preheat train, before the furnace has to pick up the slack.
Manual Log Review vs Continuous AI Monitoring
A shift log and a monitoring dashboard can technically track the same tags. What changes is how early the drift is visible and how much of the loss is recoverable once someone notices. The table below lays out the practical difference across a typical crude preheat train.
| What Changes | Manual Log Review | Continuous AI Monitoring |
|---|---|---|
| Check frequency | Once or twice per shift, per exchanger | Every historian scan, all exchangers, continuously |
| Baseline comparison | Compared against memory or a static design sheet | Compared against a live clean-condition model, adjusted for crude slate and rate |
| Time to detect drift | Weeks, usually after fuel cost is already visible | Days, flagged as soon as the trend breaks baseline |
| Cleaning schedule | Fixed calendar or reactive, after a limit is hit | Dynamic, based on predicted fouling rate per unit |
| Cost visibility | Rolled into overall fuel spend, hard to isolate | Attributed to the specific exchanger driving the loss |
Built on Data You Already Collect, Not a New Sensor Layer
Refineries are not short on data. Historians already store temperature, pressure, and flow tags for every exchanger in the preheat train. The gap is analysis, not instrumentation. Here is how the monitoring layer sits on top of what you already have.
Historian Connection
Reads existing OSIsoft PI, Honeywell PHD, or equivalent historian tags directly. No new field instrumentation and no interruption to the exchanger or the control loop.
Baseline Modeling
Builds a clean-condition thermal model per exchanger from your own historical data, then continuously scores live performance against it to isolate fouling-driven loss from load-driven variation.
Engineer Dashboard
Process and reliability engineers see fouling rate, dollar-per-day fuel penalty, and recommended cleaning window per exchanger, ranked by urgency across the entire preheat train.
CMMS and Turnaround Sync
Recommended cleaning windows write into the maintenance and turnaround planning system, so the fix lands on a schedule instead of competing for an emergency outage slot.
What Changes on a Typical Crude Preheat Train
The value of catching fouling early is not abstract. It shows up directly in fuel gas consumption, in the number of forced cleanings per year, and in how far in advance the maintenance team knows a shutdown is coming.
of fouling-driven fuel penalty recovered once cleaning is scheduled at early drift instead of forced shutdown
fewer unplanned exchanger cleanings once fouling rate is tracked continuously across the preheat train
days average advance notice engineers get on a required cleaning, versus days of notice under manual review
Process Engineer Perspective
We had E-104 flagged for early drift a full ten weeks before it would have hit our pressure drop limit. We scheduled the cleaning into a planned outage instead of fighting it during a summer run when margins are tightest. The fuel gas savings alone covered the monitoring cost for the quarter, and that is before counting the outage we avoided.
— Process Reliability Engineer, Gulf Coast Crude Unit
Frequently Asked Questions
Does this require installing new sensors on our heat exchangers?
In most cases, no. The system connects to your existing historian, whether that is OSIsoft PI, Honeywell PHD, or a similar platform, and reads the temperature, pressure, and flow tags you are already collecting. New instrumentation is only recommended where an exchanger genuinely lacks the tags needed to calculate a reliable heat transfer coefficient, which is uncommon on a modern crude preheat train. You can book a scoping call to confirm tag coverage on your specific units before committing to anything.
How does the model tell the difference between fouling and a normal crude slate change?
The baseline model is built from your historical data across multiple crude slates and flow rates, not a single clean snapshot. When feed rate or crude composition shifts, the model adjusts the expected performance envelope accordingly, so it only flags a deviation that persists after those normal factors are accounted for. This is what keeps the system from generating false alarms every time the plant changes crude blends or runs at reduced rate.
Can the system estimate the actual fuel cost of fouling, not just a technical efficiency number?
Yes. The model converts the measured heat transfer loss into the additional furnace duty required to hold downstream temperature, then translates that duty gap into a fuel gas cost per day for each exchanger. This is what lets a reliability engineer justify a cleaning window in dollars rather than in an efficiency percentage that is harder to defend in a turnaround budget meeting.
How far in advance does the system typically flag a cleaning need?
Advance notice depends on the exchanger's historical fouling rate and how conservatively thresholds are set during tuning, but plants monitoring a full preheat train continuously typically see cleaning recommendations weeks to months ahead of a forced outage, compared to little or no notice under periodic manual review. The exact window for your units is established during the initial baseline modeling phase using your own historical fouling cycles.
Does this integrate with our existing maintenance planning or CMMS system?
Yes. Recommended cleaning windows and urgency rankings can write directly into your maintenance and turnaround planning workflow, so a flagged exchanger becomes a scheduled work order instead of a dashboard alert someone has to remember to act on. Integration scope depends on your specific CMMS platform, and the iFactory support team can walk through your environment before implementation begins.
The Fuel Penalty Is Already on Your Books
Every degree of approach temperature lost to fouling is already showing up in your fuel gas invoice, whether or not anyone has traced it back to a specific exchanger. The data needed to catch it early is already sitting in your historian. What is missing is a model watching that data continuously instead of a person glancing at it twice a shift. Refineries that close that gap are cleaning exchangers on their own schedule instead of the exchanger's schedule, and recovering a fuel penalty most plants never realize they are paying.
See Your Preheat Train's Fouling Signal, Not Just Its Fuel Bill
Book a walkthrough of the Process Equipment demo and see how continuous AI monitoring turns your existing historian tags into an early warning system across every exchanger you run.