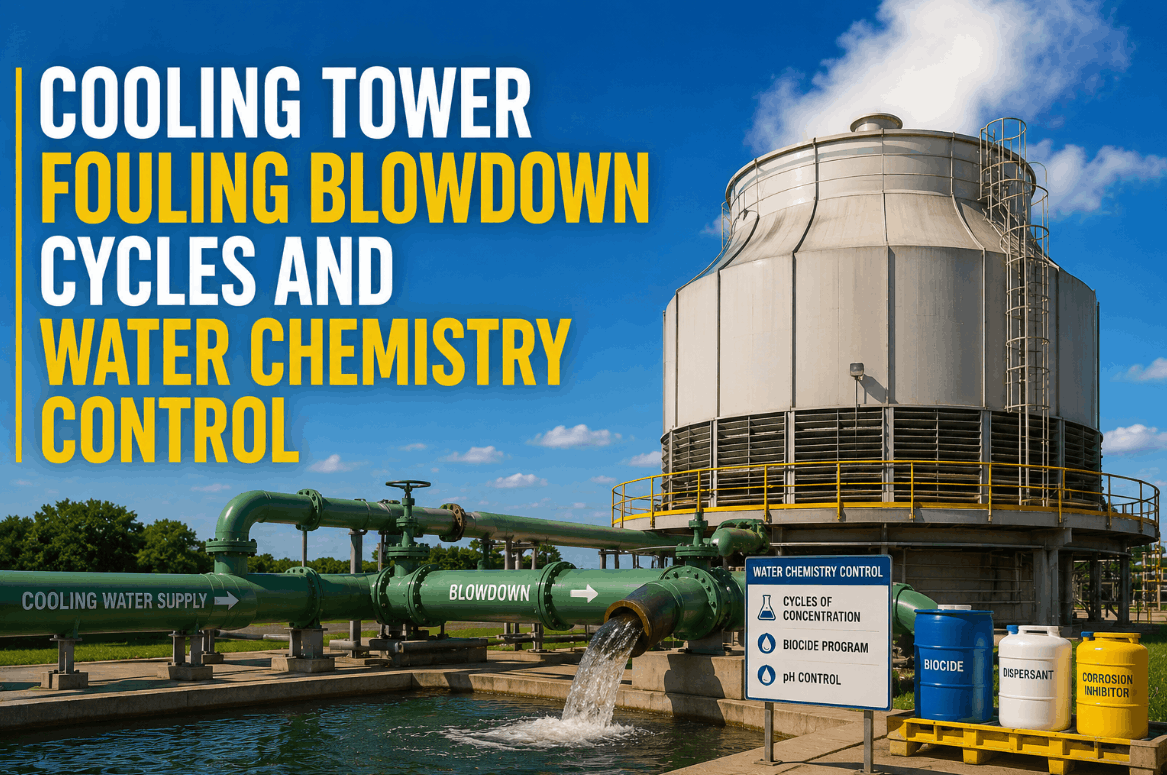
A cooling tower losing a few degrees of approach temperature doesn't set off any alarms. It just quietly lets condenser backpressure creep upward week after week, until someone finally notices output has slipped and traces it back to fill media that's been fouling since the last inspection, which for many towers only happens once every twelve to eighteen months. Cooling towers are often the least-monitored major asset in a refinery, dissipating waste heat for process coolers and compressors while getting a fraction of the attention paid to the units they support. View a utility AI demo to see what's already drifting on yours.
Utilities · Predictive Analytics
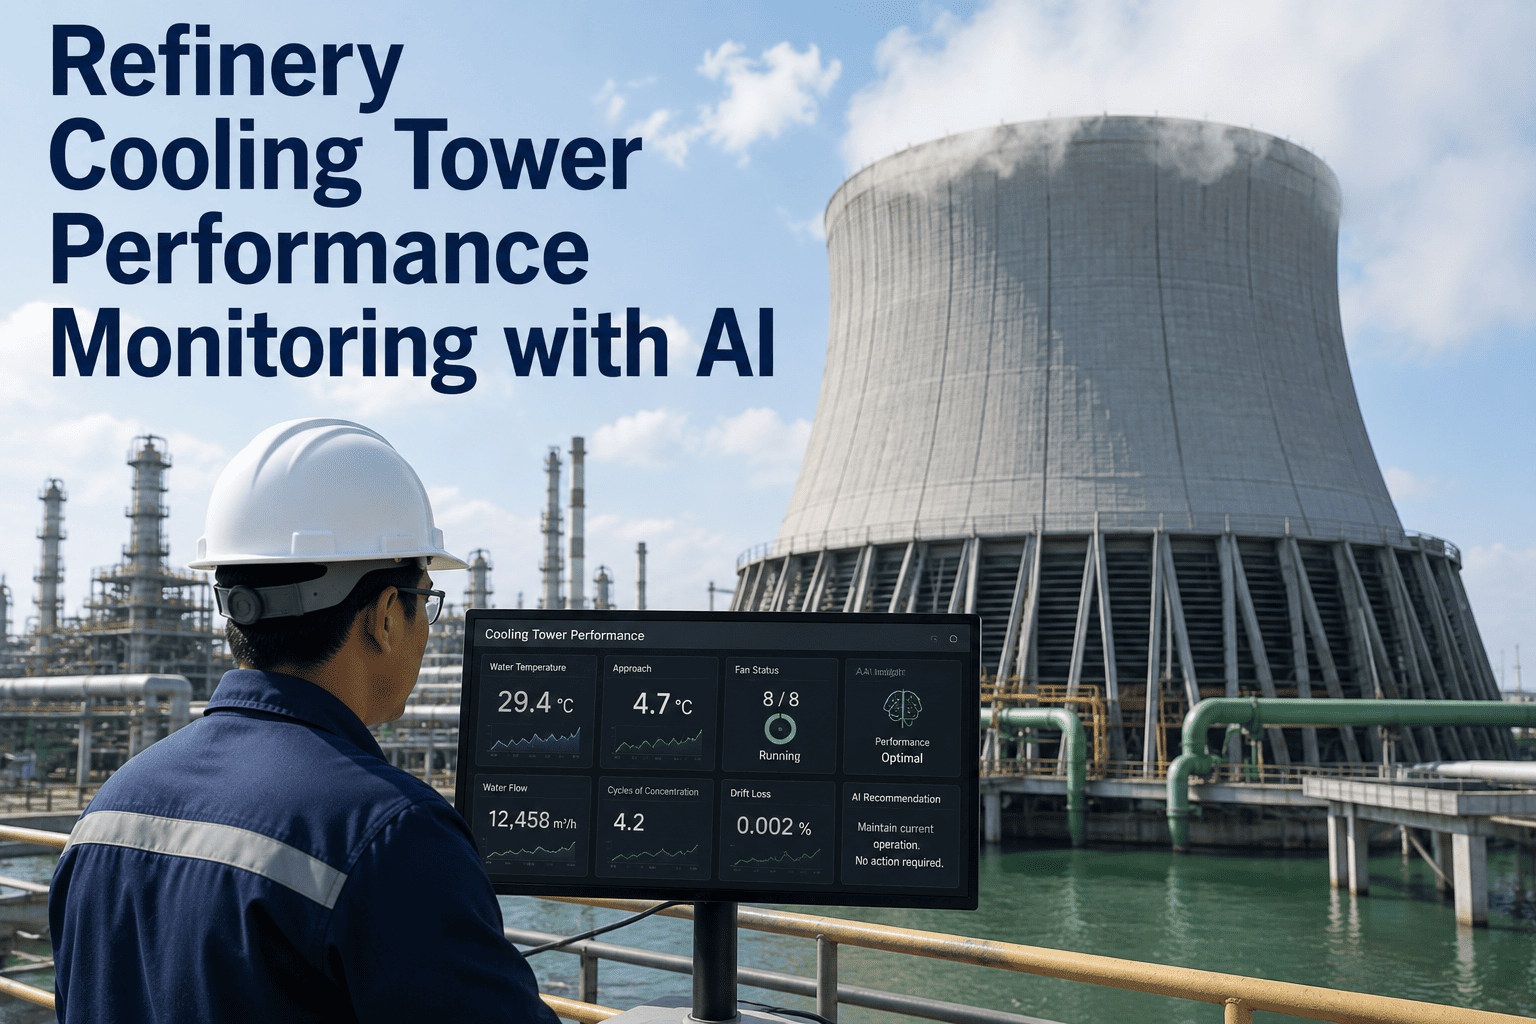
Refinery Cooling Tower Performance Monitoring with AI
Track efficiency, fouling signals, fan health, and water issues on the utility asset most refineries check the least — before it costs you a turbine de-rate.
The Slowest Failure in the Plant Is Also the Easiest to Miss
Fill fouling, fan drivetrain wear, and basin water quality all degrade over weeks to months, not hours — which is exactly why they tend to progress toward a real efficiency penalty before anyone notices the trend.
Week 1-2
Scale and biological growth begin forming on fill media, invisible from a normal visual inspection.
Week 3-6
Approach temperature starts drifting upward. Condenser backpressure climbs, but stays within a range operators dismiss as normal seasonal variation.
Week 8+
The turbine is already de-rating, generation losses are adding up daily, and a 72-hour mechanical cleaning outage is now unavoidable.
What Continuous Monitoring Changes
2-6 wks
How much earlier AI models flag degradation before it becomes a significant efficiency loss
78%
Average reduction reported in cooling-related turbine de-rate events after deploying continuous monitoring
4.2x
Improvement in fill cleaning interval optimization once cleaning is scheduled from data instead of a fixed calendar
Three Things Worth Watching Continuously
Fill Media
Thermal and water temperature differential trending catches fouling onset at early-stage blockage, long before a quarterly or annual visual inspection would notice.
Fan Drivetrain
Vibration signatures and bearing temperature trends classify gearbox fault progression across severity stages instead of waiting for an audible failure.
Basin Water Chemistry
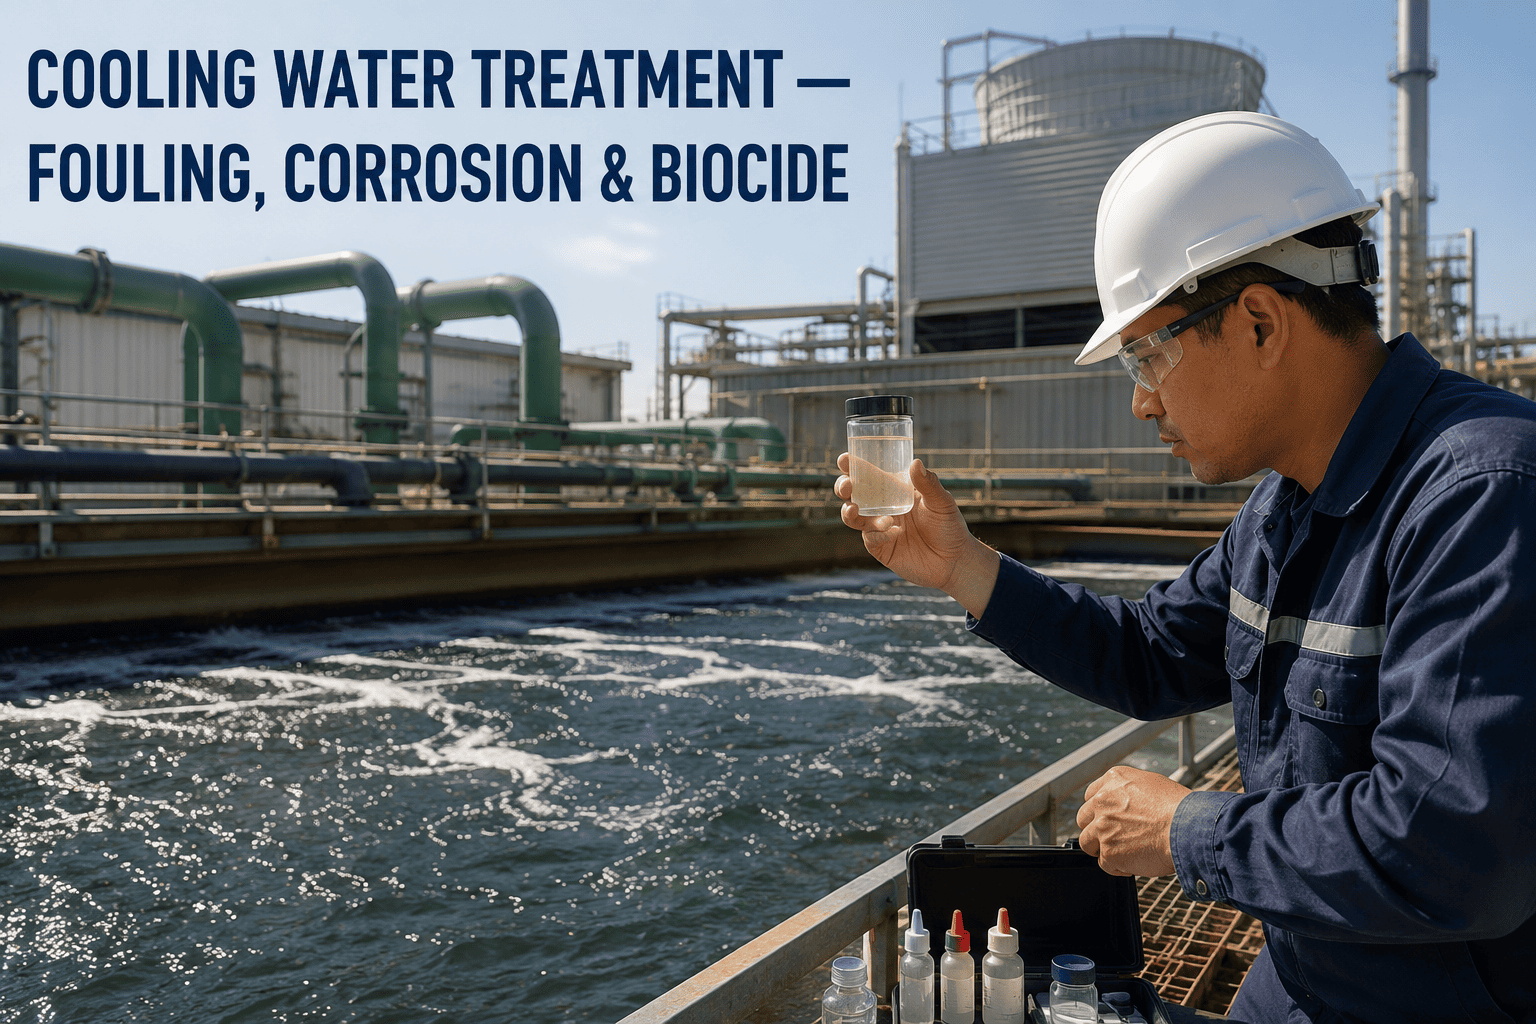
Continuous chemistry telemetry predicts excursions before they degrade water quality, catching what weekly grab samples only capture as a single snapshot.
Your water treatment program and inspection protocols already work as designed. What changes with AI is the data density and cross-correlation layer sitting on top of them — not a wholesale replacement of what your team already does well.
Quarterly Inspection vs. Continuous Monitoring
Periodic Inspection
Fill inspections once every 12-18 months on a typical multi-cell tower
Weekly grab samples capture only a single water chemistry snapshot
Fan and gearbox issues found through audible or visible failure
Cleaning and maintenance scheduled on a fixed calendar regardless of condition
Continuous AI Monitoring
Thermal and vibration telemetry runs continuously across all cells
Water chemistry excursions predicted before quality actually degrades
Gearbox fault progression classified across four severity stages
Cleaning scheduled from real condition data, extending useful intervals
Expert Insight
The single biggest mistake teams make with cooling tower monitoring is treating it as a sensor installation project. It isn't. Your existing water treatment program, visual inspection protocols, and DCS temperature readings work fine as designed — there's no case for replacing them wholesale. What actually needs to change is the data ingestion density and the cross-correlation layer sitting above them, so fill fouling, fan wear, and basin chemistry get read together instead of as three unrelated logs.
Priya Ramaswami — Utility Systems Reliability Consultant, refinery and power plant thermal systems
Cost of Waiting vs. Cost of Catching It Early
| Scenario |
Undetected Until Alarm |
Caught by Continuous Monitoring |
Why It Matters |
| Approach temp loss |
Noticed after turbine already de-rating |
Flagged 2-6 weeks before efficiency loss is significant |
Generation losses are avoided instead of absorbed |
| Fan bearing wear |
Found at audible failure or vibration alarm |
Classified across severity stages ahead of failure |
Repairs get planned instead of emergency-scheduled |
| Fill fouling |
Found at next scheduled 12-18 month inspection |
Detected at early-stage blockage percentage |
Cleaning happens before performance actually suffers |
| Basin chemistry |
Weekly grab sample snapshot only |
Continuous excursion prediction |
Water quality issues addressed before they compound |
| Mechanical cleaning outage |
Roughly 72 hours, unplanned |
Scheduled with full lead time for parts and crew |
Outage duration and disruption both shrink |
Frequently Asked Questions
Do we need to replace our existing water treatment program?
No, your existing water treatment program, visual inspection protocols, and DCS readings continue working exactly as designed. AI monitoring adds a data density and cross-correlation layer on top of what you already run, rather than asking you to replace a program that already works.
View a utility AI demo to see how it layers onto your current setup.
How early can this actually catch fill fouling?
Continuous thermal and vibration telemetry is designed to detect fill fouling onset at early-stage blockage percentages, well before a scheduled inspection that might only happen once every twelve to eighteen months would notice a problem. That earlier signal is what typically translates into a meaningfully longer safe cleaning interval.
Contact support for detail on detection thresholds for your tower configuration.
What does this mean for turbine de-rate events tied to cooling performance?
Facilities running continuous cooling tower monitoring have reported substantial reductions in cooling-related turbine de-rate events, since approach temperature drift and condenser backpressure trends get flagged and corrected weeks before they reach the point of forcing a derate.
View a utility AI demo to see how de-rate frequency is tracked over time.
Does this require new sensors on every fan and cell?
Coverage depends on your current tower configuration, but the approach is generally to add thermal, vibration, and water chemistry telemetry incrementally to the highest-risk cells first rather than requiring a full simultaneous retrofit across every fan on day one.
Contact support to plan a phased sensor rollout.
Is this relevant for a single cooling tower or only large multi-cell installations?
The same monitoring principles apply regardless of tower size, though the case tends to be strongest on larger multi-cell towers with eight to twelve fans, where a single undetected fouling or fan issue across one cell can be harder to catch through periodic visual inspection alone.
View a utility AI demo to discuss fit for your specific installation.
Stop Letting Your Quietest Asset Cause Your Loudest Losses
See fill fouling, fan wear, and basin chemistry drift weeks before they show up as a turbine de-rate or an unplanned cleaning outage.