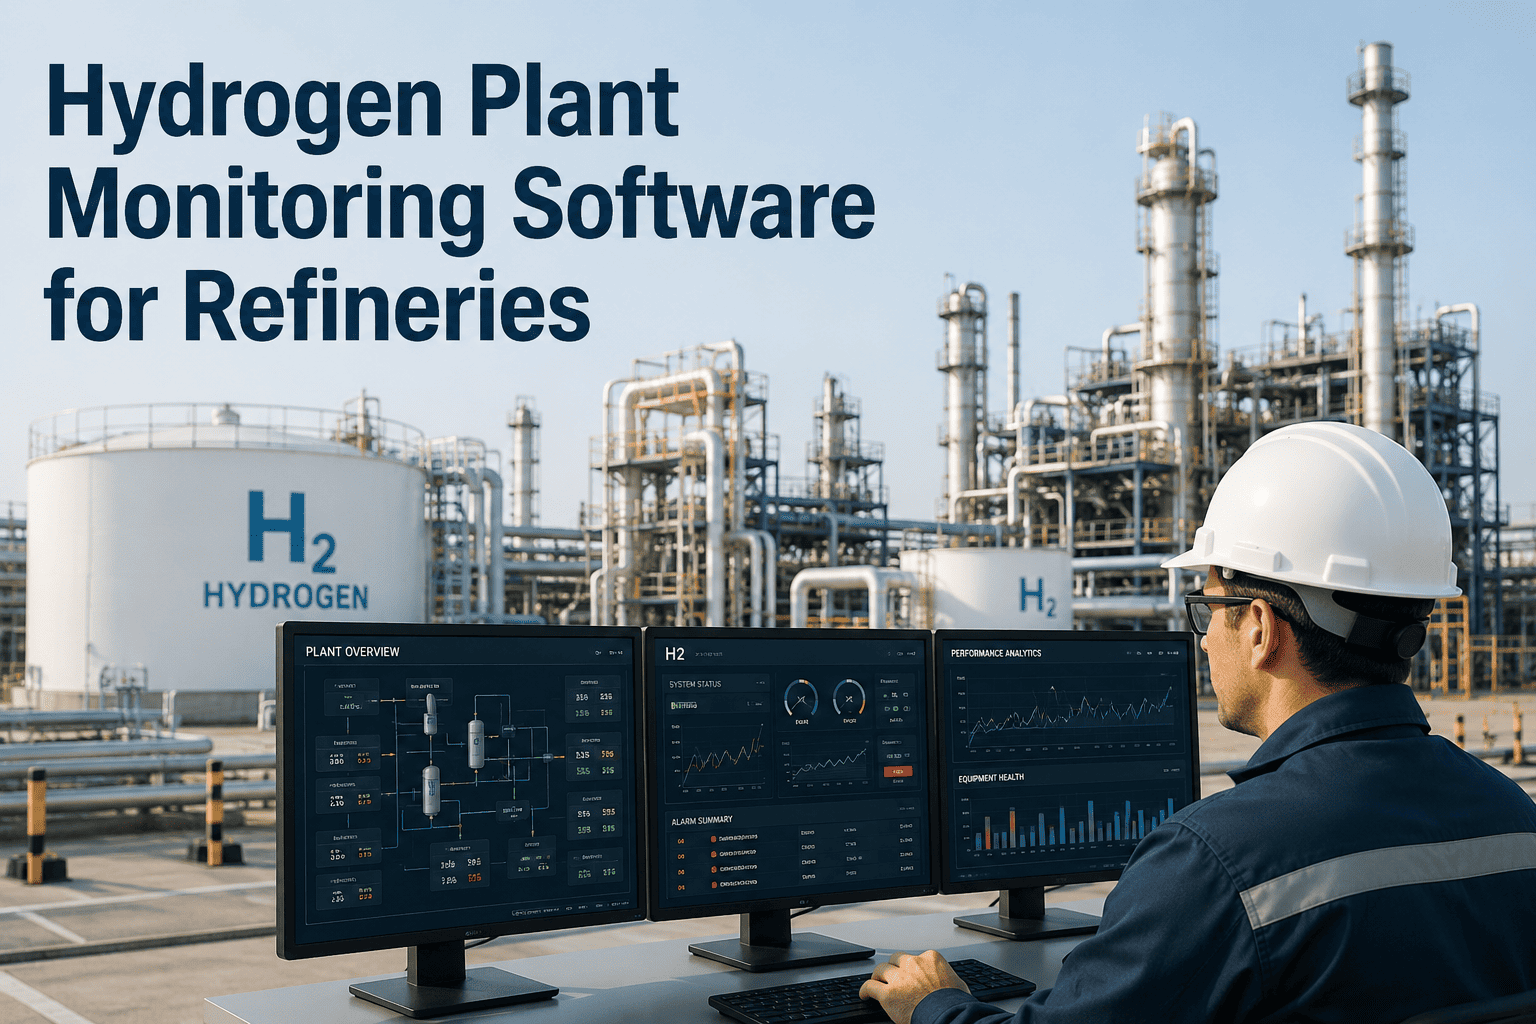
Hydrogen is the backbone of modern refinery operations, powering hydrocracking, hydrotreating, and desulfurization units that produce clean fuels meeting increasingly stringent environmental regulations. Yet hydrogen plant reliability remains one of the most persistent operational challenges in downstream processing, with unplanned shutdowns costing between $500,000 and $2 million per day in lost production and downstream unit impacts. Most refineries still rely on periodic manual inspections, lagging process data review, and spreadsheet-based performance tracking to manage hydrogen unit health — approaches that identify problems hours or days after process deviations begin. AI-powered process analytics from iFactory continuously monitors every critical parameter across the hydrogen production process and detects deviations before they escalate into costly shutdowns.
Steam Reformer · Shift Converter · PSA · Compressor · Catalyst
Hydrogen Plant Monitoring Software: Real-Time Process Analytics for Refinery Hydrogen Units
iFactory delivers continuous AI-driven monitoring across every stage of hydrogen production — from feed gas conditioning through steam methane reforming, shift conversion, PSA purification, and recycle gas compression — giving refinery operators the early warning capability that manual tracking cannot provide.
$500K–$2M
Daily cost of unplanned hydrogen unit shutdown including downstream impacts
60–70%
Of hydrogen in U.S. refineries produced via steam methane reforming
18–36 Mo
Typical reformer catalyst life before replacement is required
4–8 Hrs
Average delay between deviation onset and operator detection without AI
Why Hydrogen Unit Reliability Directly Controls Refinery Profitability
Every hydrocracker, hydrotreater, and desulfurization unit in a refinery depends on a continuous supply of high-purity hydrogen. When the hydrogen plant trips or reduces output, downstream units must immediately cut feed rates or risk catalyst damage and off-spec product — creating a cascade of production losses that far exceeds the hydrogen unit itself. The root causes of these disruptions are almost always detectable in process data hours or days before they become critical: gradual catalyst degradation manifests as slowly rising tube metal temperatures, compressor bearing wear shows up as increasing vibration amplitudes long before mechanical failure, and PSA adsorbent degradation appears as declining hydrogen recovery rates across successive cycles. The problem is not that the data is unavailable — it is that no human operator can continuously correlate dozens of interdependent parameters across multiple process stages simultaneously. Book a Demo to see how iFactory's process analytics engine monitors these relationships in real time.
Catalyst Degradation Goes Undetected
Reformer catalyst degrades gradually over 18–36 months, requiring increasing furnace firing to maintain conversion. Operators typically notice only when tube metal temperatures approach alarm limits — by which point the degradation curve has steepened and remaining catalyst life is shorter than expected, forcing an unplanned replacement during a non-scheduled window.
8–12 Weeks of remaining catalyst life typically lost when degradation is detected at alarm limits versus early-trend detection
Compressor Vibration Trends Ignored
Recycle and make-up gas compressors exhibit increasing vibration signatures months before bearing failure or seal degradation reaches critical thresholds. Without continuous trend monitoring and correlation with process conditions, these signatures are treated as noise until a high-vibration trip occurs — often during peak downstream hydrogen demand when production impact is maximized.
3–6 Months of lead time available in vibration trend data before mechanical failure — if someone is watching continuously
PSA Recovery Rate Decline Hidden in Averages
Pressure Swing Adsorption units show declining hydrogen recovery rates as adsorbent beds age or suffer contamination. Because recovery is typically reported as a daily or weekly average, the step-wise degradation pattern within individual cycles is invisible — and the unit continues operating at declining efficiency until a planned maintenance window or a product purity alarm forces attention.
2–5% hydrogen recovery loss accumulates undetected over 6–12 months of adsorbent aging
Steam-to-Carbon Ratio Drift Creates Safety Exposure
The steam-to-carbon ratio in the reformer feed is the primary safety parameter preventing carbon formation on catalyst tubes. Instrument drift, control valve degradation, and feed composition changes all cause the ratio to shift over time. Without continuous validation against independent measurements, the ratio can drift below safe limits — creating carbon deposition that accelerates tube overheating and creates a potential tube rupture scenario.
Below 3.0:1 steam-to-carbon ratio enters the carbon formation risk zone — a recognized tube failure mechanism
Hydrogen Production Process: Where AI Monitoring Adds Value at Every Stage
Hydrogen production in a refinery is a multi-stage process where each stage's performance directly affects every downstream stage. A temperature excursion in the reformer changes the CO composition entering the shift converter, which affects the CO2 load on the PSA unit, which changes the hydrogen recovery rate and product purity. Monitoring these stages independently — as most DCS alarm systems do — misses the inter-stage relationships that provide the earliest indication of developing problems. iFactory's process analytics engine monitors all stages simultaneously and identifies when a deviation in one stage is creating a cascading effect across the production chain.
Scroll to explore process stages
1
Feed Gas Conditioning
Desulfurization and pretreatment to protect downstream catalyst from sulfur poisoning
H2S Level
Feed Temp
Flow Rate
2
Steam Methane Reformer
Primary reaction at 800–950C producing syngas in catalyst-filled tubes
Tube Metal Temp
Outlet Temp
S/C Ratio
Firing Rate
3
Shift Converter
High and low temperature shift reactors converting CO to CO2 with steam
Reactor Temp
CO Slip
Pressure Drop
4
PSA Purification
Pressure swing adsorption separating H2 from CO2, CO, CH4, and N2
H2 Purity
Recovery Rate
Cycle Time
5
Compression and Distribution
Product H2 compression and distribution to downstream consuming units
Discharge Pressure
Vibration
Bearing Temp
Catalyst Performance Analytics: Detecting Degradation Before It Becomes a Shutdown
Reformer catalyst degradation follows a predictable pattern — but only if you are tracking the right indicators at sufficient frequency and correlating them with operating conditions. The most reliable early indicator of catalyst deactivation is not the outlet temperature itself, but the rate of change in the firing rate required to maintain target outlet temperature as a function of throughput and feed composition. iFactory's catalyst performance analytics module tracks these derivative indicators and generates degradation trend projections that allow turnaround planners to schedule catalyst replacement at the optimal point in the operating cycle rather than reacting to an unexpected temperature excursion.
Pressure Drop Increase
55%
Methane Slip Increase
42%
Carbon Formation Risk
78%
Low Risk — Normal Operating Range
Moderate — Trend Monitoring Required
High — Immediate Attention Needed
Scroll to compare
Compressor and Recycle Gas System Health Monitoring
Hydrogen plant compressors — both make-up gas and recycle gas — operate under demanding conditions with hydrogen-rich gas at elevated pressures and temperatures. Hydrogen embrittlement, seal gas system upsets, and bearing lubrication degradation create failure modes that progress over weeks or months but can result in sudden catastrophic failure if not detected. iFactory monitors compressor health through a combination of vibration analysis, thermodynamic performance tracking, and seal system parameter validation that provides comprehensive coverage of the most common hydrogen compressor failure mechanisms.
Vibration Monitoring
Continuous vibration amplitude and frequency spectrum tracking on each bearing with trend analysis and correlation to process conditions like suction pressure and gas composition changes.
Alert Threshold: 2x baseline amplitude
Frequency: Real-time continuous
Bearing Temperature
Bearing pad and oil return temperature monitoring with rate-of-change detection to identify lubrication degradation, oil cooler fouling, or bearing wear progression.
Alert Threshold: 10C above normal range
Frequency: Real-time continuous
Seal Gas System
Seal gas differential pressure, buffer gas flow, and leakage rate monitoring to detect seal degradation before hydrogen leakage reaches flammable concentration thresholds.
Alert Threshold: 25% increase in seal gas use
Frequency: 1-minute scan cycle
Suction and Discharge Pressure
Differential pressure trending and polytropic head calculation to detect performance degradation from internal recirculation, impeller wear, or fouling.
Alert Threshold: 5% deviation from curve
Frequency: Real-time continuous
Gas Composition Impact
Molecular weight changes in recycled gas affecting compressor aerodynamic performance and surge margin — particularly during transition between operating modes.
Alert Threshold: 3% molecular weight shift
Frequency: Per online analyzer update
Surge Margin Tracking
Real-time calculation of operating point distance from surge line using actual performance data rather than design curves — critical during rate changes and upstream upsets.
Alert Threshold: Within 15% of surge point
Frequency: Real-time continuous
See How iFactory Monitors Your Hydrogen Unit in Real Time
iFactory's process analytics platform connects to your existing DCS and historian infrastructure to provide continuous AI-driven monitoring across the entire hydrogen production process — from feed conditioning through product compression. No new instrumentation required. Deployment in five weeks.
Predictive vs Reactive Monitoring: Cost and Reliability Impact on Hydrogen Units
The difference between predictive and reactive monitoring on a hydrogen unit is not incremental — it is structural. Reactive monitoring identifies problems after they have already affected production, meaning the cost includes both the repair and the lost production during the unplanned event. Predictive monitoring identifies the same problems during the development phase, allowing scheduled intervention that eliminates the production loss component entirely. The following comparison quantifies that difference across the most common hydrogen unit failure scenarios.
Without AI Monitoring
Catalyst degradation detected at alarm limits — 8–12 weeks of remaining life lost, forcing unscheduled catalyst change during non-optimal window
Compressor failure discovered on high-vibration trip — 3–7 day unplanned shutdown for bearing or seal replacement at peak hydrogen demand
PSA recovery decline invisible in daily averages — 2–5% hydrogen product loss accumulates over 6–12 months before discovery
Steam-to-carbon ratio drift undetected until carbon formation causes localized tube overheating and potential tube rupture scenario
Root cause analysis performed post-incident with limited data — corrective actions address symptoms rather than underlying failure mechanism
Estimated Annual Impact: $2M–$8M in unplanned shutdowns and production losses
With iFactory AI Monitoring
Catalyst degradation trend detected within 2–3 days of onset — replacement scheduled at optimal turnaround window with full remaining life utilized
Compressor vibration trend alerts generated 3–6 months before failure — maintenance scheduled during planned downtime with parts pre-ordered
PSA recovery rate tracked cycle-by-cycle — degradation quantified and projected to inform adsorbent replacement timing decision
Steam-to-carbon ratio validated against independent measurements continuously — drift detected and corrected before entering risk zone
Complete process data timeline available for every event — root cause analysis supported by correlated data across all process stages
Estimated Annual Savings: $1.5M–$6M in avoided shutdowns and optimized maintenance timing
Expert Perspective: What Hydrogen Unit Managers Gain from AI Process Analytics
The single most valuable thing I got from deploying AI monitoring on our hydrogen unit was not the alarm reduction — it was the confidence to extend our catalyst run. We had been changing reformer catalyst on a 24-month fixed schedule because we had no reliable way to project remaining life. After six months of iFactory tracking our firing rate trend, pressure drop progression, and tube wall temperature profiles, we could see with statistical confidence that the catalyst had at least eight more months of viable life. That eight-month extension meant we could align the catalyst change with our scheduled turnaround instead of doing a separate hydrogen unit shutdown. The scheduling flexibility alone was worth more than the software license for the next five years — and that is before counting the avoided production loss from not having an extra shutdown.
— Hydrogen Unit Superintendent, Gulf Coast Refinery · 22 Years Downstream Operations Experience · Responsible for 140 MMSCFD Steam Methane Reformer Complex
Frequently Asked Questions
What data sources does iFactory require to monitor a hydrogen plant?
iFactory connects to your existing DCS and historian infrastructure — no new field instrumentation is required. The platform ingests real-time process data including temperatures, pressures, flow rates, and compositions already available in your control system, along with compressor vibration data if your rotating equipment monitoring system provides a digital output. The typical hydrogen unit has 150–300 available data points that iFactory uses to build its process models and deviation detection algorithms.
Book a Demo to discuss your specific data infrastructure.
How does iFactory distinguish between normal process variation and an actual degradation trend?
iFactory builds a multivariable process model for each hydrogen unit that accounts for the normal relationships between operating parameters — for example, how reformer outlet temperature should respond to changes in feed rate, feed composition, and steam-to-carbon ratio under healthy catalyst conditions. When a parameter deviates from what the model predicts given current operating conditions — rather than just deviating from a fixed setpoint — the system identifies it as a potential degradation signal rather than normal variation. This contextual approach dramatically reduces false alarm rates compared to simple threshold-based monitoring.
Can iFactory monitor multiple hydrogen units or hydrogen-consuming units simultaneously?
iFactory is designed to monitor interconnected process units across a refinery complex, not just a single hydrogen plant. The platform can simultaneously monitor the hydrogen production unit, multiple hydrotreaters, hydrocrackers, and other hydrogen-consuming units — providing visibility into the hydrogen balance across the entire complex. This is particularly valuable when a hydrogen unit upset affects multiple downstream units simultaneously, as the platform can trace the production impact through the hydrogen distribution network in real time.
Contact our team to discuss multi-unit deployment.
How long does it take to deploy iFactory on an operating hydrogen unit?
iFactory typically deploys in five weeks from initial data audit to live platform, with historian integration completed in under seven days. The deployment process includes a data quality assessment, process model development using your unit's historical operating data, alert threshold calibration against your specific equipment and operating procedures, and operator training. The platform begins providing value from day one of live operation, with model accuracy improving over the first 4–6 weeks as the system learns your unit's specific behavior patterns under varying conditions.
Does iFactory replace our DCS alarm system or work alongside it?
iFactory works alongside your existing DCS alarm system — it does not replace it. Your DCS alarms continue to function as designed for safety-critical interlocks and hard equipment protection limits. iFactory adds a complementary layer of analytics-based monitoring that detects developing problems well before they reach DCS alarm thresholds — providing early warning that your DCS cannot deliver because it is designed for threshold-based alerting, not trend-based prediction. The two systems operate independently but the iFactory alerts can be configured to feed into your alarm management system if desired.
Hydrogen Plant Monitoring That Detects Problems Before They Become Shutdowns
iFactory's AI-driven process analytics platform gives your hydrogen unit operations team continuous visibility into catalyst health, compressor condition, PSA performance, and process safety parameters — connecting the signals across all production stages to identify developing problems days or weeks before they reach your DCS alarm thresholds.