A safety instrumented function is only as reliable as its last proof test says it is, and most SIS programs still rely on that test being right roughly once every one to three years. Between tests, a dangerous undetected failure in a transmitter, a logic solver, or a final element can sit quietly inside a safety loop that everyone believes is protecting the process, discovered only during the next scheduled test or, worse, during an actual demand. IEC 61511 assumes proof testing catches what it's designed to catch, but proof testing was never meant to be the only line of sight into how a SIS is actually performing between tests. See how AI-continuous SIS monitoring closes that visibility gap before a dangerous failure sits undetected until the next scheduled test.
Between Proof Tests, Most SIS Programs Are Flying Blind
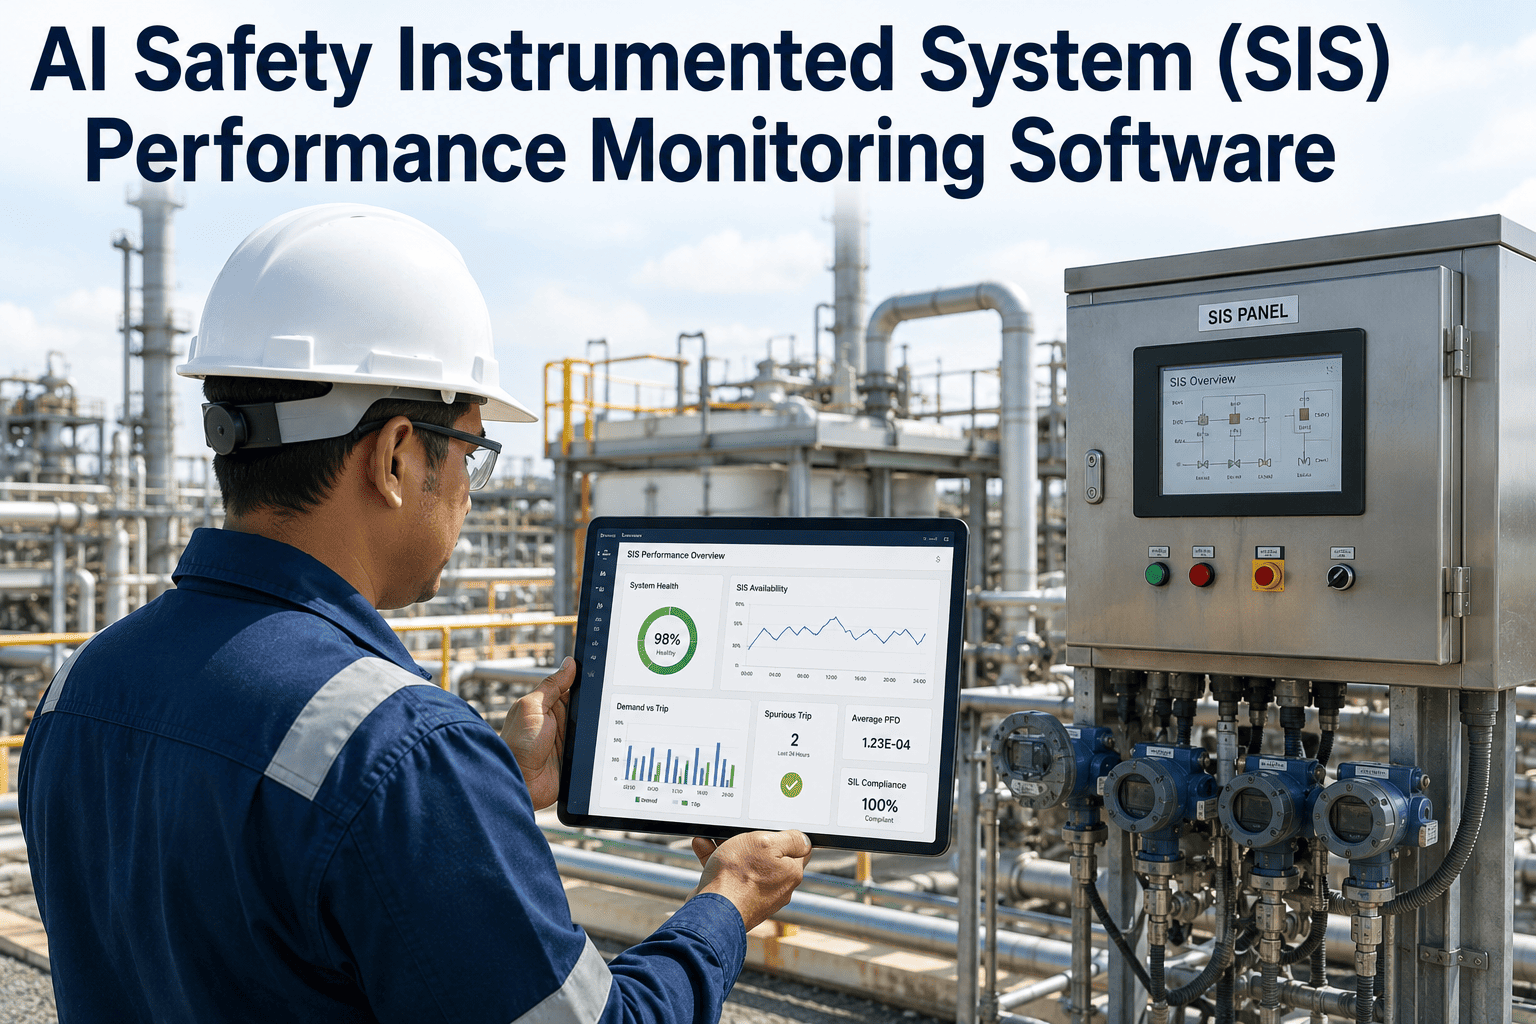
AI-driven SIS monitoring tracks proof test results, demand rates, and dangerous failure indicators continuously, giving safety engineers real visibility into SIL performance instead of a snapshot every one to three years.
Why Periodic Proof Testing Alone Leaves a Gap
Proof testing verifies a safety function works at the moment of the test. It says very little about what happens to that function's reliability in the months on either side of it.
of dangerous SIS failures are estimated to go undetected between scheduled proof tests in programs without continuous diagnostics
typical proof test interval for many safety instrumented functions, leaving a substantial blind window between verifications
of SIS demand rate deviations from design basis that go unnoticed until a formal SIL verification review is conducted
Where SIS Performance Data Actually Lives
A safety instrumented function's true performance is scattered across several separate records that rarely get reviewed together outside of a formal SIL verification cycle.
Proof Test Records
Pass/fail results, as-found and as-left conditions, and any deviations noted during each scheduled or partial-stroke test on every component in the safety function.
Actual Demand History
Every time the SIS actually activated, whether from a genuine process demand or a spurious trip, logged against the design basis demand rate assumed during SIL calculation.
Diagnostic & Health Data
Continuous diagnostic coverage from smart transmitters, logic solver self-diagnostics, and final element partial-stroke test results that flag drift or degradation between full proof tests.
Failure Category, Detection Method, and Typical Gap
Not every SIS failure mode is caught the same way, and knowing which detection method actually covers which failure category is central to understanding where the real coverage gaps sit.
See Which of Your SIFs Are Trending Off Their SIL Target
iFactory reviews your proof test history, demand log, and diagnostic data to show exactly which safety instrumented functions are drifting from their calculated PFDavg.
Periodic SIL Verification vs. Continuous AI Monitoring
A PFDavg Drift That a Calendar-Based Review Would Have Missed for a Year
A high-integrity pressure protection function had passed its scheduled proof test twelve months prior with no findings, and by calendar logic had another year before its next verification was due. Continuous diagnostic monitoring on the pressure transmitters in that loop showed a gradual output drift building over several months, still within the alarm deadband but consistently trending away from the redundant channel's reading. Correlated against the loop's actual demand history, which had also crept slightly above the design basis assumption used in the original SIL calculation, the combined trend pushed the function's estimated PFDavg close to the upper edge of its SIL 2 target well before the next scheduled test would have caught it. An unscheduled transmitter calibration check confirmed the drift and corrected it, keeping the function inside its verified integrity level instead of operating for months in a degraded state nobody could see.
Bringing Continuous Monitoring Into an Existing SIS Program
Phase 1 — SIF inventory and data audit
Existing SIL verification reports, proof test records, and demand logs for each safety instrumented function are compiled and checked for gaps before any continuous monitoring is added.
Phase 2 — Priority SIF selection
Functions with higher SIL targets, higher demand rates, or a history of findings during proof testing are brought under continuous monitoring first.
Phase 3 — Diagnostic and demand data integration
Smart transmitter diagnostics, logic solver health data, and the actual demand log are connected so PFDavg and demand rate trends update continuously rather than only at scheduled review points.
Phase 4 — Verification workflow integration
Flagged trends route into the existing functional safety management workflow, supporting rather than replacing the formal proof test and SIL verification process required under IEC 61511.
Common Gaps in SIS Performance Tracking
Treating Proof Test Pass as the Full Picture
A passed proof test confirms performance at that moment, not that the function will hold that performance until the next scheduled test.
Not Tracking Actual Demand Rate
A SIF's PFDavg calculation assumes a design basis demand rate that can drift significantly from actual field experience without anyone comparing the two.
Ignoring Available Diagnostic Coverage
Smart transmitters and logic solvers often generate continuous diagnostic data that goes unused if nobody is set up to trend it between proof tests.
Overlooking Common Cause Signals
Similar failure patterns appearing across redundant channels or similar SIFs can indicate a systemic issue that individual test records alone won't reveal.
Frequently Asked Questions
Does this replace formal proof testing or SIL verification?
No — proof testing and periodic SIL verification remain the required compliance activities under IEC 61511. Continuous monitoring adds visibility into the periods between those formal activities, surfacing trends that support a more informed verification review rather than substituting for it. Talk to a specialist about how this fits alongside your existing functional safety program.
How does the model estimate PFDavg drift between proof tests?
Continuous diagnostic data from smart transmitters and logic solvers, cross-channel comparison on redundant instruments, and actual demand history are combined to estimate how a safety function's real-world performance is trending relative to the PFDavg calculated at the last formal verification.
Can this detect a demand rate that has drifted from the design basis?
Yes — every actual SIS activation, genuine or spurious, is logged and compared against the design basis demand rate assumed in the original SIL calculation, flagging a function whose real-world demand rate has drifted enough to affect its risk reduction assumptions.
Does this work with existing smart transmitters and logic solvers?
The model connects to the diagnostic data already generated by most modern smart transmitters, logic solvers, and partial-stroke testing systems, so continuous monitoring typically builds on instrumentation already installed rather than requiring a hardware overhaul.
Which safety instrumented functions should be monitored first?
Functions with higher SIL targets, higher actual demand rates, or a history of findings during past proof tests carry the most value from continuous monitoring, since these are the functions where a performance gap has the greatest consequence. Book a demo to see how this maps to your specific SIF inventory.
Know How Your Safety Functions Are Performing Right Now
Book a 30-minute assessment. iFactory reviews your SIS proof test, demand, and diagnostic data to show exactly which functions are trending off their SIL target.