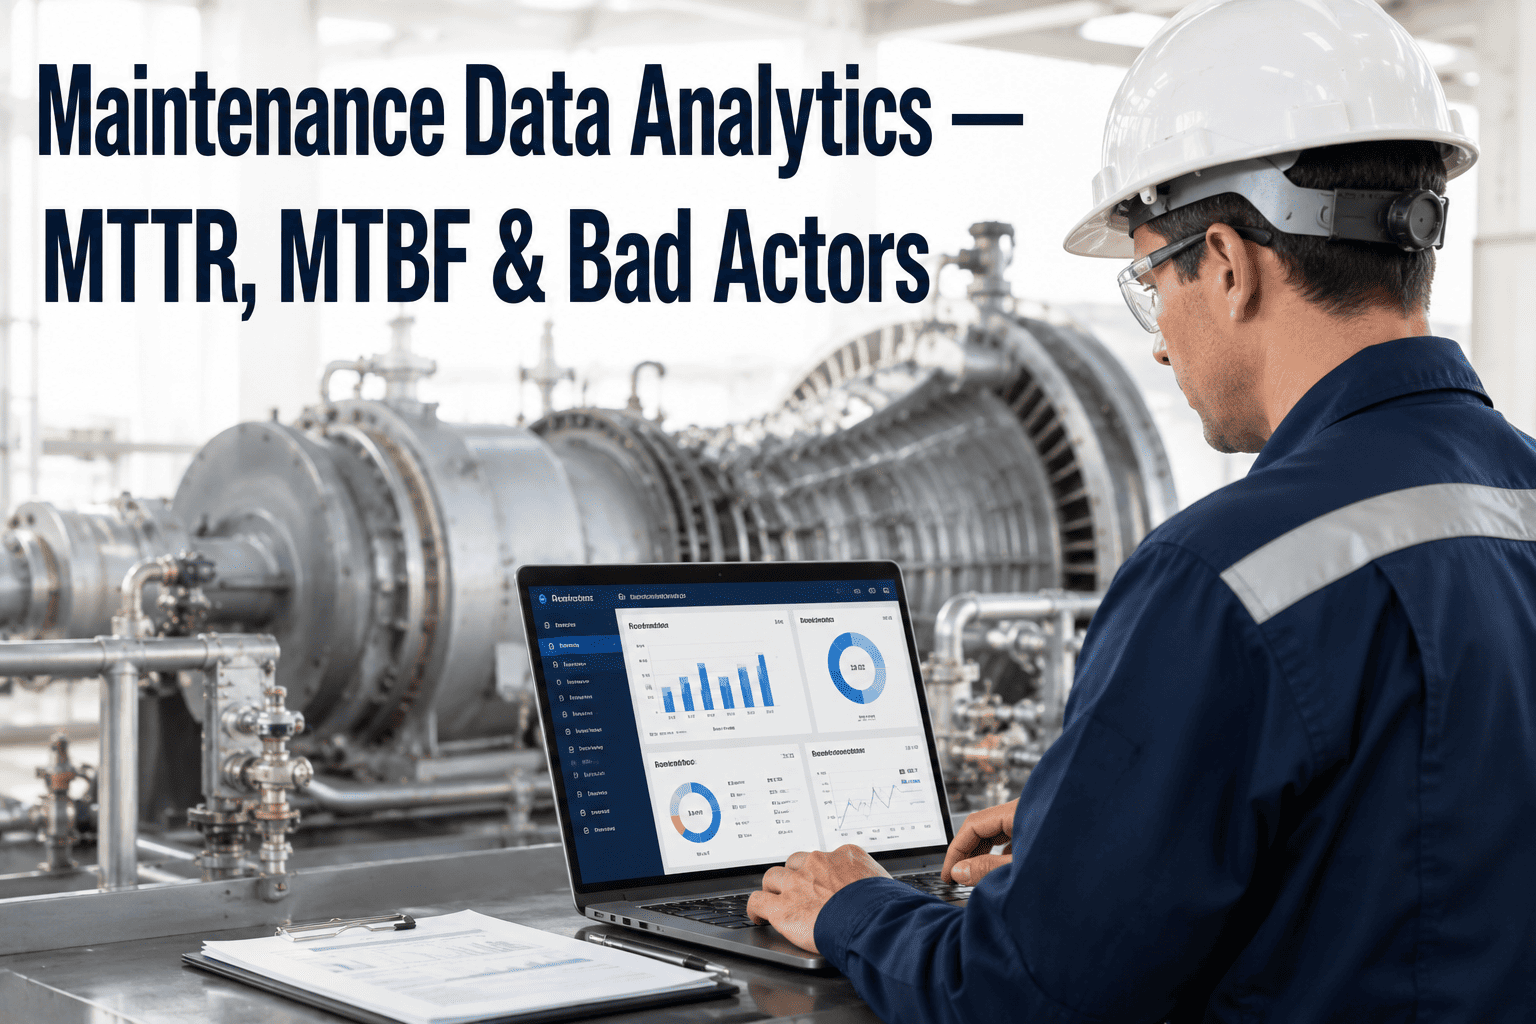
Every plant has a short list of equipment that eats a disproportionate share of the maintenance budget, and most reliability teams can name two or three of them from memory. The problem is the list in their head is usually built from whichever failure was loudest last month, not from what the CMMS data actually shows across a full year of work orders, parts spend, and downtime hours. A pump that fails quietly four times a year for small amounts each time can cost more than the compressor that failed once spectacularly and got everyone's attention. See how AI-ranked bad actor analysis changes your reliability priority list before the next budget cycle gets built on memory instead of data.
The Assets Draining Your Budget Aren't Always the Ones You Remember
AI-driven bad actor analysis ranks every asset in your CMMS by actual cost, downtime, and failure frequency, surfacing the chronic offenders that quietly outspend the dramatic failures everyone already knows about.
Why Bad Actor Analysis Pays Off Faster Than Most Reliability Initiatives
The Pareto principle shows up in almost every maintenance budget — a small share of assets consistently drives most of the cost, and finding them is usually a data problem, not an engineering one.
the typical split — roughly 20% of assets driving 80% of unplanned maintenance cost in most industrial fleets
higher cumulative cost for a chronic small-failure asset compared to its visible, single-event failure counterpart
of true bad actors identified only after formal ranking, not from a maintenance team's informal recollection
The Five Criteria a Real Bad Actor Score Needs
Ranking by cost alone misses assets with high safety exposure but modest repair bills. A defensible bad actor score weighs several dimensions together, not just the dollar figure that's easiest to pull from a report.
Maintenance Cost
Cumulative labor, parts, and contractor spend attributed to the asset over a rolling twelve-month window, weighted more heavily than a single large invoice.
Downtime Hours
Total production-impacting hours the asset caused, distinguishing between planned maintenance windows and unplanned stoppages that actually hurt output.
Failure Frequency
Number of discrete failure events in the period, which is where quietly chronic assets tend to score high even when each individual event looked minor.
Safety & Environmental Exposure
Any recorded near-miss, incident, or regulatory exposure tied to the asset's failure history, which can push a lower-cost asset up the priority list.
Repeat Failure Pattern
Whether the same failure mode is recurring on the same asset, a strong signal that a prior repair addressed the symptom rather than the root cause.
Get Your Fleet's Actual Bad Actor Ranking
iFactory pulls twelve months of CMMS work order, cost, and downtime history to rank every asset in your fleet by weighted bad actor score, not by memory.
Manual Spreadsheet Ranking vs. AI-Continuous Ranking
Finding the Pattern Behind a Chronic Bad Actor
Ranking an asset at the top of the list only answers half the question. The other half is why it keeps failing, and that answer usually hides in the free-text notes on dozens of past work orders.
Work Order Text Mining
Natural language processing scans historical work order descriptions for recurring terms — bearing, seal, misalignment — to cluster failures by likely root cause even when technicians used inconsistent wording.
Failure Mode Clustering
Grouping an asset's failure history by mode reveals whether it's one recurring problem being repeatedly patched or several unrelated issues, which call for very different fixes.
Cross-Asset Comparison
Comparing a bad actor against similar assets elsewhere in the fleet shows whether the problem is specific to that unit's installation or a design issue affecting the whole asset class.
Repair Effectiveness Tracking
Time-to-next-failure after each repair shows whether a fix is actually holding or whether the same failure mode is simply resetting the clock on a symptom-level patch.
The Bad Actor That Wasn't on Anyone's Radar
A mid-sized transfer pump had never triggered an emergency shutdown and had never come up in a monthly reliability meeting, so it sat well outside the maintenance team's informal watch list. A full-fleet ranking told a different story: the pump had accumulated seven separate seal-related work orders over twelve months, each individually small enough to look routine, but collectively placing it second in the entire fleet by total cost and fourth by downtime hours. Work order text mining showed every failure traced to the same root cause — a mechanical seal spec mismatched to the fluid's actual operating temperature range. Replacing the seal with the correct rated component ended the recurring pattern, and the asset dropped out of the top twenty within the following reporting period.
What Changes When Ranking Runs Continuously
Building a Bad Actor Program That Actually Runs
Phase 1 — CMMS data connection
Work order, cost, downtime, and asset hierarchy data is pulled from the CMMS to build the baseline ranking model across the full asset population.
Phase 2 — Scoring weight calibration
Cost, downtime, frequency, safety exposure, and repeat-pattern weightings are tuned to reflect your site's actual priorities, since a refinery and a food plant weight safety exposure very differently.
Phase 3 — Root cause pattern review
Top-ranked assets get a work order text mining pass to surface the likely failure mode cluster behind each one, giving reliability engineers a starting point instead of a blank investigation.
Phase 4 — Action tracking and re-ranking
Corrective actions are logged against each bad actor, and the ranking updates continuously to confirm whether the fix actually moved the asset off the list.
Common Mistakes in Bad Actor Programs
Ranking by Cost Alone
A cost-only ranking can bury a lower-spend asset with real safety or environmental exposure well below where it should sit on the priority list.
Building the List Once a Year
An annual ranking exercise misses new bad actors that emerge mid-cycle and can leave a resolved asset sitting on a stale list long after the fix worked.
Stopping at the Ranking
Identifying the top offenders without a structured root cause step just produces a list, not a reduction in recurring failures.
No Follow-Up Verification
Without tracking whether an asset's failure rate actually declined after a corrective action, there's no way to confirm the fix addressed the real root cause.
Frequently Asked Questions
How is the bad actor score actually calculated?
The score weighs cumulative maintenance cost, downtime hours, failure frequency, recorded safety or environmental exposure, and repeat failure pattern together into a single ranking, rather than sorting by any one dimension alone. Weightings are calibrated to reflect what matters most at your specific site. Talk to a specialist about how the weighting works for your fleet.
Can this identify the root cause behind a bad actor, not just flag it?
Yes — work order text mining clusters an asset's failure history by likely failure mode, surfacing whether the same root cause is recurring even when technicians described it differently across separate work orders, giving reliability engineers a starting point for investigation instead of a blank slate.
How often does the ranking update?
The ranking recalculates continuously as new work orders close in the CMMS, so a newly emerging bad actor gets flagged within the reporting period it starts trending rather than waiting for the next annual review cycle to surface it.
Does this work with our existing CMMS?
The model connects to your existing CMMS work order, cost, and asset hierarchy data rather than requiring a separate system, so bad actor rankings and corrective action tracking stay inside the same workflow your maintenance team already uses. Book a demo to see how it connects to your specific CMMS.
How is this different from a standard reliability dashboard?
Most reliability dashboards show cost and downtime by asset without weighting or clustering, leaving the interpretation to whoever is reading the report. This model produces a single ranked score plus a likely root cause cluster for each top-ranked asset, turning a data display into a prioritized action list.
Find Out Which Assets Are Actually Costing You the Most
Book a 30-minute assessment. iFactory ranks your fleet by weighted bad actor score and shows the likely root cause behind your top offenders.