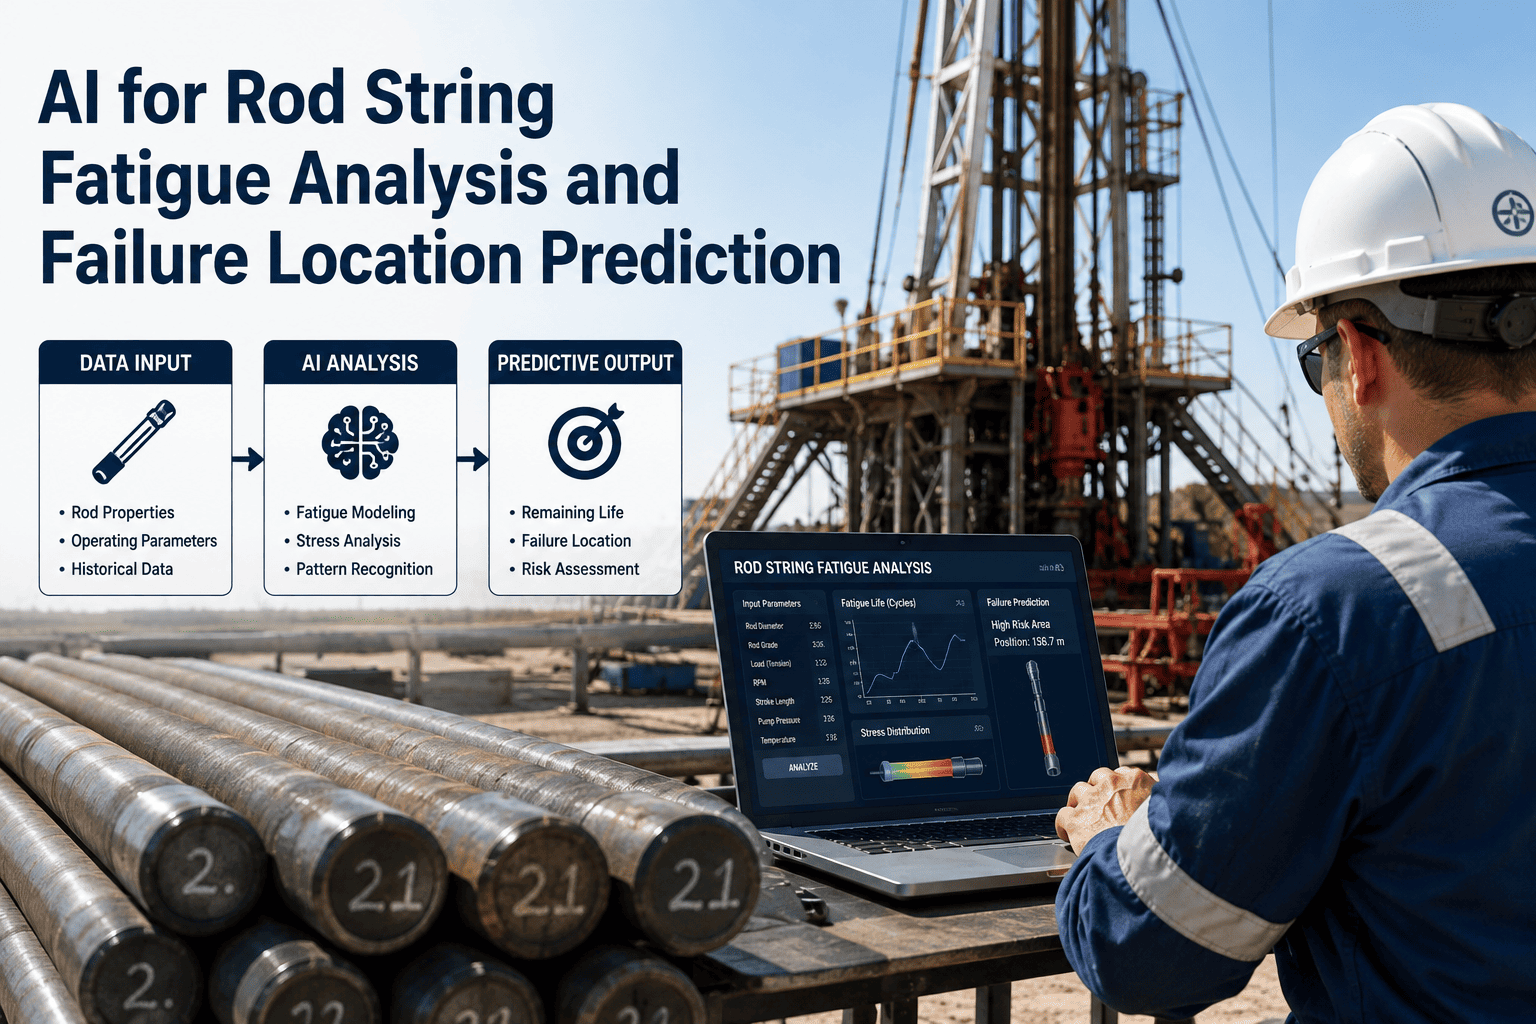
A sucker rod almost never breaks where the load is highest — it breaks where a stress raiser meets that load, which is usually a coupling thread, an upset end, or a corrosion pit hundreds or thousands of feet from where a static design chart would predict the peak stress to sit. Most rod string design still runs on API RP 11L calculations that size each taper section for average load, without tracking how coupling torque, corrosion exposure, and cyclic stress actually accumulate rod by rod over months of pumping. That gap is why a well can part a rod on schedule for years and then fail twice in one quarter with no obvious design change — the accumulated damage was always there, just invisible to a static allowable-stress table. AI-based fatigue modeling closes that gap by scoring every rod in the string individually against its own stress and corrosion history. Operators managing a rod-lift fleet can Book a Demo to see per-rod failure risk mapped against a real well's dynamometer history.
Why Static Rod Design Tables Can't Predict a Real Failure
API RP 11L design calculations do exactly what they were built to do — size a tapered rod string so that average stress on each section stays within an allowable range for the well's depth and load. What they were never built to do is track how that allowable margin actually erodes over months of cyclic loading, corrosion exposure, and connection wear on each individual rod. A string can be perfectly sized on paper and still part unexpectedly, because the failure that matters is rarely the average condition — it is the worst point on the worst rod, and that point moves over time in ways a static table cannot see.
Fatigue Happens Below the Design Stress
Most sucker rod breaks occur at stresses well below the rod's yield or tensile strength, driven by repeated loading at a stress raiser rather than a single overload event. A design table checking peak stress against allowable stress never sees this accumulating damage.
Coupling Connections Fail Differently Than the Rod Body
Threads on both the rod pin and the coupling act as stress raisers, and connection tightness itself is a variable — too loose and the joint gradually unscrews; too tight and fatigue at the thread root accelerates. Static design does not track individual joint torque history at all.
Corrosion Environment Varies Rod by Rod, Not Well by Well
H2S and CO2 exposure, fluid velocity in the annulus, and pitting don't distribute evenly along the string. A rod near a doglegged section or a gas pocket can carry a corrosion-fatigue risk many multiples higher than a rod twenty joints away in the same well.
The Cost of Treating Rod Failure as a Static Design Problem
Rod-lift fleets are large enough, and rod failures common enough, that even a modest improvement in predicting which rod and connection is closest to failure translates into meaningful savings across a field of wells.
Anatomy of a Rod String: Where Failure Risk Actually Concentrates
A rod string is tapered by design, with larger-diameter rods at the top carrying the combined weight of everything below and smaller-diameter rods at the bottom. Each zone carries a distinct load pattern, and understanding that pattern is the starting point for knowing where to look first.
Tension-Tension Cycling Under Peak Load
Largest-diameter rods here carry the full weight of the string and fluid column, cycling between high and low tension every stroke without ever going into compression. Failures concentrate at couplings and upset ends where thread stress raisers meet that repeated peak load.
Transitional Load, Highest Sensitivity to Deviation
Stress here is more sensitive to wellbore deviation and dogleg severity than the top taper, since side-loading against tubing accelerates wear at exactly the rod-to-coupling connections already carrying cyclic fatigue stress.
Tension-Compression Cycling and Buckling Risk
Smallest-diameter rods near the pump can go into compression on the downstroke if fluid load drops enough, risking buckling against the tubing wall. This zone is also where paraffin and scale buildup most commonly restrict rod movement and add unplanned load.
Couplings and Upset Ends, Regardless of Depth
Independent of taper position, every threaded connection and forged upset bead is a stress concentration point, and make-up torque quality at installation has an outsized effect on how long that specific joint survives cyclic loading.
The Data AI Fuses Into a Per-Rod Failure Score
A defensible per-rod risk score has to go beyond the static allowable-stress calculation that API RP 11L provides and incorporate how each rod's actual operating history has diverged from that baseline assumption.
Wave Equation Stress Distribution
Downhole load calculated from the surface dynamometer card through the wave equation, rather than the static assumptions built into a design-only calculation.
Cyclic Range and Stroke Count
Accumulated stress cycles per rod position, since fatigue damage compounds with cycle count in a way a single peak-stress check never captures.
Deviation and Dogleg Severity
Wellbore trajectory data flagging zones of side-loading that concentrate additional stress at specific joints along the string.
Coupling Torque History
Make-up torque recorded at installation and any subsequent workover, flagging joints made up outside the recommended range as elevated risk from day one.
Rod Grade and Connection Type
Material grade, upset design, and connection type per joint, since different rod materials and thread designs carry very different fatigue-resistance profiles under the same load.
Time in Service Since Last Inspection
Elapsed run time and cycle count since the last pull or visual inspection, weighted against known service life for the rod's grade and service environment.
H2S and CO2 Exposure
Produced gas composition and partial pressure data, since sour or high-CO2 service dramatically accelerates corrosion-fatigue crack growth at any existing stress raiser.
Service Factor and Inhibition Program
Chemical inhibition schedule and dosage history, feeding directly into the service factor applied to that well's allowable stress calculation.
Paraffin, Scale, and Fluid Velocity
Buildup and annular fluid velocity data that drive both erosion at rod-to-coupling surfaces and additional unplanned mechanical load on the string.
Static API RP 11L Design vs AI Per-Rod Fatigue Monitoring
API RP 11L design calculations remain the foundation for sizing a rod string correctly at the outset. AI fatigue monitoring does not replace that foundation — it tracks how each individual rod's actual condition diverges from the design assumption over the life of the well.
| Factor | Static API RP 11L Design | AI Per-Rod Fatigue Monitoring |
|---|---|---|
| Basis of the risk calculation | Allowable stress for the taper section, set at design time | Actual stress history plus corrosion and torque data, per individual rod |
| Resolution | One allowable-stress figure per taper section | An individual risk score for every rod and connection in the string |
| Corrosion environment | A single service factor applied uniformly across the whole string | Weighted per rod based on local gas exposure and inhibition history |
| Update frequency | Recalculated only when the string is redesigned or reconfigured | Continuously updated as new dynamometer and production data arrives |
| Failure location | Not predicted — design only confirms the string is within allowable range | Named rod position and depth flagged as highest risk, with a target replacement window |
Four Failure Modes, Four Different Warning Signs
Not every rod failure looks the same, and the sensor and history data that gives the earliest warning differs by failure mode. A useful model tracks each one separately rather than collapsing them into a single generic "rod risk" number.
Sudden Overstress in the Rod Body
Occurs when axial pulling force exceeds tensile strength, typically from an operational upset like a stuck pump or a fluid pound event rather than gradual wear, and usually shows up first as an abnormal dynamometer card shape before the break.
Cyclic Loading at a Stress Raiser
The most common failure type, driven by repeated loading at bends, mechanical damage, or thread roots well below yield strength, building slowly over months of cycle count accumulation.
Pitting That Becomes a Crack Origin
Corrosive pitting reduces the effective load-bearing cross-section and creates a crack origin point, accelerating dramatically in sour or high-CO2 service compared to an otherwise identical rod in a benign environment.
Thread Fatigue or Joint Unscrewing
Driven by make-up torque outside the recommended range in either direction — too loose and the joint gradually backs off, too tight and fatigue accelerates at the thread root under normal cyclic load.
Adding Per-Rod Fatigue Scoring Without Redesigning the String
Operators do not need to pull and redesign a rod string to add this. A phased rollout layers per-rod scoring on top of existing dynamometer and production data, refining accuracy as new pulled-rod inspections come in.
Build the Baseline String Model
Reconstruct each well's rod string configuration, grade, and connection type from existing records, and run the wave equation against current dynamometer cards to establish a per-rod stress baseline.
Layer In Corrosion and Torque History
Add produced gas composition, inhibition schedule, and any available coupling torque records from installation or workover, refining the risk score for wells with known corrosive service.
Validate Against Pulled-Rod Findings
Compare the model's highest-risk predictions against condition found on rods actually pulled during workovers, refining the scoring weights and building confidence before scheduling replacements from the score directly.
Common Mistakes When Managing Rod String Fatigue Risk
Operators managing large rod-lift fleets tend to repeat a small set of avoidable mistakes that leave failures looking random when they are actually predictable from data already being collected.
Treating the Whole Taper Section as One Risk Level
Applying a single allowable-stress figure uniformly across an entire taper section hides which specific rod and connection is actually closest to failure within that section, especially once deviation and corrosion introduce rod-to-rod variation.
Not Recording Make-Up Torque at Installation
Skipping torque documentation at rod running removes one of the strongest early predictors of connection failure, leaving no way to distinguish a properly made-up joint from one already at elevated risk from day one.
Applying One Corrosion Service Factor Fieldwide
Using a single service factor across an entire field ignores how much gas composition and inhibition effectiveness vary well by well, and even rod by rod within a well near a gas pocket or a dogleg.
Reacting Only After a Rod Parts
Waiting for a parted rod to trigger a workover means the well has already lost production and incurred the fishing and replacement cost that a scheduled, risk-driven replacement would have avoided entirely.
Frequently Asked Questions: AI Rod String Fatigue Analysis
Does this replace API RP 11L design calculations for new rod strings?
No — it builds on them. API RP 11L remains the correct method for sizing a new rod string against expected load and depth, and the AI fatigue model uses that same design baseline as its starting point. What the model adds is tracking how each individual rod's actual operating history diverges from that design assumption over time, which a one-time static calculation was never built to do. Operators wanting to see how the two fit together can contact iFactory Support for a walkthrough against a current well design.
What data do we need before the model can produce a useful per-rod score?
At minimum, the model needs the rod string configuration and grade per section, surface dynamometer card history, and basic produced fluid composition data. Coupling torque records and deviation survey data improve accuracy significantly but are not required for a meaningful first-pass score. Wells with incomplete records typically start with a coarser risk ranking and refine it as pulled-rod inspection findings come in.
How accurate is the failure location prediction in practice?
Accuracy depends on how much historical stress, torque, and corrosion data exists for a given well, and improves meaningfully once several pulled-rod inspections have validated the model's predictions against actual field condition. The model produces a ranked risk list by rod position rather than a single yes-or-no answer, so even an imperfect prediction still tells a planner where to look first during the next workover.
Can this help distinguish tensile failures from fatigue or corrosion-fatigue failures?
Yes — the model tracks these failure modes separately because each one has a different data signature. A tensile overload risk shows up in an abnormal dynamometer card pattern tied to an operational upset, while fatigue and corrosion-fatigue risk build gradually from cycle count and gas exposure data over months, and the model flags each rod against the failure mode its own history actually points toward.
How many wells does a fleet need before this becomes worth deploying?
Even a single well with a meaningful dynamometer and workover history can produce a useful per-rod risk score, but the value compounds across a fleet, since patterns learned on wells with similar rod grade, depth, and corrosive service transfer to newer or less-instrumented wells in the same field. Operators managing more than a handful of rod-lift wells typically see the clearest return. Fleets ready to scope a pilot can Book a Demo to review what data is already available across their wells.