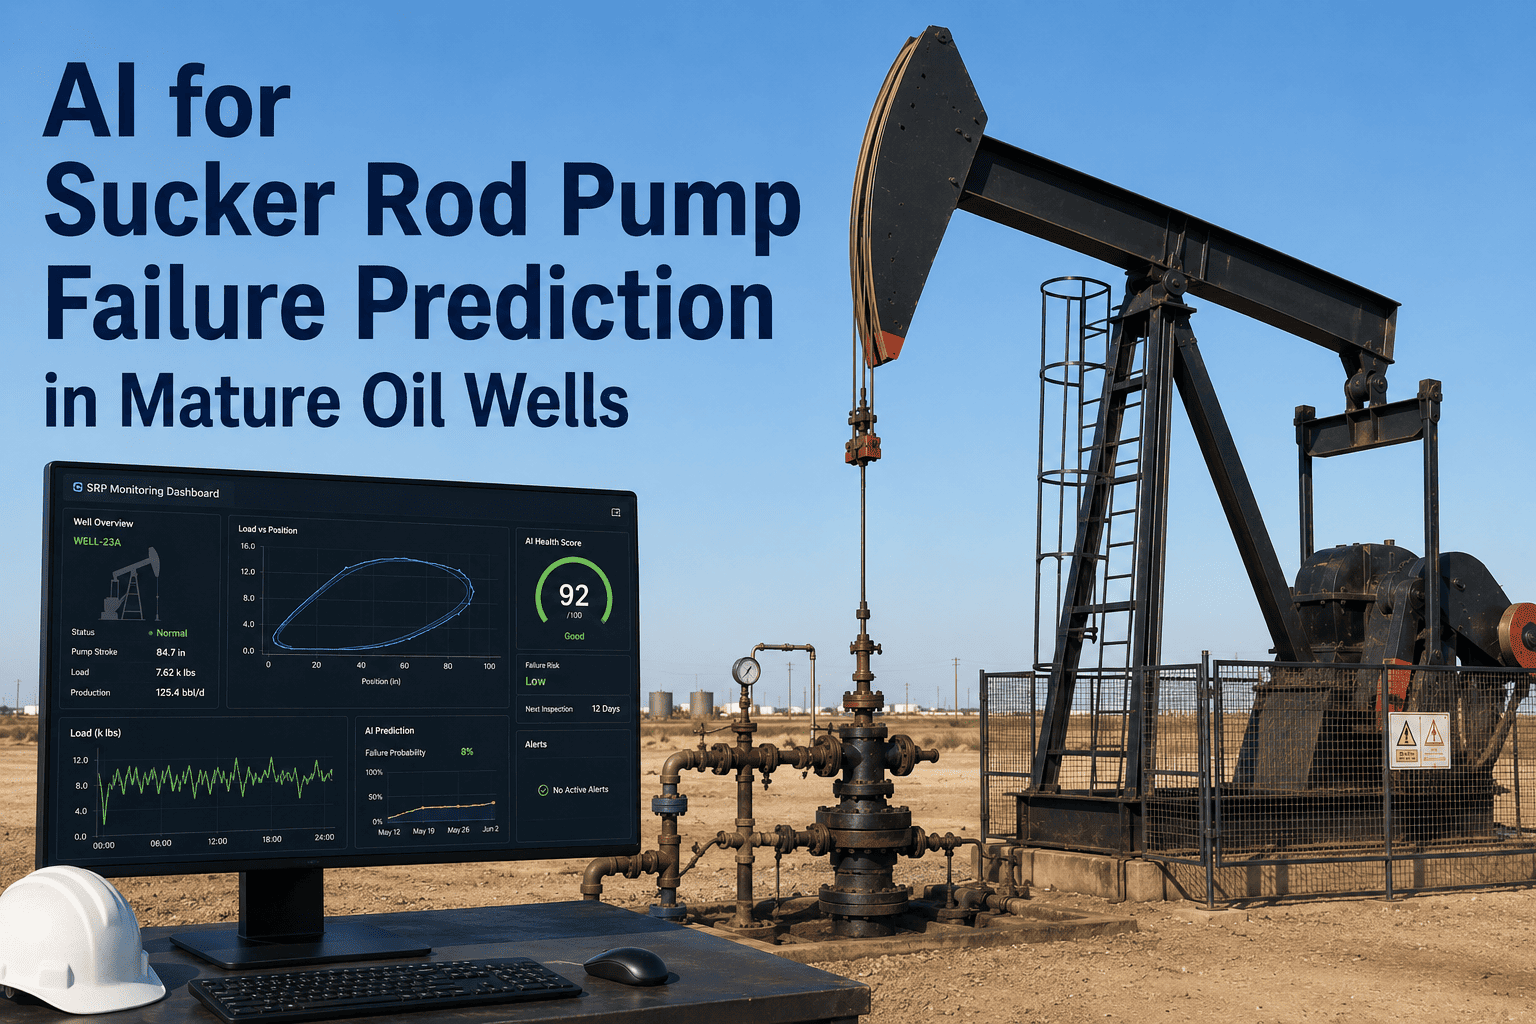
Sucker rod pumps drive the majority of artificial lift in mature oil fields, and their failure rate is the single largest controllable expense in upstream operations. Every rod parting, tubing leak, or pump wear event forces a workover that costs between fifteen and fifty thousand dollars in rig time, tubing and rod replacement, and lost production during the downtime. Most operators still run these pumps on time-based maintenance schedules or react to failures after production has already dropped to zero, because the volume of dynamometer and motor current data generated across hundreds of wells makes manual pattern recognition impossible at scale. AI models trained on polished rod load and position data can detect the subtle geometric shifts in dynamometer cards that indicate developing gas locks, rod leaks, or pump wear weeks before a catastrophic failure occurs. iFactory analyzes your surface and downhole card data continuously to prioritize workovers based on actual pump health rather than calendar intervals or dropped production alarms.
Your rod pumps are failing on a schedule. That schedule is costing you a fortune.
iFactory uses AI to analyze dynagraph cards, motor current, and polished rod load data to predict sucker rod pump failures 2 to 4 weeks before they happen, cutting workovers and protecting production.
What actually happens to your P&L when a rod pump fails
The direct cost of a workover rig is only the visible portion of the total financial impact when a sucker rod pump fails unexpectedly. The cascading costs extend across multiple operational budgets and are amplified by the deferral of oil revenue that cannot be recovered once the reservoir pressure at that horizon has been affected by the shutdown. Understanding the full cost structure of a single failure event is the first step toward justifying the investment in predictive analytics, because the AI model does not need to prevent every failure to deliver a positive return on investment. It only needs to convert a fraction of your reactive failures into planned, scheduled workovers to pay for itself.
When a failure is predicted and the workover is scheduled, the rig mobilization can be coordinated with other wells in the area, tubing and rod inventory can be verified before the crew arrives, and the well can be optimized or re-completed during the same trip. The same physical workover that costs thirty to fifty thousand dollars as an emergency response can often be executed for twenty to thirty percent less when it is planned, and the lost production is minimized because the well is pulled before the pump completely fails and the fluid level climbs to the surface.
Calendar-based maintenance cannot account for changing well conditions
The traditional approach to rod pump management in mature fields is to establish an average run life based on historical data, typically twelve to eighteen months, and schedule pulls for every well on that interval regardless of its actual condition. This method assumes that all wells degrade at a consistent rate, which ignores the massive variability in operating conditions across a mature field. Wells in the same field can experience completely different failure modes based on gas-oil ratio fluctuations, paraffin deposition rates, corrosion severity in specific casing strings, and sand production from localized formation breakdowns. Time-based pulling guarantees two negative outcomes simultaneously: you are pulling wells that have months of run life remaining, and you are missing wells that are about to fail well before the calendar interval arrives.
Run to Failure
The well produces normally until the pump breaks, the rod parts, or the tubing leaks. Production drops to zero, an alarm triggers, and an emergency workover is dispatched. This maximizes lost production and drives the highest total cost per failure because every event is unplanned and resources are allocated reactively.
Time-Based Pulling
Workovers are scheduled at fixed intervals based on average historical run life. Some wells are pulled prematurely, wasting the remaining useful life of the downhole equipment. Other wells fail before the scheduled pull date, incurring the same reactive costs the calendar was supposed to prevent. Overall workover count increases while failure reduction is marginal.
Condition-Based Monitoring
Engineers review dynamometer cards and production trends periodically to identify degrading pumps. This improves on calendar-based pulling but is limited by human review capacity. An engineer can deeply analyze maybe ten to twenty wells per day, leaving hundreds of wells in the fleet unmonitored for days or weeks at a time.
AI Predictive Failure Detection
Machine learning models analyze every stroke of every pump in real time, comparing current dynamometer card geometry against learned baselines and known failure signatures. Subtle deviations that are invisible to human reviewers are detected and flagged weeks before the failure occurs, enabling precise, prioritized workover scheduling.
Motor current and polished rod load tell the complete downhole story
Predicting rod pump failures requires high-frequency data from two primary surface measurements: the load on the polished rod and the position of the polished rod through the stroke cycle, which combine to form the surface dynamometer card, and the electrical current drawn by the prime mover, which forms the power card. These two data sources, sampled at sufficient frequency to capture the details of the stroke cycle, contain signatures for virtually every common rod pump failure mode. The challenge is not acquiring the data, because most modern SCADA systems already collect it, but in processing and interpreting the massive volume of card images generated by hundreds of wells pumping several strokes per minute around the clock.
Measures the force transmitted to the downhole pump
The load cell on the polished rod measures the upward and downward forces throughout the stroke. During the upstroke, the rod string must lift the fluid column, creating peak load. During the downstroke, the fluid load transfers to the tubing, and the rod string descends under its own weight. Changes in the peak load, minimum load, and the shape of the load transition between upstroke and downstroke reveal the mechanical condition of the pump and the fluid conditions inside it.
Measures the precise travel distance of the rod string
Position sensors track the exact movement of the polished rod from the top of the stroke to the bottom. When combined with the load data, position creates the geometric boundary of the dynamometer card. Variations in stroke length, changes in the timing of the load reversal, and deviations in the shape of the top and bottom of the card path are critical features that machine learning models use to classify the operating state of the pump.
Measures the power required to drive the pumping unit
The electrical current drawn by the motor reflects the torque required to crank the beam through the stroke cycle. Motor current is inherently noisier than polished rod load because it includes the inertial effects of the beam, counterweights, and gear reducer, but it provides an independent confirmation of the load patterns seen on the dynamometer card and is available on wells where load cells are not installed.
Removes the rod string effect to see the pump itself
By applying the wave equation to the surface load and position data, the system calculates what the dynamometer card looks like at the pump intake, stripping out the elastic stretch and dynamic effects of the rod string. The downhole card is the most direct indicator of pump condition, showing exactly what the plunger and traveling/standing valves are experiencing during each stroke.
How AI sees what human reviewers miss on a dynamometer card
A trained artificial lift engineer can look at a dynamometer card and identify obvious failure modes like a gas-locked pump or a broken rod. However, the early-stage indicators of these failures, the subtle geometric shifts that occur days or weeks before the card shape becomes obviously abnormal, are extremely difficult for a human to detect consistently across a large fleet of wells. AI models excel at this specific task because they can compare the current card against the historical baseline for that specific well and measure deviations of a few percent in area, gradient, or shape that precede a failure. The visual below represents the progression of card geometry as different failure modes develop, showing the transition points where AI detects the anomaly before it becomes visible to manual review.
The key advantage of AI in this application is not the ability to identify a severely gas-locked pump, which any competent engineer can do. The advantage is the ability to identify the pump that is two percent closer to gas lock today than it was yesterday, and to project that trajectory forward to predict exactly when the pump will cross the threshold from operational to non-operational. This early detection window is where the economic value of predictive maintenance is captured, because it provides the time needed to schedule the workover, mobilize the rig, and execute the pull without losing production.
Stop pulling pumps that have months of life left while missing the ones about to fail
iFactory watches every stroke of every well and flags the specific pumps that are degrading, giving your workover scheduler a prioritized list based on actual downhole physics.
AI distinguishes between failure modes that require different interventions
Not all rod pump failures require the same workover plan. A rod parting requires fishing or rod replacement. A gas lock might be resolved by adjusting the gas anchor or changing the pump speed. A worn valve requires a pump change but the rod string and tubing may be in good condition. If the predictive system only tells you that a failure is coming without identifying the failure mode, the workover crew still has to diagnose the problem after the rig is on site, which wastes rig time and limits the ability to pre-stage the correct replacement equipment. iFactory classifies the predicted failure mode alongside the failure probability, allowing the production engineer to make intervention decisions before the rig arrives.
| Failure Mode | Card Signature | Predicted Lead Time | Intervention Strategy |
|---|---|---|---|
| Traveling Valve Leak | Rounded top corners on downhole card, reduced area | 3 to 5 weeks | Schedule pump change, verify tubing and rod condition |
| Standing Valve Leak | Rounded bottom corners on downhole card, early load drop | 3 to 5 weeks | Schedule pump change, verify seating nipple condition |
| Rod Parting | Sudden reduction in card area and peak load, erratic shape | 1 to 2 weeks | Prepare fishing tools and rod tally, prioritize immediately |
| Gas Lock | Severe area reduction on downhole card, near-zero fillage | 2 to 4 weeks | Evaluate gas anchor, adjust speed, chemical injection review |
| Fluid Pound | Sharp bottom load spike on downhole card, erratic downstroke | 2 to 3 weeks | Adjust pump depth, speed, or spacing to match inflow |
| Tubing Leak | Decreased polished rod load, increased strokes per minute | 1 to 3 weeks | Prepare tubing tally, evaluate corrosion program |
| Paraffin / Scale Friction | Increasing card hysteresis width, higher peak load over time | 4 to 6 weeks | Schedule chemical treatment or hot oiling before workover |
From raw SCADA streams to actionable workover priorities
iFactory integrates with your existing SCADA infrastructure to ingest high-frequency polished rod load, position, and motor current data, then applies a multi-stage processing pipeline that transforms raw sensor streams into classified failure predictions with specific confidence intervals. The pipeline is designed to handle the real-world data quality issues that plague oilfield SCADA, including sensor drift, communication dropouts, and varying sample rates across different wellsite controllers, without generating false positive failure alerts when the data is temporarily degraded.
Data Ingestion and Cleaning
Raw load, position, and current data is ingested from SCADA at stroke-level resolution. Bad data points caused by communication errors, sensor spikes, or shutdown periods are identified and filtered using statistical quality checks before any card calculations begin, preventing garbage data from triggering false failure predictions.
Stroke Segmentation and Card Calculation
Continuous data streams are segmented into individual pump strokes using the position sensor zero-crossing points. For each stroke, the surface dynamometer card is generated, and the wave equation is applied to calculate the downhole card at the pump depth, stripping out the rod string dynamics to isolate the actual pump behavior.
Feature Extraction
Over fifty geometric features are extracted from each surface and downhole card, including card area, perimeter, peak loads, minimum loads, load at polished rod position markers, card slope, curvature at critical points, and the ratio of downhole area to surface area. These features form the numeric fingerprint that the ML model evaluates.
Baseline Learning and Anomaly Scoring
The model establishes a rolling baseline of normal card geometry for each individual well, accounting for seasonal production changes and speed adjustments. Each new stroke is compared against this well-specific baseline, and an anomaly score is calculated that measures how far the current card has deviated from the learned normal behavior.
Failure Mode Classification
When the anomaly score exceeds the warning threshold, the classification model analyzes the specific pattern of deviation to identify the most probable failure mode. The output includes the failure type, confidence level, and the rate of degradation, which determines how quickly the condition is worsening.
Workover Prioritization Queue
Predicted failures are ranked in a prioritized queue that balances the failure probability, the estimated time to failure, the production rate at risk, and the rig availability in the area. The production engineer sees a ranked list of wells to pull, with the predicted failure mode and recommended intervention for each.
What the rod pump module tracks across your mature well fleet
Live fleet health dashboard
Every well in the fleet displayed with a current health status derived from the most recent card analysis. Wells are color-coded by health state, allowing the production engineer to see the overall fleet condition at a glance and immediately identify the wells requiring attention.
Surface and downhole card gallery
Historical and current surface and downhole cards for every well, searchable by date range and filterable by failure mode classification. Engineers can visually inspect the cards that triggered an alert and compare them against the baseline to validate the model prediction.
Failure probability timeline
For each flagged well, a timeline showing how the anomaly score has evolved over the past thirty to ninety days, projecting the trajectory forward to the estimated failure date. This timeline is the primary input for workover scheduling decisions.
Run life tracking by failure mode
Actual run life measured from workover to failure, segmented by failure mode, pump type, rod configuration, and operating conditions. This data identifies the systemic causes of short run life in your field, enabling engineering fixes that prevent failures entirely.
Workover cost and production impact analysis
Tracks the actual cost of every workover performed, including rig time, materials, and lost production, and correlates it against whether the failure was predicted or reactive. This analysis quantifies the direct financial return of the predictive maintenance program.
SCADA and workover system integration
Connects directly to your existing SCADA historians for data ingestion and can push workover recommendations to your field ticketing or workover management system, closing the loop between AI detection and field execution.
What operators achieve after deploying AI-driven rod pump monitoring
What a rod pump AI pilot needs to succeed
High-frequency polished rod load and position data
The minimum data requirement is polished rod load and position sampled at a minimum of 50 Hertz, which is standard on most modern rod pump controllers. Motor current data is valuable but not strictly required if load and position are available at sufficient resolution.
6 to 12 months of historical SCADA data
The model needs historical data to establish the well-specific baselines and to learn the failure signatures that have occurred in your field. More historical data, particularly data that spans multiple failure events, produces more accurate initial models.
Workover history with failure cause documentation
Historical workover records that document what was found downhole when the pump was pulled are essential for training the model to associate specific card signatures with specific failure modes in your specific operating environment.
8 to 12 week pilot on 50 to 100 wells
The pilot covers model training on historical data, validation against known failures, deployment in shadow mode to compare AI predictions against actual well performance, and refinement of alert thresholds based on engineer feedback.
On-premise or cloud-hosted deployment
iFactory can be deployed on plant-network hardware for operators with data residency requirements, or hosted in a secure cloud environment for faster deployment and reduced internal IT burden.
Artificial lift engineer involvement in model tuning
The most successful deployments involve close collaboration between the iFactory data science team and your artificial lift engineers during the pilot phase, ensuring the model classifications align with your field-specific failure terminology and intervention practices.
AI for sucker rod pumps, explained plainly
Every well you pull on a calendar is either wasting money or risking a reactive failure
iFactory replaces guesswork with data by analyzing your dynamometer cards to predict exactly which pumps are failing and when. Book a demo and see your fleet health through AI.