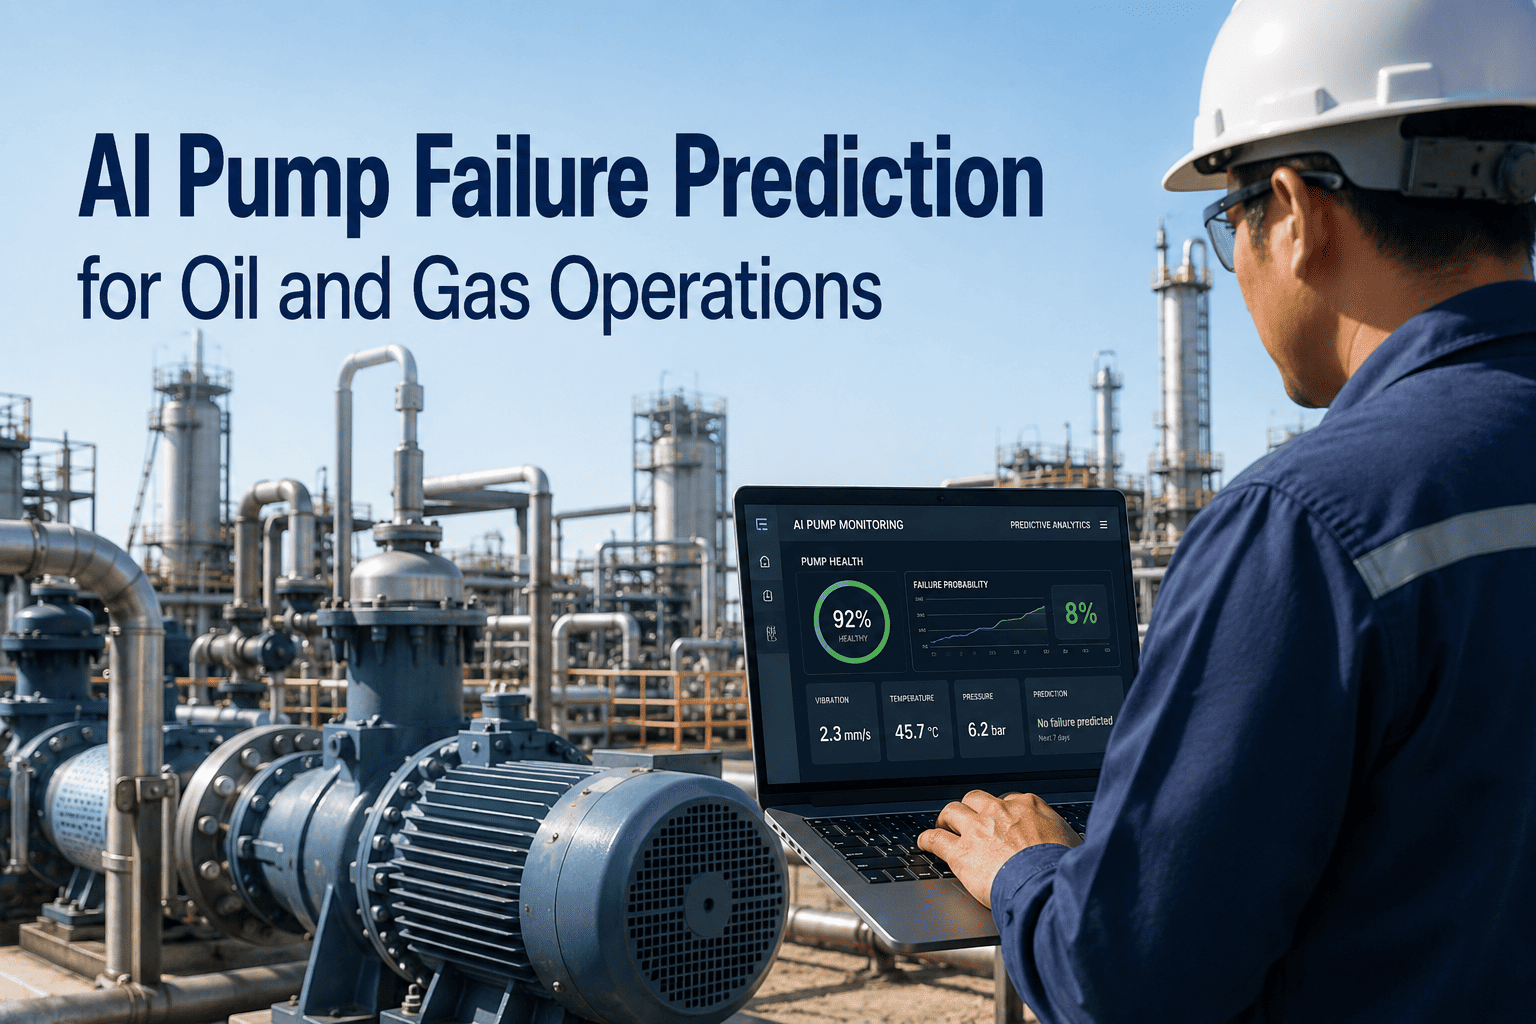
A centrifugal pump almost never fails without warning, it just doesn't warn anyone who happens to be watching. Bearing wear shows up in a vibration signature weeks before a hot bearing seizes. A weakening mechanical seal shows up in leak rate and case pressure before it lets go. Early cavitation shows up as a faint pulsation in motor current before the gravel-in-a-blender sound anyone on the floor can hear. The problem was never that pumps fail silently, it's that the signals live on different sensors nobody is correlating in real time. AI pump failure prediction reads vibration, temperature, motor current, and process data together and tells you which pump is heading for trouble, weeks before the pump room does. Get a pump reliability demo to see it running against your own asset list.
The Root Causes Behind Most Pump and Seal Failures
Reliability studies of centrifugal pump failures keep landing on the same handful of culprits. Poor lubrication, vibration-driven wear from misalignment or imbalance, and cavitation together account for the overwhelming majority of pump and seal failure events, and seal or bearing failure alone is the single largest category across all pump failure types. None of these causes appear out of nowhere. Each one builds gradually inside data your plant is probably already collecting, just not connecting.
of all centrifugal pump failures trace back to mechanical seal or bearing failure
of pump and seal failure events are linked to poor or insufficient lubrication
of failure events are driven by component vibration from imbalance or misalignment
of pump and seal failures are attributed to cavitation from insufficient suction head
Five Signals Your Pump Is Already Sending
None of these failure modes announce themselves on day one. They show up first as small, gradual shifts in signals your instrumentation is already producing, long before anyone would call it an alarm. The AI model's job is to notice the shift before a human would.
Vibration Signature
Radial and axial vibration trends flag early imbalance, misalignment, and bearing wear well before amplitude crosses a fixed alarm threshold.
Motor Current Signature
Current waveform analysis reveals cavitation pulsations, bearing sidebands, and impeller wear without touching a single rotating part.
Bearing Temperature
Slow temperature drift, not just a hot alarm, is tracked against normal operating baselines to catch lubrication and load problems early.
Suction Pressure & NPSH Margin
Net positive suction head margin is tracked continuously so a shrinking cushion is flagged well before cavitation starts eroding the impeller.
Seal Leak Rate & Case Pressure
Gradual increases in leak rate or seal chamber pressure are trended to catch a weakening mechanical seal before it fails outright.
From First Signal to Scheduled Repair: The Prediction Window
The value of predictive maintenance is entirely in the gap between when a failure becomes detectable and when it becomes catastrophic. Reactive maintenance operates in that last narrow window, if it operates at all. AI models trained on your pump's own operating history routinely flag developing failures seven to twenty-one days out, wide enough to plan the repair, order the part, and schedule the crew instead of pulling everyone off another job for an emergency.
Subtle drift begins in vibration or current signature. Invisible to a fixed threshold alarm.
AI model flags the pattern as a developing failure mode and assigns a maintenance priority.
Work order generated in the CMMS with parts, failure mode, and recommended repair window.
Reactive path: the pump fails here, unplanned, mid-shift, with no parts staged.
Reactive and Time-Based Maintenance vs AI Failure Prediction
Most pump fleets still run on a mix of run-to-failure and calendar-based preventive maintenance. Both approaches miss the same thing: actual equipment condition. Here is how the two philosophies compare across the decisions that matter most to a maintenance team.
Swipe left to see the full comparison
Know Which Pump Fails Next, Before It Does
iFactory connects to the vibration, thermal, and process sensors you already have and ranks every pump in your fleet by failure risk, not by whoever complained last.
Inside the iFactory Pump Reliability Platform
The platform is built to answer one question every reliability engineer asks every morning: which pump needs attention first. These are the capabilities that make that question answerable in seconds instead of a walk-down.
Failure Mode Classification
Models trained on your pump's own history identify the likely failure mode, whether it's bearing wear, misalignment, cavitation, or seal degradation, not just a generic alarm.
Cavitation Risk Scoring
NPSH margin, suction pressure, and motor current pulsation are combined into a live cavitation risk score for every monitored pump.
Seal Leak Prediction
Leak rate and seal chamber pressure trends are tracked to flag a weakening mechanical seal weeks before it lets go on shift.
Maintenance Priority Ranking
Every monitored pump is ranked by failure risk and production criticality, so the team always knows which unit to work on first.
Fleet Health Dashboard
One screen shows the condition of every pump across the site or across multiple facilities, with drill-down into the specific signal driving each alert.
CMMS Work Order Integration
Predicted failures generate work orders automatically, with failure mode, recommended parts, and repair window already attached.
From Sensor Signal to Work Order: How It Connects
Predicting a pump failure is only useful if the prediction reaches the people who schedule the repair. iFactory connects the sensor layer on the pump all the way to the work order in your CMMS, so nothing gets lost translating a vibration chart into an action.
Vibration, Thermal & MCSA Sensors
Wired and wireless vibration, temperature, and motor current sensors stream continuous condition data, often reusing instrumentation already installed on critical pumps.
SCADA, DCS & Historian
Process context, flow rate, discharge pressure, and suction conditions are pulled from the historian via OPC UA or Modbus TCP to correlate condition signals with operating state.
CMMS & ERP Work Orders
Predicted failures write directly into the CMMS as prioritized work orders with asset history and recommended parts attached. Talk to a specialist about your CMMS integration before scoping a rollout.
What Changes When Every Pump Is Predicted, Not Discovered
Facilities that move from reactive and calendar-based maintenance to AI failure prediction see the shift in the numbers within the first few months. Here is the typical before-and-after on a monitored pump fleet.
Perspective From the Field
We had three ESPs and a dozen centrifugal transfer pumps, and we genuinely did not know which one was going to fail next. It was always a surprise. Now the dashboard ranks every pump by risk, and when one starts drifting we get a work order with the likely failure mode attached before anyone hears a strange noise. We planned our first seal replacement two weeks ahead of time instead of pulling a crew off another job at midnight.
— Carlos Bennett, Maintenance Manager, Permian Basin Gathering Facility
typical advance warning before a predicted pump failure occurs
typical prediction accuracy once models are trained on your pump's own history
typical reduction in unplanned downtime on a monitored pump fleet
Frequently Asked Questions
What sensors does AI pump failure prediction actually need to work?
Most implementations use vibration sensors, bearing or case temperature sensors, and motor current signature analysis, along with process data such as suction pressure, discharge pressure, and flow rate already available in your historian. Many facilities already have some of this instrumentation installed; the platform adds the correlation and prediction layer on top rather than requiring a full sensor replacement. Book a demo and bring your current instrumentation list so we can map what is reusable.
Can it tell the difference between cavitation, misalignment, and bearing wear?
Yes. The models are trained to recognize the distinct signatures each failure mode leaves in vibration frequency, motor current pulsation, and temperature trend, so the alert includes a likely failure mode rather than a generic condition warning. This lets the maintenance team prepare the correct parts and procedure before the crew is even dispatched, instead of diagnosing on arrival.
Does this work on electric submersible pumps as well as centrifugal transfer pumps?
Yes. The same motor current, vibration, and temperature approach applies to ESPs, identifying pump wear, gas locking, and scale buildup weeks before failure, in addition to surface centrifugal and positive displacement pumps. Talk to a specialist about the specific pump types and duty classes in your fleet.
How is this different from the fixed vibration alarm thresholds we already use?
Traditional condition monitoring relies on a static threshold set by a manufacturer or engineer, which only triggers after a value is already abnormal. AI failure prediction learns your specific pump's normal operating pattern and flags subtle drift away from that baseline, often weeks before a fixed threshold would ever be crossed, while also identifying which failure mode is developing.
How long does it take to see results after rollout on a pump fleet?
Most facilities see measurable reductions in unplanned downtime and emergency repairs within the first 90 days, with full return on investment typically realized within four to eight months depending on fleet size and existing maintenance practices. Book a scoping call to get a timeline built around your specific pump count and criticality.
Stop Finding Out About Pump Failures From the Pump
Book a 30-minute scoping call and iFactory will map your pump fleet, existing instrumentation, and CMMS to a rollout plan built around your highest-risk assets first.