The dynamometer card is the most information-dense diagnostic instrument available to a rod pump production engineer — and the most underutilized. Every stroke of a sucker rod pump generates a surface dynamometer card that encodes the complete mechanical state of the rod string, the pump, and the downhole fluid conditions into a load-versus-position plot that a trained eye can read like a medical ECG. Gas interference distorts the card shape in a way that is immediately recognizable once you know what to look for. Fluid pound creates a characteristic impact signature at the bottom of the stroke. Parted rods produce a collapse in the upper load trace that no other failure mode replicates. Worn pump standing valves leave a specific leakoff signature in the upper right quadrant. The problem in most U.S. rod pump operations is not that this diagnostic intelligence is unavailable — it is that the card analysis is done manually, infrequently, and only after a problem is obvious enough to trigger a site visit. iFactory's AI-driven dynamometer card analysis platform changes this by processing surface and downhole card data continuously across an entire rod pump fleet, classifying card shapes against a trained failure signature library, and generating prioritized intervention recommendations before the well loads fluid, kills the prime mover, or requires a costly workover. Book a Demo to see how continuous dyno card diagnostics deploy across your sucker rod fleet in weeks.
Reading the Card: What Each Dynamometer Signature Tells You About Your Well
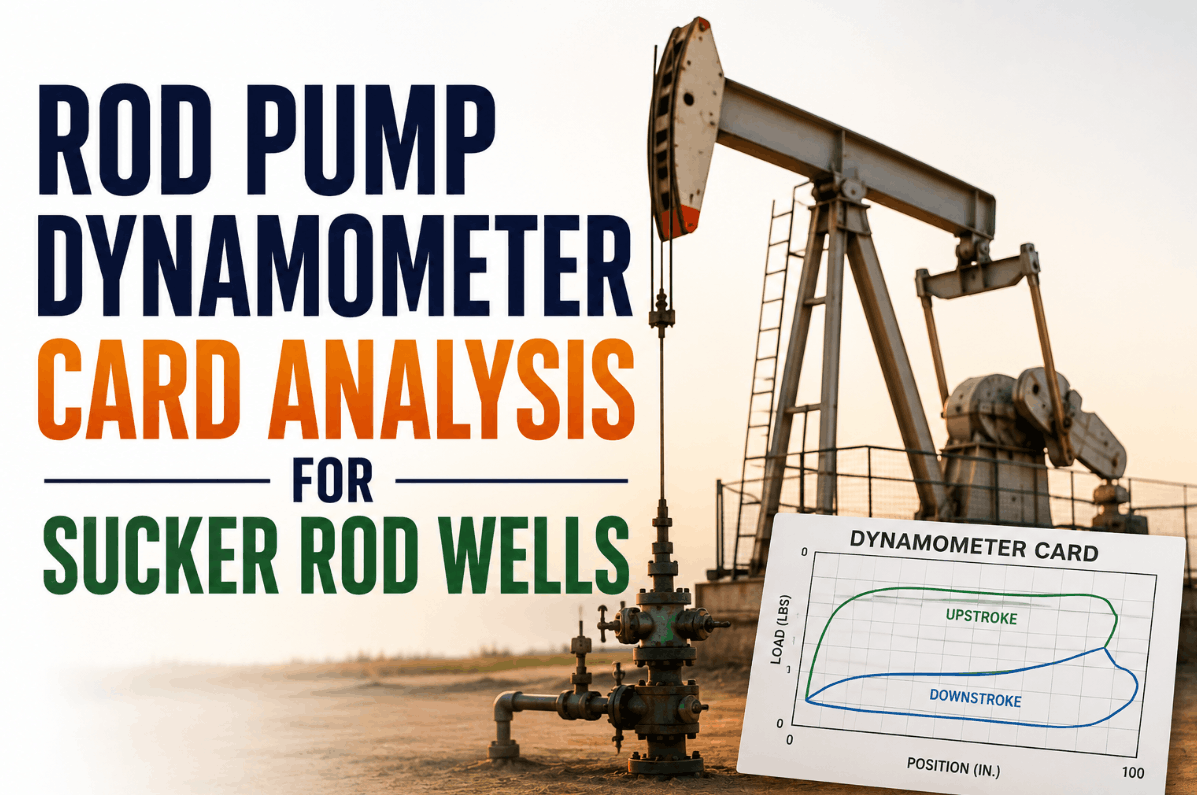
A normal rod pump dynamometer card has a recognizable parallelogram shape — load rises on the upstroke as the rod string picks up the fluid column, holds near maximum through mid-stroke, then drops on the downstroke as the fluid transfers to the tubing above the pump. Any deviation from this shape is diagnostic. The art — and the bottleneck — in manual card analysis is knowing which deviation maps to which failure mode. Book a Demo to see how iFactory's signature library maps to your specific pump configuration and fluid conditions.
Surface Card vs. Downhole Card: What Each Reveals and Why Both Matter
The surface dynamometer card and the synthetic downhole card derived from it through wave equation analysis serve different diagnostic purposes. Understanding what each reveals — and where each can mislead — is fundamental to accurate rod pump diagnosis.
| Diagnostic Dimension | Surface Dynamometer Card | Synthetic Downhole Card (Wave Equation) |
|---|---|---|
| Data Source | Load cell and position transducer at the polished rod — direct measurement of surface load and stroke position | Computed from surface card using wave equation model of the rod string — not a direct measurement |
| Pump Fill Diagnosis | Fluid pound visible as bottom-of-stroke impact signature, but masked by rod string dynamics in deep wells | Directly shows pump intake conditions — pump fillage percentage computed from plunger load at bottom of stroke |
| Valve Leakage Detection | Traveling and standing valve leakoff visible in upper and lower right quadrant deformation — requires experience to quantify | Valve leakoff isolated from rod elasticity effects — cleaner separation of valve condition from rod dynamic effects |
| Rod String Condition | Rod part immediately visible as load collapse. Rod friction shows as hysteresis in card width | Rod friction losses subtracted by wave equation — pump card cleaner for pump diagnosis but masks rod condition signals |
| Gas Interference | Visible as compressed lower-left area but distorted by fluid column weight and rod elasticity in deep wells | Directly reveals pump barrel gas content as reduced pump displacement vs. theoretical full-fillage stroke volume |
| Accuracy Dependencies | Direct measurement — accurate regardless of rod string model quality | Accuracy depends on rod taper data, fluid weight, and damping coefficient accuracy in the wave equation model |
| iFactory Integration | Ingested directly from SCADA, controller, or portable dyno unit — no model input required | Computed by iFactory's wave equation engine from surface card plus well data from your CMMS or well file |
The iFactory Dyno Card Analysis Workflow: From Raw Card to Work Order
Manual dynamometer card review in a 50-well rod pump field typically means a production engineer spending 30–40 hours per month pulling cards, opening analysis software, and making written notes that may or may not reach the workover scheduling team before the well fails. iFactory replaces this workflow with a continuous, automated pipeline that processes every card from every well and delivers prioritized action items to the engineer's dashboard. Book a Demo to see how iFactory's workflow maps to your SCADA and controller infrastructure.
Continuous Card Data Ingestion from Controllers and SCADA
iFactory connects to your rod pump controllers — Lufkin Sam, Weatherford's RPC, Echometer units, and SCADA historian platforms — via OPC-UA or Modbus TCP, ingesting surface load and position data on a stroke-by-stroke basis. No portable dyno unit visits required for routine monitoring. Historical card archives are ingested during onboarding to baseline each well's normal card shape before anomaly detection activates.
Wave Equation Processing for Synthetic Downhole Card Generation
iFactory's wave equation engine processes each surface card against the well's rod taper design, fluid gravity, and tubing configuration — producing a synthetic downhole card that isolates pump condition from rod dynamic effects. Rod taper and well data are imported from your CMMS or well file system during integration; updates to well configuration propagate automatically to the model without manual re-entry.
AI Failure Signature Classification Against Trained Library
Both the surface and downhole card are processed by iFactory's convolutional neural network, trained on a failure signature library spanning fluid pound, gas interference, parted rods, worn valves, rod buckling, pump-off, and tubing leak patterns. The model outputs a failure mode classification with a confidence score, a deviation severity rating, and a comparison of the current card against the well's established normal envelope — giving the engineer both the diagnosis and the evidence to support it.
Trend Analysis and Deterioration Rate Quantification
Single-card classification catches acute failures. Trend analysis catches progressive degradation before it becomes acute. iFactory tracks pump fillage percentage, peak polished rod load, minimum rod load, and card area across every stroke and plots the trend against configurable intervention thresholds — identifying wells where valve wear or progressive fluid pound is deteriorating at a rate that places them in a workover window 30, 60, or 90 days out.
Prioritized Work Order Generation and CMMS Integration
Diagnostic findings auto-generate prioritized work orders in your CMMS — SAP PM, IBM Maximo, or Infor EAM — with failure classification, card evidence images, trend charts, and recommended intervention type attached to each order. Emergency classifications (parted rods, severe pump-off) generate immediate alerts to the on-call engineer's mobile device. Scheduled intervention recommendations integrate with the workover rig scheduling calendar to optimize crew deployment across the well fleet.
Manual Card Review vs. Continuous AI Analysis: Performance Comparison
The following comparison reflects measured outcomes from rod pump fleets operating under manual card review programs versus continuous iFactory AI dyno card monitoring — aggregated across Permian Basin, Mid-Continent, and Appalachian Basin sucker rod operations.
| KPI | Manual Card Review Program | iFactory Continuous AI Analysis | Improvement |
|---|---|---|---|
| Card Review Frequency | Monthly or on-demand site visit | Every stroke, 24/7 | From monthly to real-time |
| Fluid Pound Detection Lead Time | Detected after couplings or valves fail (4–8 weeks post-onset) | Detected within 24–72 hours of first impact signature | 4–8 week earlier intervention |
| Parted Rod Response Time | Hours to days (operator notices production drop or abnormal sound) | Minutes (card collapse triggers immediate alert) | From hours to minutes |
| Pump Fillage Tracking | Spot measurement at site visit — no trend data between visits | Continuous stroke-by-stroke fillage percentage — full trend history available | Continuous vs. periodic |
| Engineer Time per Well per Month | 45–90 minutes (card pull, analysis, documentation) | 5–10 minutes (review AI findings, approve work orders) | 85% time reduction |
| Average Workover Cost per Event | $35,000–$80,000 (reactive — mechanical damage accumulated) | $12,000–$28,000 (planned — intervention before damage escalates) | 40–60% cost reduction |
Pump Fillage Optimization and SPM Adjustment: Closing the Control Loop
Accurate dyno card analysis enables more than failure detection — it enables active pump optimization. When iFactory computes real-time pump fillage from the downhole card, it can identify wells that are over-pumped (fillage below optimal, risking fluid pound) or under-pumped (fillage near 100%, leaving reservoir inflow potential uncaptured). This information drives two operational improvements: automated SPM adjustment recommendations based on current fillage, and well-level inflow performance recalibration that keeps the pump operating at peak efficiency as reservoir conditions change. Book a Demo to see how iFactory's fillage-based speed optimization integrates with your VFD infrastructure.
"We operate 87 rod pump wells across three fields, and our previous card review process was genuinely broken. We had one production engineer manually pulling cards on maybe 20% of the fleet each month — the other 80% ran unmonitored between site visits. iFactory connected to our Lufkin Sam controllers in about two weeks and started processing cards on every well every stroke. In the first 30 days, it flagged 11 wells with developing fluid pound, 3 with valve leakoff trending toward failure, and 2 with card signatures that turned out to be parted rods we had not detected yet. We would have found those parted rods eventually — after the rod strings had been pounding the pump for another week. Now we pull workovers on schedule, not in response to emergencies, and our average workover cost dropped 44% in the first year."
Conclusion: The Dyno Card Is Already Doing the Diagnostic Work — AI Makes Sure It Gets Read
The dynamometer card has been the definitive rod pump diagnostic instrument since the 1960s. The failure modes it reveals — fluid pound, gas interference, parted rods, worn valves, rod buckling — have not changed. What has changed is the ability to read every card from every well on every stroke, classify the shape against a failure signature library in milliseconds, and deliver a prioritized intervention recommendation to the engineer before the failure progresses to a workover event. That capability did not exist in a practical, fleet-scale form until AI-driven card classification platforms made continuous monitoring economically viable across a rod pump fleet of any size. The wells in a manual review program that run unmonitored between site visits are not invisible — they are generating diagnostic data on every stroke. iFactory makes sure that data is being used. Book a Demo to quantify how many failure events your current review program is missing between site visits.
Rod Pump Dynamometer Card Analysis: Frequently Asked Questions
Q: What rod pump controllers does iFactory connect to for dyno card data ingestion?
iFactory integrates with Lufkin Sam, Weatherford RPC, Echometer, and other major rod pump controller brands via OPC-UA or Modbus TCP, as well as SCADA historians including OSIsoft PI and Aspentech IP21 — covering the full range of controller platforms common in U.S. Permian Basin, Mid-Continent, and Appalachian rod pump operations.
Q: Does iFactory's wave equation model require a current rod taper design to generate accurate downhole cards?
Yes. Downhole card accuracy depends on current rod taper, fluid gravity, and tubing ID data — iFactory imports this from your CMMS well files during onboarding and flags wells where design data is incomplete or outdated, prioritizing those wells for data validation before synthetic card analysis is activated.
Q: Can iFactory distinguish fluid pound from gas interference on the surface card in a deep well where rod dynamics mask the pump signal?
In deep wells where rod elasticity heavily distorts the surface card, iFactory's wave equation-derived downhole card provides the primary pump diagnosis — the synthetic pump card cleanly separates fluid pound impact signatures from the gas compression pattern that appears similar at the surface but resolves distinctly at the pump intake depth.
Q: How does the platform handle wells that transition between pump-off and normal fillage throughout the day?
iFactory classifies every individual stroke, building a fillage distribution histogram across the pump cycle that distinguishes genuinely intermittent wells from wells that have cycled into fluid pound — enabling the platform to recommend pump-off controller setpoint adjustments rather than SPM changes for wells with normal intermittent behavior.
Q: What is the typical deployment timeline from controller integration to live card analysis?
Controller integration and initial card ingestion typically complete within 1–2 weeks; AI model baseline establishment from historical card archives and activation of failure classification alerts follow within 30 days of live data collection — with no portable dyno equipment or manual card pulls required during or after deployment.