On a typical onshore well, every barrel of crude can arrive with three, five, sometimes ten barrels of produced water riding along with it — brine, dispersed oil droplets, dissolved solids, and trace solids that all have to be separated, treated, and either injected, reused, or discharged before the water can leave the production system. The deoiling and treatment train that handles that volume is not a single piece of equipment — it is a sequence of separation stages, each one removing a narrower band of oil droplet sizes and suspended solids than the one before it, and each one only as effective as its weakest-performing unit on any given day. Produced water treatment failures rarely show up as a single dramatic event. They show up as a slow creep in oil-in-water concentration that nobody notices until a compliance sample comes back high or an injection well starts losing injectivity. This guide walks through the deoiling technology stack — hydrocyclones, induced gas flotation, walnut shell filtration, and membrane bioreactors — and how iFactory AI's monitoring platform gives water treatment teams continuous visibility into how each stage is actually performing.
The Deoiling Train: Why No Single Technology Does the Whole Job
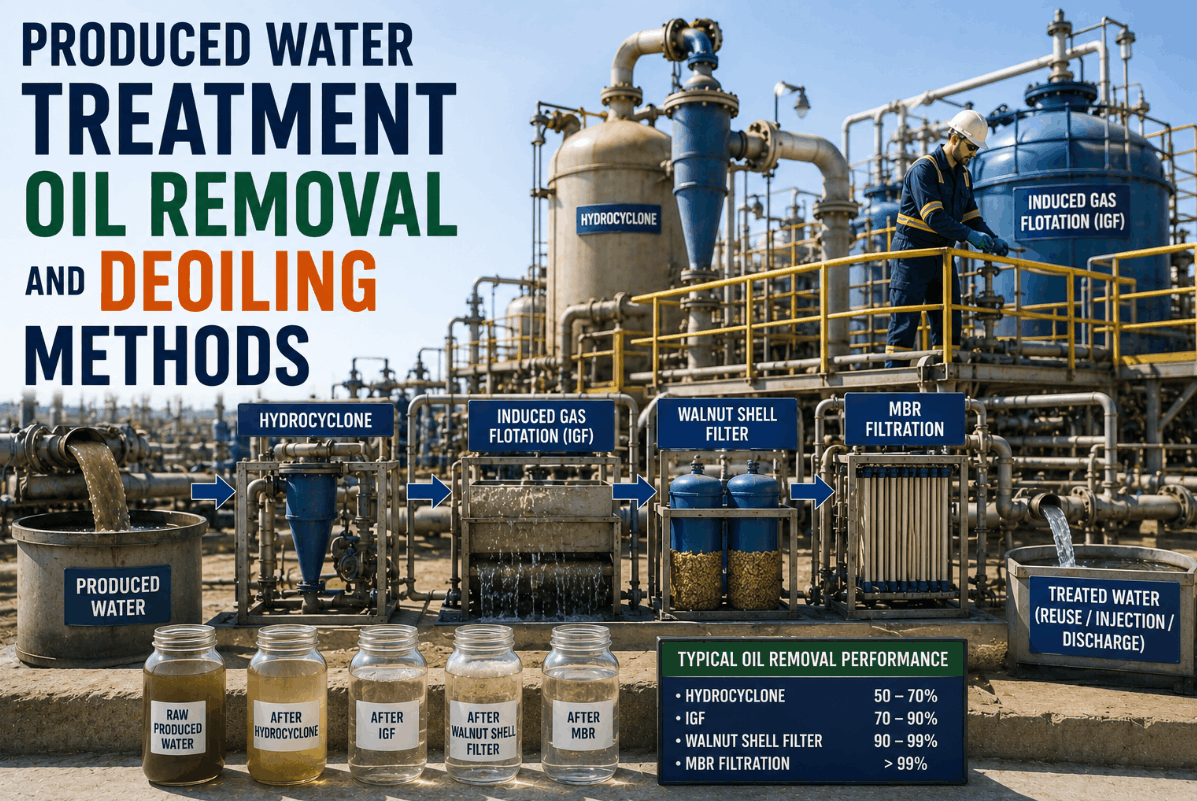
Raw produced water leaving the free water knockout or primary separator typically carries somewhere between 1,000 and 2,000 ppm of dispersed oil, along with suspended solids and free gas. No single deoiling technology is designed to take that stream all the way down to injection-grade or discharge-grade quality in one pass — each stage in the train is built to remove a specific droplet size range, and the stages are sequenced from coarse to fine. Primary deoiling hydrocyclones typically bring inlet concentrations of several hundred to several thousand ppm down into the 10 to 100 ppm range, depending on droplet size distribution and feed pressure. Secondary flotation and tertiary filtration stages then polish that effluent further, targeting the smaller, harder-to-separate oil droplets and any residual suspended solids that hydrocyclones cannot capture by density separation alone. Book a Demo to see how iFactory tracks performance across every stage of this train in one dashboard, rather than as disconnected equipment readouts.
- Oil-in-water trends reviewed manually from lab logs, often days after the sample was drawn
- Hydrocyclone backpressure ratio adjusted reactively after performance has already drifted
- Walnut shell filter backwash scheduled on a fixed timer, not actual breakthrough condition
- IGF chemical dosing tuned by operator experience, inconsistent across shifts
- Compliance exceedances discovered at the discharge sample point, after the fact
- Oil-in-water concentration trended continuously across every stage of the train
- Hydrocyclone split ratio and backpressure monitored against the performance envelope in real time
- Walnut shell filter backwash triggered by differential pressure and breakthrough signature
- IGF dosing recommendations generated from inlet oil load and droplet condition data
- Compliance risk flagged upstream — before water reaches the discharge or injection point
Hydrocyclones and IGF: Primary and Secondary Separation Performance
Deoiling hydrocyclones remain the workhorse of primary produced water treatment because they separate oil from water using nothing but pressure-driven centrifugal force — no moving parts, no chemicals required to function. Feed water enters tangentially and spins at high velocity inside the liner; the density difference between oil and water drives oil droplets toward the core while cleaner water is pushed to the wall and exits as the underflow. Performance depends heavily on the reject-to-feed split ratio, the pressure drop ratio across the liner, and the droplet size distribution arriving at the inlet — which is why two hydrocyclones running identical feed concentrations can produce very different effluent quality if their operating ratios have drifted out of design range. Induced gas flotation units pick up where hydrocyclones leave off, introducing fine gas bubbles that attach to the smaller oil droplets hydrocyclones cannot separate by density alone, lifting them to the surface for skimming across multiple cells in series.
Disposition Pathways: Injection, Reuse, and Discharge Quality Requirements
Where treated produced water goes next determines how far down the treatment train the water actually needs to travel — and that decision has a direct effect on both treatment cost and equipment loading. Disposal wells generally tolerate higher residual oil and solids than a discharge permit or a beneficial reuse application will allow, which is why many operators run hydrocyclones and IGF alone for injection streams but add walnut shell filtration or membrane treatment when the same water is destined for surface discharge, irrigation, or reuse in completions operations. Choosing the wrong endpoint for a given water quality — or running a treatment train tuned for injection-grade water through a reuse application — is one of the most common sources of unplanned non-compliance and equipment strain. Book a Demo to see how iFactory routes performance data against the specific disposition requirement for each water stream.
Predictive Monitoring: Where Deoiling Performance Actually Degrades
Deoiling equipment rarely fails outright — it degrades gradually, and the degradation is almost always visible in the operating data well before it shows up in a lab sample. A hydrocyclone liner with internal erosion produces a widening split ratio and a falling pressure drop ratio long before its outlet oil concentration crosses a compliance threshold. A walnut shell bed approaching breakthrough shows rising differential pressure and shortening run times between backwash cycles. iFactory's monitoring platform ingests the operating parameters that actually predict these failure modes — not just the periodic lab samples that confirm them after the fact.
| Equipment | iFactory Monitoring Parameters | Degradation Mode Detected | Typical Warning Lead Time |
|---|---|---|---|
| Deoiling Hydrocyclone | Split ratio, pressure drop ratio, inlet/outlet oil-in-water | Liner erosion, scale buildup, vortex finder wear | 5–15 days |
| IGF Cells | Bubble generation rate, skim rate, dosing-to-load ratio | Eductor or rotor wear, chemical dosing drift | 3–10 days |
| Walnut Shell Filter | Differential pressure, run length between backwash, effluent turbidity | Media fouling, channeling, premature breakthrough | 2–7 days |
| MBR Membrane Modules | Transmembrane pressure, flux decline rate, permeability trend | Membrane fouling, biological upset, cleaning inadequacy | 4–12 days |
This shift from periodic lab confirmation to continuous parameter trending is what allows a treatment team to correct a drifting hydrocyclone split ratio or schedule a walnut shell backwash before the next compliance sample — rather than discovering the deviation in the sample itself. Book a Demo to walk through how this maps onto your existing produced water instrumentation.
Expert Perspective: What Continuous Monitoring Changes in Water Treatment Operations
For years our hydrocyclone performance review meant pulling a grab sample twice a shift and reacting if the number looked high. The problem is that by the time a sample comes back elevated, the split ratio has usually already been drifting for days. Once we had continuous trending on pressure drop ratio and split ratio, we could see liner wear developing on two of our units almost two weeks before it would have shown up in a lab result. We scheduled the liner change during a planned outage instead of an emergency one, and our average oil-in-water at the IGF inlet dropped enough that our flotation chemical usage came down too — the whole train runs more predictably when the stage in front of it is behaving the way it's supposed to.
Frequently Asked Questions: Produced Water Treatment & Deoiling
iFactory connects to existing hydrocyclone, IGF, and filter instrumentation — pressure, flow, and lab sample data — typically without adding new field sensors.
Yes — iFactory maps inlet oil load and target disposition against each stage's performance envelope to right-size the treatment train.
By trending differential pressure and run-length-between-backwash patterns to flag bed fouling before effluent turbidity rises.
Yes — transmembrane pressure and flux decline are tracked to catch fouling and biological upset ahead of permeate quality loss.
Most produced water integrations are completed in 1 to 2 weeks once historian and lab data access is confirmed.
Conclusion: Treat the Train, Not Just the Sample
A discharge or injection compliance result is the last data point in a long chain of equipment behavior — it tells you what already happened, not what is about to happen. The hydrocyclones, flotation cells, filters, and membranes that make up a produced water treatment train each generate operating signals long before their separation performance actually fails, and those signals are almost always available in existing instrumentation. The teams getting the most reliable, lowest-cost produced water treatment results are not necessarily running newer equipment — they are the ones watching every stage of the train continuously, rather than waiting for the next lab sample to tell them something already went wrong.
iFactory AI brings that continuous visibility to produced water operations, connecting hydrocyclone, IGF, walnut shell filtration, and MBR performance data into a single monitoring layer built for treatment teams managing high water-to-oil ratios across multiple disposition pathways. The result is fewer compliance surprises, more predictable chemical and media consumption, and a treatment train that runs at the performance level it was actually designed for.