A cooling water system rarely fails all at once. It degrades quietly, a few degrees of lost approach temperature here, a slowly fouling exchanger there, until a hot summer week pushes the whole circuit past its margin and a unit has to curtail production to stay within design limits. Predictive maintenance on cooling towers, circulating pumps, heat exchangers, and water chemistry catches that slow degradation early enough to fix it on your schedule instead of the plant's. If cooling capacity has been a recurring summer concern at your site, a short conversation can walk through where monitoring would help most.
Cooling Water System PdM: Keep Capacity Ahead of Summer Heat
Cooling failures rarely announce themselves in advance. Continuous monitoring across towers, pumps, exchangers, and chemistry gives you the warning window most plants don't currently have.
The Four Points Where Cooling Systems Actually Fail
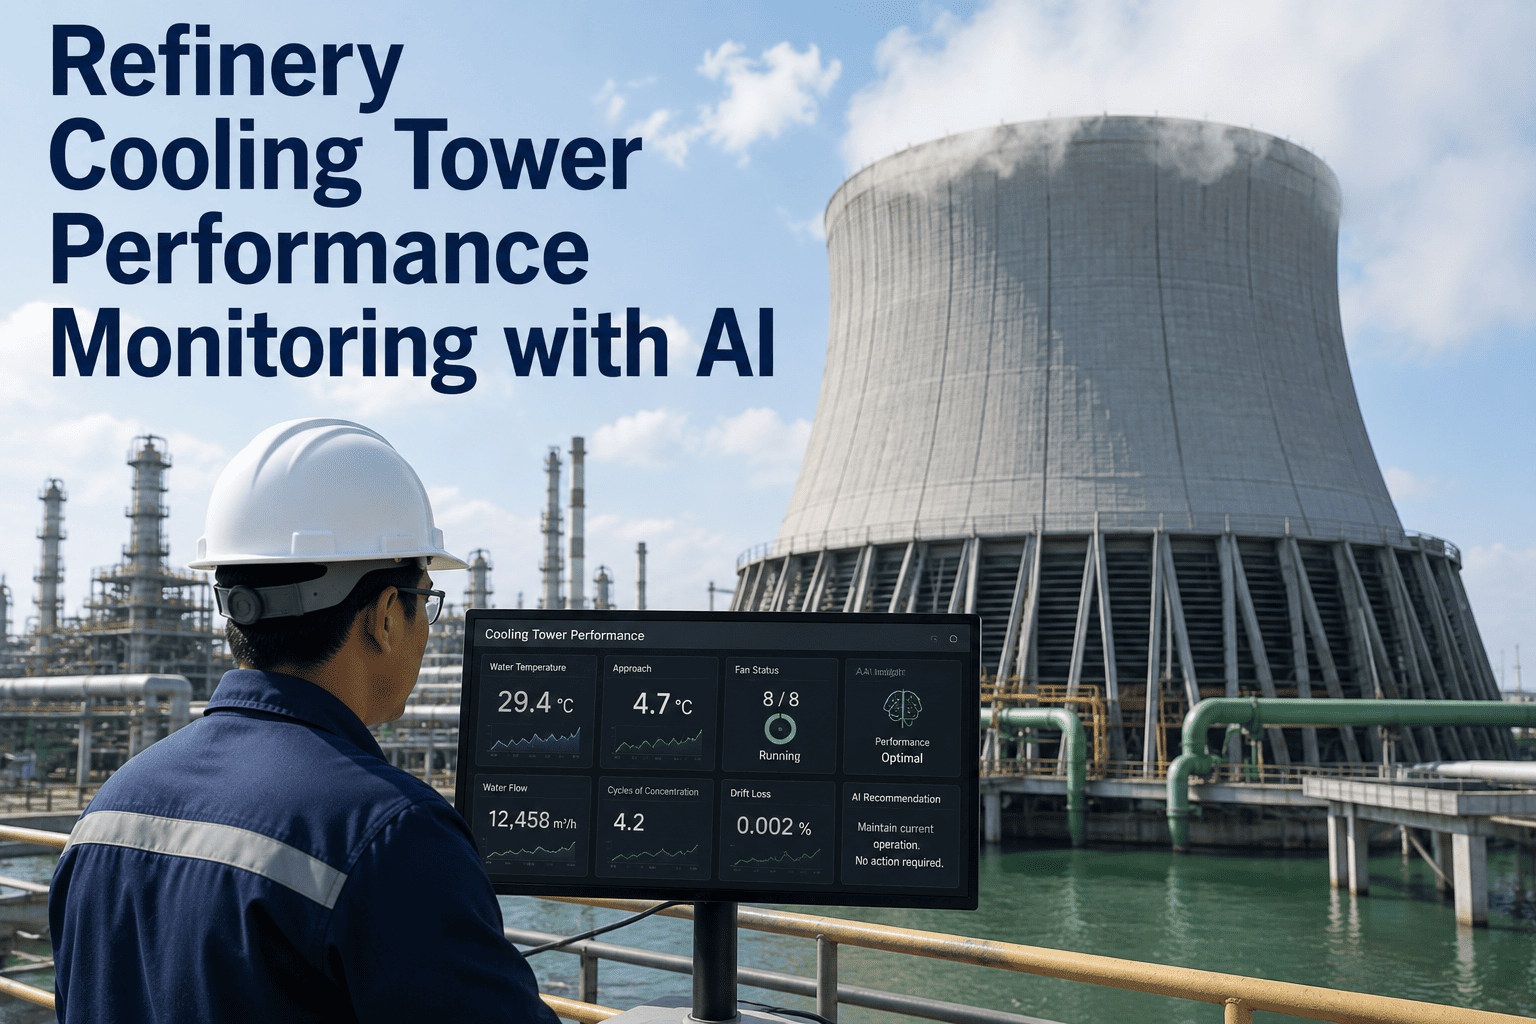
Cooling Tower Performance
Fan blade wear, fill media fouling, and drift losses gradually reduce heat rejection capacity, often invisible until ambient temperatures push the tower past its degraded margin.
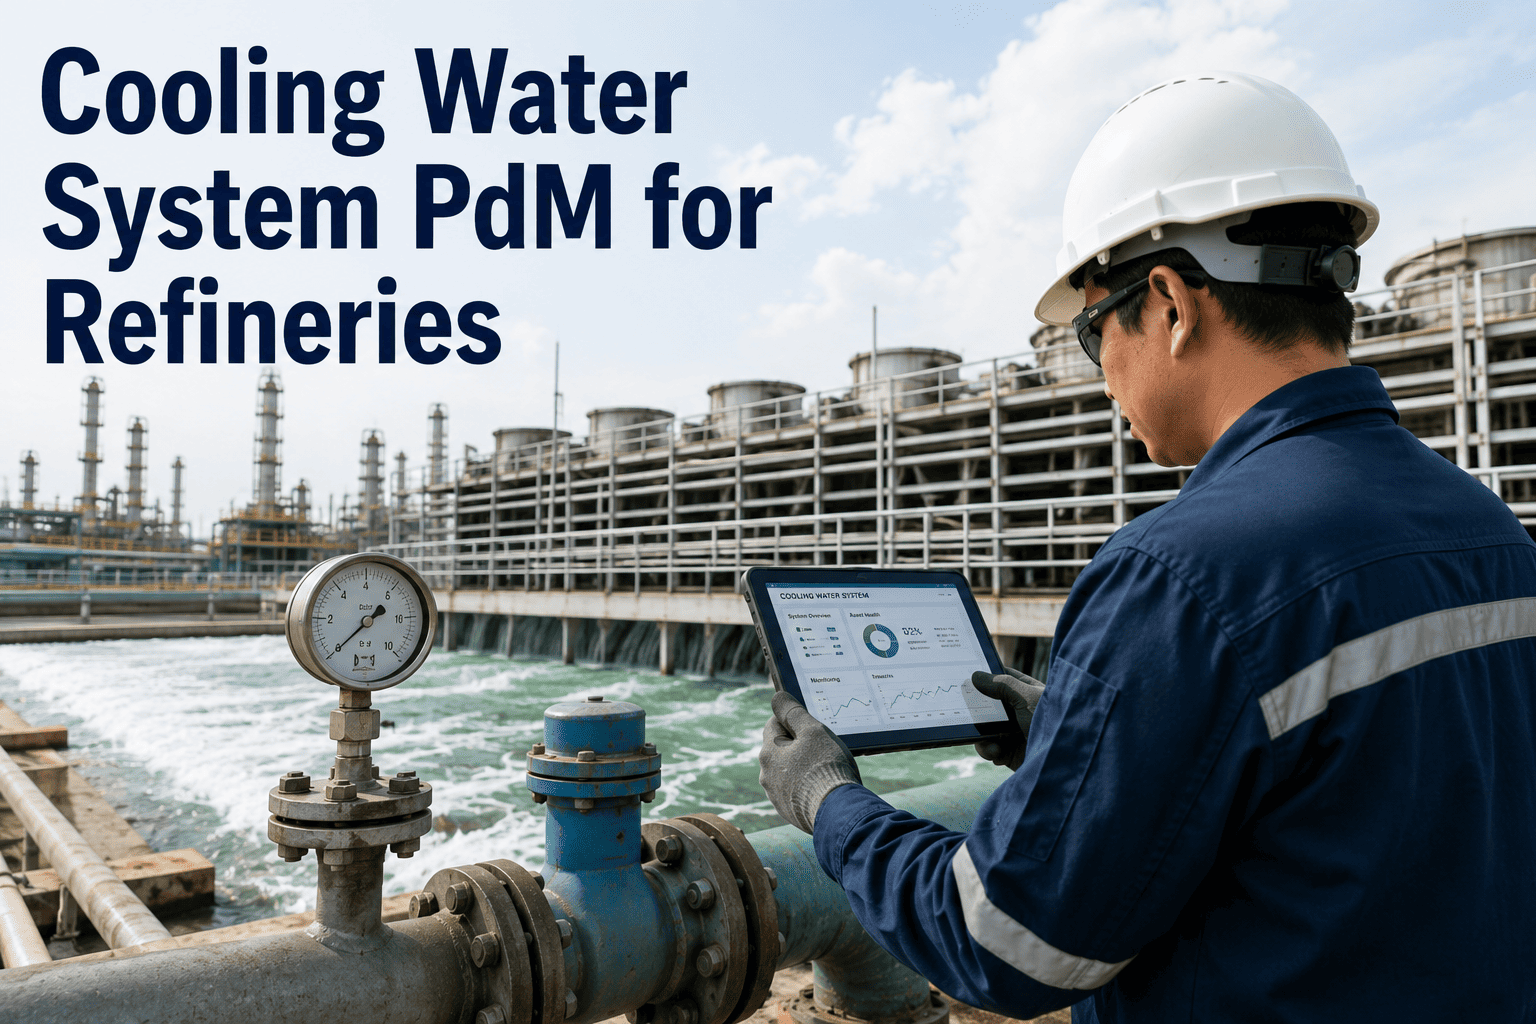
Circulating Pump Health
Bearing wear, impeller erosion, and seal degradation reduce flow rate over time, starving downstream exchangers of the circulation they were designed around.
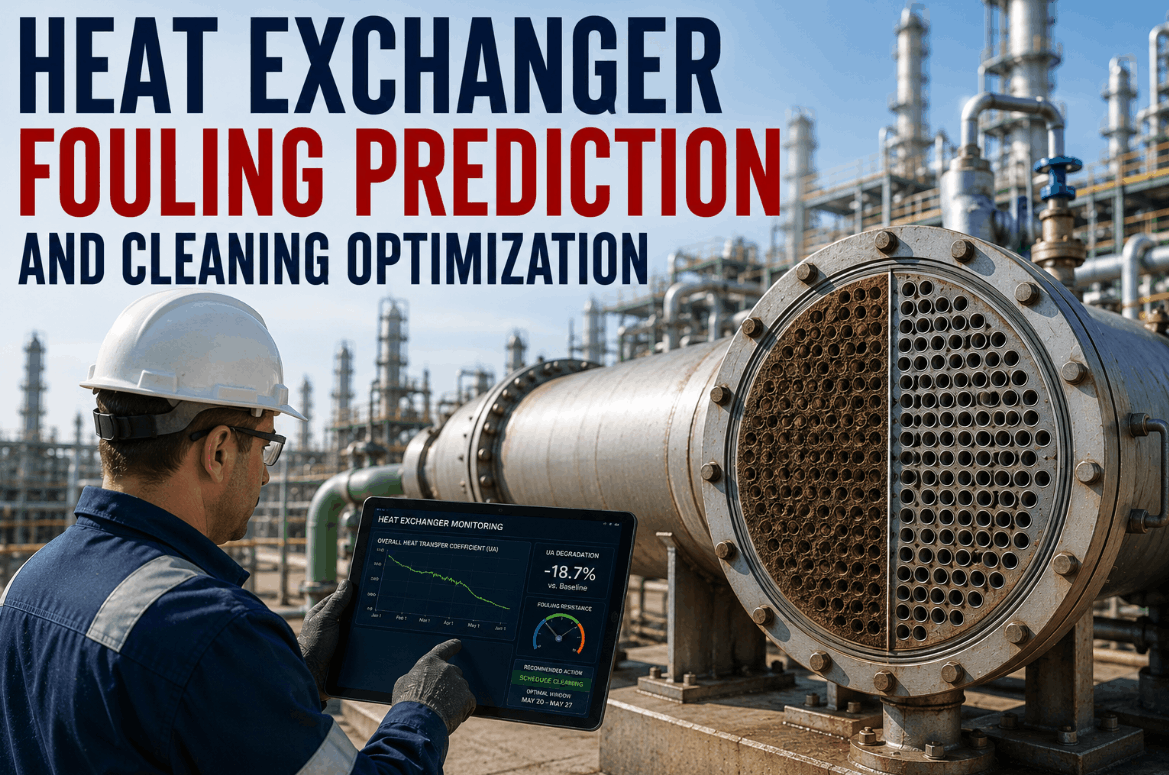
Heat Exchanger Fouling
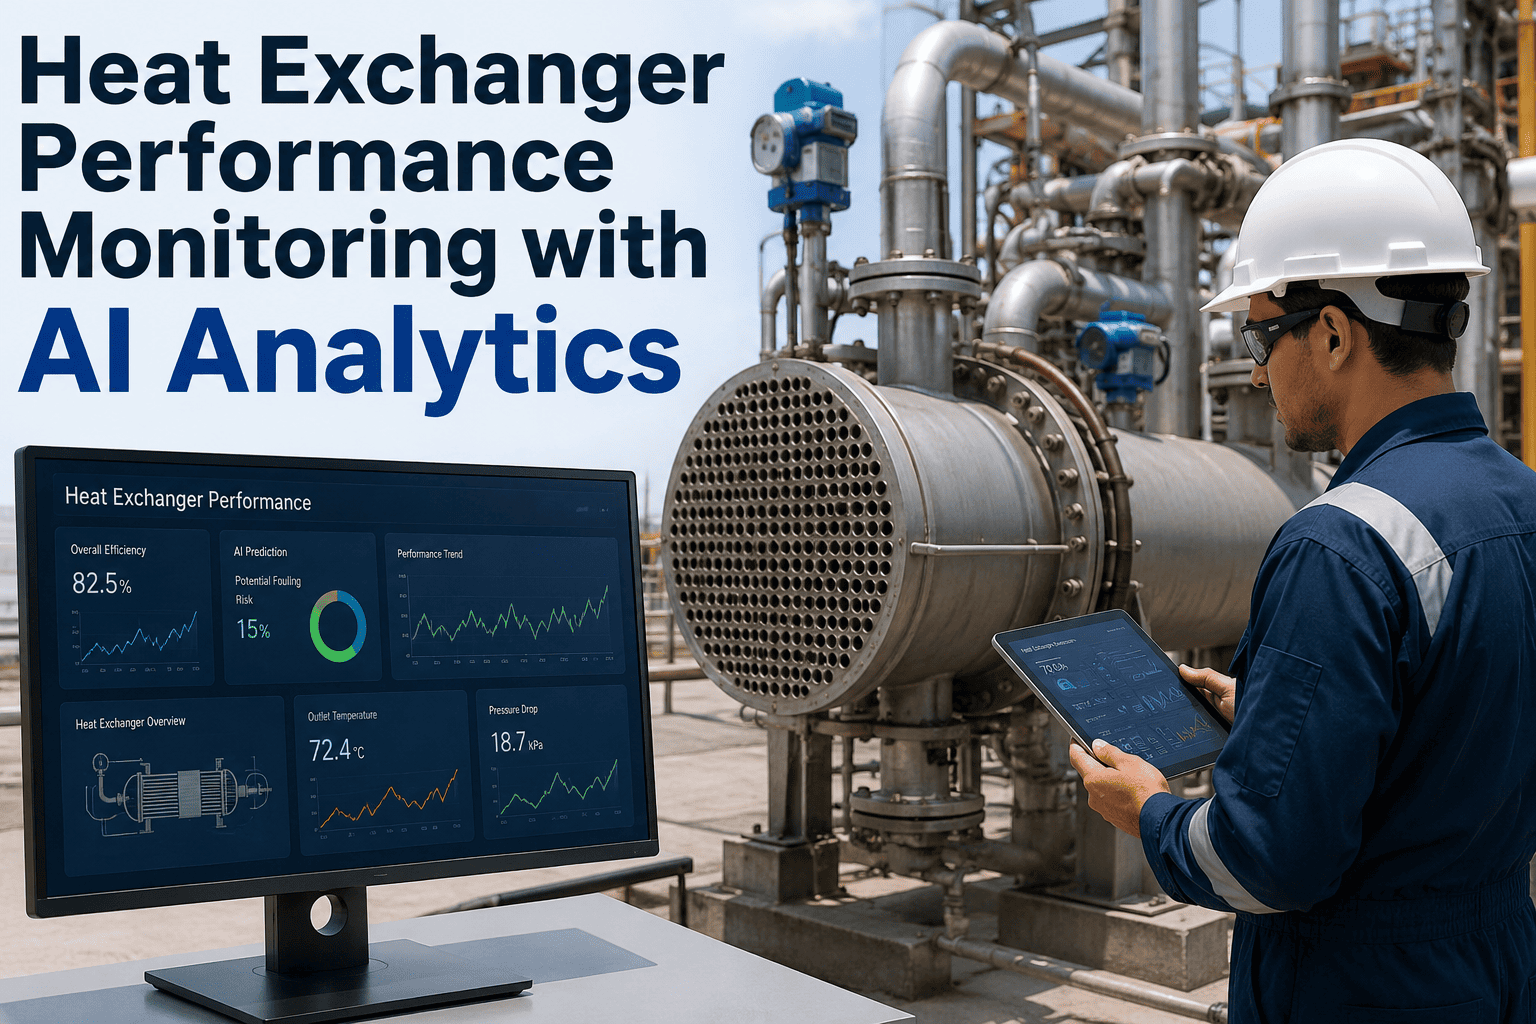
Scale, biological growth, and sediment build-up on exchanger surfaces reduce thermal transfer efficiency, forcing process units to run hotter or slower to compensate.
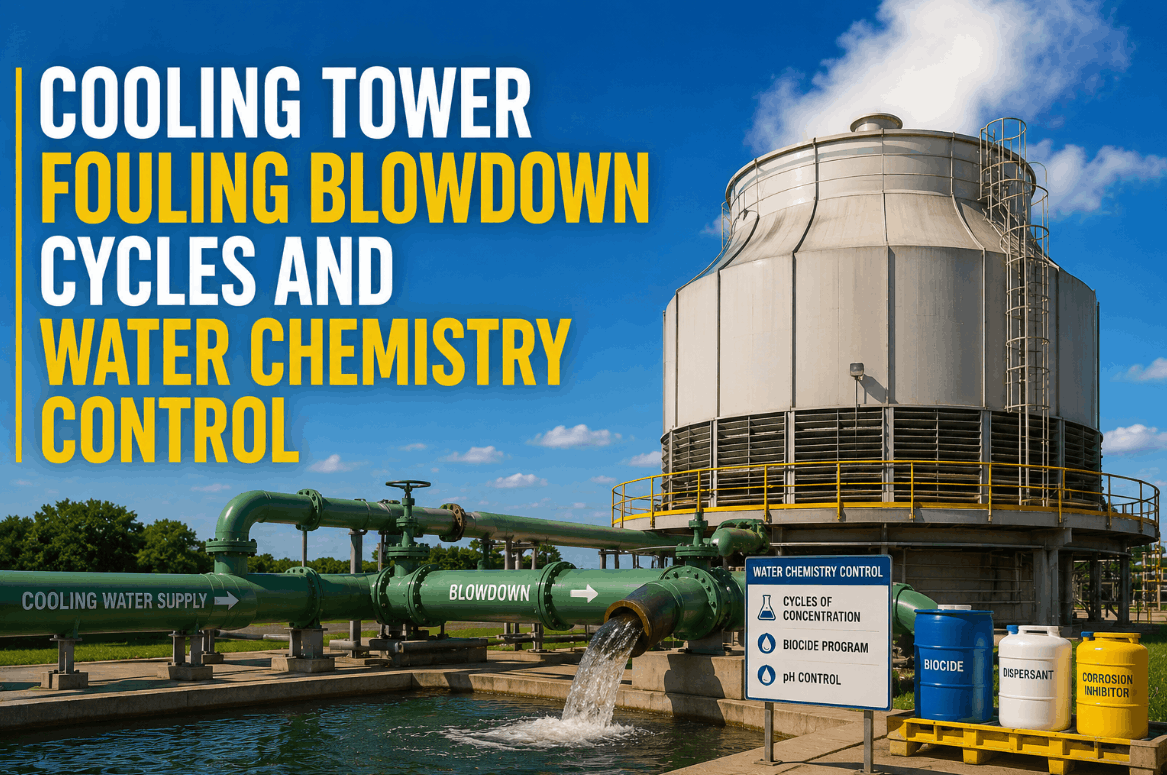
Water Chemistry Drift
pH imbalance, inadequate biocide dosing, or scaling index shifts accelerate corrosion and fouling across the entire circuit, compounding every other failure mode.
Early Warning Signals Worth Monitoring
| Component | Monitored Parameter | What It Signals |
|---|---|---|
| Cooling tower | Approach temperature trend | Declining heat rejection capacity |
| Tower fan | Vibration and motor current | Bearing wear or blade imbalance |
| Circulating pump | Flow rate vs design curve | Impeller wear or cavitation |
| Heat exchanger | Delta-T and pressure drop | Fouling accumulation |
| Water chemistry | Conductivity, pH, ORP | Treatment program drift |
Find Your System's Weakest Link Before Summer
A short assessment can show which component in your cooling circuit is closest to its performance margin, before ambient temperatures push it past the limit.
Why These Failures Cascade
Cooling water systems are unusual in how interconnected their failure modes are. Fouled water chemistry accelerates scale formation in exchangers, which increases the temperature the tower needs to reject, which pushes fans and pumps closer to their operating limits, which in turn increases wear rates on rotating equipment. A single upstream issue, often something as unglamorous as a biocide dosing pump slowly drifting out of calibration, can manifest downstream as a heat exchanger performance complaint that gets treated as an isolated mechanical problem rather than traced back to its actual root cause.
Monitoring the system as a connected circuit, rather than as isolated pieces of equipment, is what allows root cause to surface quickly instead of triggering a chain of reactive fixes that never quite solve the underlying issue.
This is also why maintenance teams sometimes replace a pump impeller or clean an exchanger, see temporary improvement, and then watch performance degrade again within weeks. If the underlying chemistry issue driving the fouling or corrosion never gets addressed, the mechanical fix only buys time rather than solving the actual problem. Monitoring across the full circuit is what makes that distinction visible before another round of the same maintenance work gets scheduled.
The Production Curtailment Connection
For process units where reaction rates, distillation efficiency, or compressor performance depend on cooling water temperature, a degraded cooling system doesn't just risk equipment damage, it directly limits how much the unit can produce. Plants running near their cooling capacity limit during peak summer months often accept reduced throughput as an unavoidable seasonal cost, without realizing how much of that reduction traces back to fixable degradation, fouled exchangers, worn pump impellers, or drifting water chemistry, rather than genuine ambient temperature limits.
Catching and correcting that degradation months before peak season, rather than discovering it mid-heatwave, is the difference between a planned maintenance window and an unplanned production loss.
There's also a compounding effect worth accounting for in any business case: a unit running with degraded cooling margin doesn't just lose throughput, it often runs less efficiently at whatever reduced rate it does achieve, since process conditions drift further from their design optimum. The combined cost of lost throughput and reduced efficiency is usually larger than either factor considered on its own, which is worth including when justifying the investment in continuous monitoring to plant leadership.
Metrics That Show This Is Working
Approach Temperature Margin
The gap between actual and design approach temperature, tracked over time as the clearest single indicator of overall cooling tower health.
Exchanger Fouling Factor
Calculated fouling resistance compared to clean baseline performance, showing how quickly degradation is accumulating on each critical exchanger.
Pump Flow Deviation
Actual flow output compared to the design curve at a given operating point, an early indicator of impeller wear before it affects downstream cooling.
Curtailment Hours Avoided
Production time preserved by catching and correcting degradation before it forced a throughput reduction, the metric that ties most directly to financial impact.
Connecting Chemistry Data to Mechanical Performance
Water treatment programs generate a steady stream of chemistry data, conductivity, pH, biocide residual, corrosion coupon results, that typically lives in a separate system from mechanical performance data on pumps and exchangers. Treating these as connected inputs rather than separate reports is where a lot of missed root cause analysis happens. A conductivity spike that looks like a minor chemistry excursion on its own can be the earliest signal of a cooling tower blowdown control issue that will show up as scale formation in an exchanger weeks later.
Bringing chemistry trends into the same monitoring view as mechanical performance data means an analyst reviewing exchanger fouling doesn't have to separately dig through a water treatment vendor's report to find the likely cause. The correlation is visible in one place, which shortens the time between noticing a problem and understanding why it's happening.
Getting Ready Before Peak Season
Most cooling system issues that surface during summer heatwaves were visible in the data months earlier, they just weren't being tracked continuously enough to notice. Building a monitoring program well before peak demand gives maintenance teams a genuine planning window rather than a reactive scramble once ambient temperatures start climbing.
Establish clean baseline performance data for towers, pumps, and exchangers during a period of normal operation, so degradation trends have something accurate to compare against.
Identify which exchangers and pumps sit closest to their design margin today, since these are where early degradation will bite first as demand rises.
Set trend-based alert thresholds rather than relying solely on fixed alarm limits, so gradual drift gets flagged before it crosses a hard limit.
Schedule any needed cleaning or overhaul work during cooler months, when taking equipment offline carries far less production risk than during peak season.
A Realistic Scenario
Consider a petrochemical facility that experienced recurring summer throughput reductions on a major process unit, historically attributed to ambient temperature limits on cooling capacity. After deploying continuous monitoring across the cooling tower, circulating pumps, and key exchangers, the actual root cause turned out to be a slow fouling trend in two heat exchangers that had gone unnoticed because performance data was only reviewed during scheduled inspections rather than tracked continuously.
Scheduling a cleaning during a planned turnaround, based on the fouling trend data rather than a fixed calendar interval, restored several degrees of approach temperature margin before the next summer season. The following year's peak-demand period passed without the throughput reduction the plant had budgeted for, a difference the operations team could trace directly back to the exchanger cleaning decision made months earlier.
Frequently Asked Questions
What sensors are required to monitor a cooling water system this way?
Most plants already have some instrumentation in place, temperature sensors, flow meters, vibration monitors on rotating equipment, and water chemistry analyzers. The gap is usually in how that data gets aggregated and analyzed continuously rather than reviewed manually during periodic inspections. Retrofit sensors fill specific gaps, but a full instrumentation overhaul is rarely required to get started.
How early can fouling actually be detected before it affects production?
Fouling trends typically show up in delta-T and pressure drop data weeks to months before the effect becomes severe enough to limit unit throughput, since the degradation is gradual rather than sudden. Continuous trend monitoring catches this drift far earlier than a periodic manual inspection would, giving maintenance planners a genuine scheduling advantage rather than a reactive scramble.
Does this replace our water treatment vendor's monitoring program?
No, water treatment vendor monitoring typically focuses on chemistry parameters in isolation. This approach layers mechanical and thermal performance data from towers, pumps, and exchangers alongside that chemistry data, giving a fuller picture of how chemistry drift connects to equipment performance rather than treating them as separate concerns. You can review how this fits alongside existing programs through support.
Can this help us plan turnaround scope more accurately?
Yes, trend data on exchanger fouling and pump wear helps prioritize which components genuinely need cleaning or overhaul during a turnaround versus which can wait another cycle, reducing both unnecessary work scope and the risk of missing a component that's closer to failure than assumed. This is one of the more immediate planning benefits plants report after a season of continuous data.
Is this relevant outside of peak summer conditions?
Yes, while summer heat is when cooling margin issues become most visible, the underlying degradation, pump wear, fouling, chemistry drift, happens year-round. Monitoring through cooler months often reveals the early stages of problems that would otherwise only become apparent once ambient temperatures rise. It's worth discussing your specific seasonal patterns on a scoping call.
Get Ahead of This Year's Cooling Season
See where your cooling water system's real performance margin sits today, before peak demand puts it to the test.