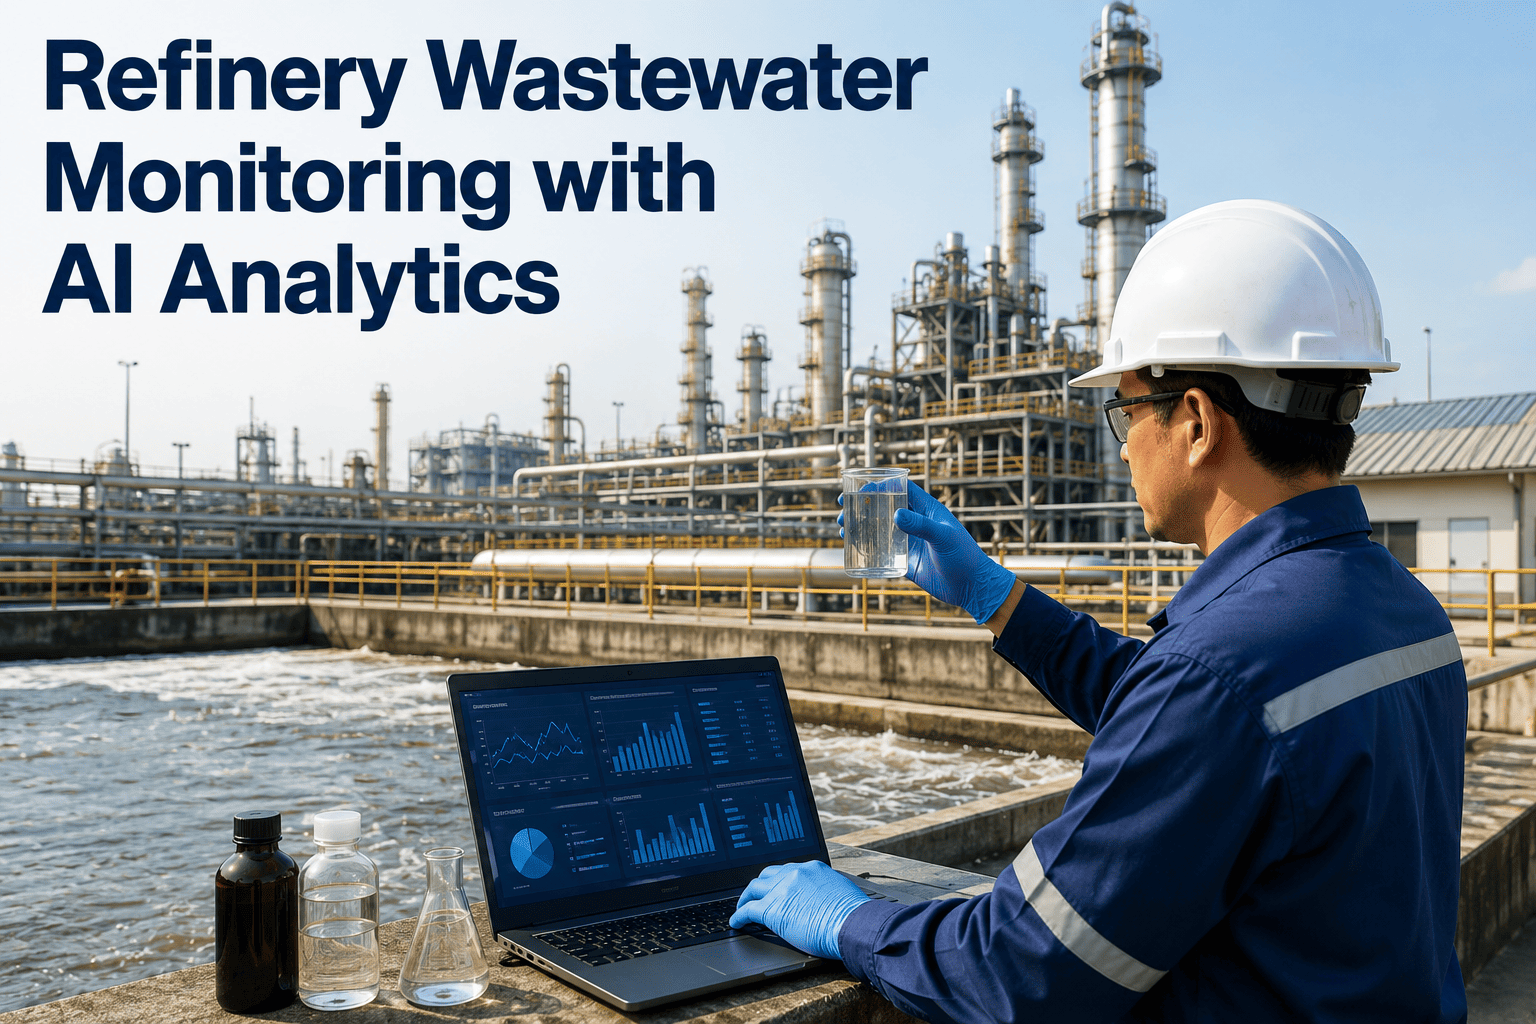
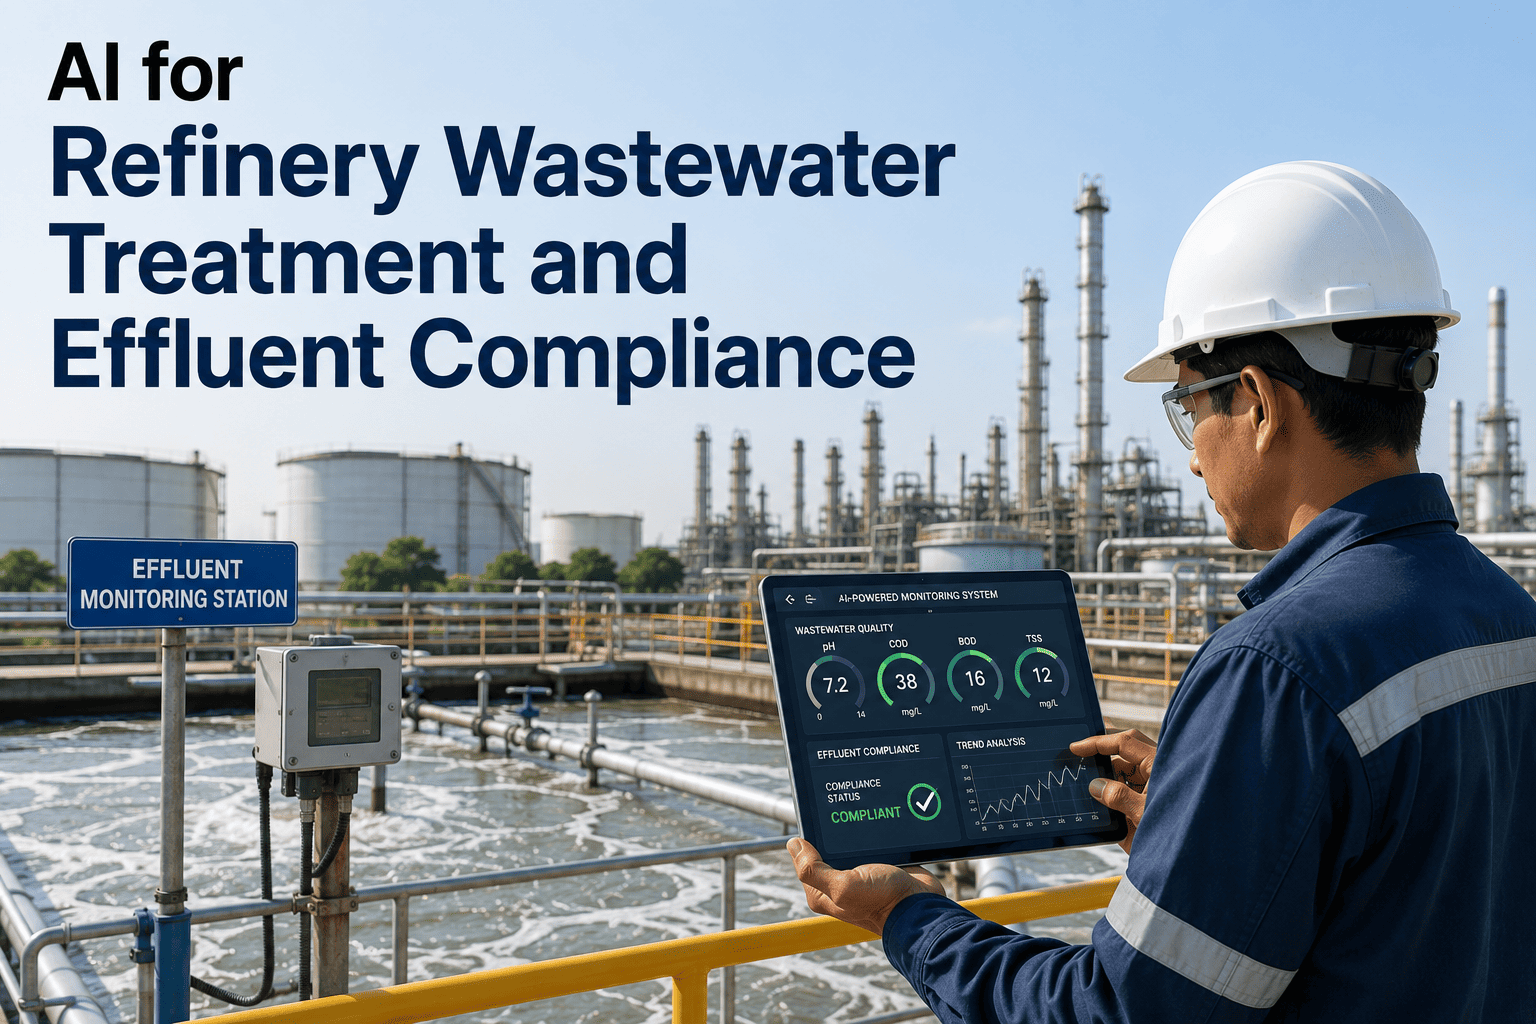
An environmental engineer running a refinery's wastewater treatment plant already knows the uncomfortable math behind a missed exceedance: a grab sample collected once a day tells you almost nothing about the eighteen hours before it was taken, and a slug of contaminated cooling water or an upset feed to the API separator can pass straight through the outfall long before anyone reviews the lab result. NPDES permits were written around periodic sampling because continuous monitoring wasn't practical at plant scale for decades, but the difference between an uneventful quarter and a formal notice of violation usually comes down to whether an upset was caught in the moment or discovered the next morning. iFactory's environmental analytics platform watches treatment performance continuously instead of once a shift, and you can explore an environmental AI demo to see it flag a real process upset before it reaches your outfall.
ENVIRONMENTAL ANALYTICS · WASTEWATER · COMPLIANCE
A Grab Sample Only Tells You What Happened at 8 A.M. — Not What's Happening in Your Outfall Right Now
iFactory's AI analytics platform continuously watches your refinery's wastewater treatment performance, abnormal events, and compliance risk, turning periodic lab results into a live picture of what's actually moving through the plant.
WHY REFINERY WASTEWATER COMPLIANCE IS HARDER THAN IT LOOKS
One Permit, Dozens of Parameters, and a Treatment Plant That Changes By the Hour
Every US refinery discharging process wastewater operates under an NPDES permit built on the federal Petroleum Refining Effluent Guidelines, which have governed wastewater discharge at well over a hundred refineries since the mid-1970s. A typical permit sets limits across oil and grease, total suspended solids, chemical and biological oxygen demand, pH, and nitrogen compounds such as total Kjeldahl nitrogen and nitrate-nitrite, sampled on a schedule that ranges from continuous pH monitoring to monthly composite sampling depending on the parameter. Civil penalties for a Clean Water Act permit exceedance can run into tens of thousands of dollars for every day a violation continues, which is exactly why the gap between a sample and the next one matters so much. A plant can be operating within every limit at the moment a sample is drawn and still be sliding toward an exceedance that won't show up until the next scheduled collection, simply because nobody was watching the trend in between.
THE TREATMENT TRAIN
Five Stages Stand Between Process Water and Your Outfall — AI Analytics Watches Every One
Refinery wastewater doesn't reach compliance in one step. It moves through a sequence of physical, chemical, and biological stages, and a problem introduced at any stage shows up as a compliance risk two or three stages later if nobody is watching it in real time. Understanding which stage watches which failure mode is the difference between fixing a problem at its source and chasing a symptom at the outfall.
1
API Separation
Watches: Oil & Grease
Gravity separation removes the bulk of free oil and settleable solids before the stream moves downstream, typically handling the largest share of hydrocarbon load.
2
Dissolved Air Flotation
Watches: TSS, Emulsified Oil
Fine solids and emulsified oil that gravity alone can't separate are floated out, and underperformance here is one of the most common upstream causes of a downstream exceedance.
3
Equalization
Watches: Flow, pH, COD Load
Flow and load swings from batch operations and stormwater are blended out before biological treatment, protecting the biology from shock loading.
4
Biological Treatment
Watches: BOD, COD, Nutrients
Activated sludge or similar biological processes break down dissolved organics, and a toxic slug reaching this stage can suppress the biology for days.
5
Final Clarification & Discharge
Watches: TSS, pH, Full Permit Panel
The last polish before the outfall, where every permit parameter converges and where a problem from any earlier stage finally becomes visible.
WHAT EVERY NPDES PERMIT IS WATCHING
Six Parameters, Six Different Failure Modes
Each parameter on a refinery's discharge permit exists because it tracks a distinct way treatment can fail, and a single sensor or one daily sample was never going to catch all six at once. Reading them together, rather than one at a time, is usually what reveals which stage of the treatment train actually needs attention.
Oil & Grease
Primary treatment risk
The most visible failure mode and usually the first sign of an upset feeding the API separator or a skimmer running behind on removal.
Total Suspended Solids
Flotation & clarifier risk
Rising TSS points to a DAF unit losing efficiency or a final clarifier carrying over solids it should be settling out.
COD & BOD
Biological load risk
A spike here often means an organic load the biological stage wasn't sized for, or a slug that's actively suppressing the microbial population.
pH
Process chemistry risk
Swings outside the permitted band can damage biological treatment directly and often trace back to a caustic or acid stream reaching the sewer unexpectedly.
Nitrogen Compounds
Nutrient management risk
Total Kjeldahl nitrogen and nitrate-nitrite trends signal how well the biological stage is managing nutrient removal over time, not just on sample day.
Flow & Temperature
Hydraulic loading risk
Sudden flow or temperature swings, often from cooling water rerouting, change how every downstream stage performs even before any contaminant shows up.
GRAB SAMPLING VS CONTINUOUS AI ANALYTICS
What Changes Between a Sample and a Live Signal
An Exceedance Doesn't Start at the Outfall, It Starts Two Stages Earlier
iFactory tracks treatment performance across every stage so a developing upset gets caught before it becomes a permit violation.
WHAT ACTUALLY GOES WRONG UPSTREAM
Four Ways a Compliant Plant Turns Into an Exceedance By Morning
None of these four scenarios require an equipment failure or an operator mistake to trigger a violation. Each one can start as a routine shift that looks unremarkable in the moment, and only becomes a problem because it wasn't caught before the next scheduled sample.
A Process Upset Sends an Organic Slug to Biological Treatment
A unit upset elsewhere in the refinery can push an unusually high organic load into the sewer system, and if it isn't caught before it reaches the biological stage, it can suppress the microbial population for days, turning one bad afternoon into a week of elevated BOD and COD readings.
Contaminated Cooling Water Gets Rerouted Back Unnoticed
Cooling water typically makes up roughly half of a refinery's total water volume and often bypasses the treatment plant entirely when it's clean, but a leak that contaminates it means it needs to be rerouted back, and a delay in making that call adds hydraulic and chemical load the plant wasn't built to absorb that day.
A DAF Unit Quietly Loses Efficiency
Flotation performance degrades gradually as air-to-solids ratios drift or chemical dosing falls out of tune, and because the effluent still looks clear to the eye, it's the kind of slow failure that only shows up once TSS or oil and grease numbers come back from the lab.
A pH Swing Reaches the Sewer Before Anyone Traces the Source
An unexpected caustic or acid discharge into the sewer network can shift plant-wide pH before the source is identified, and every hour spent tracing which unit is responsible is an hour biological treatment spends operating outside its tolerance.
WHAT ENVIRONMENTAL TEAMS REPORT
What Changes for a Wastewater Team After Going Live
The value shows up less as a single dramatic save and more as a string of exceedances that never happen, because the trend that would have caused them got flagged and corrected days earlier.
Continuous
Visibility into treatment performance between scheduled samples, not just on sample day
Earlier
Detection of a developing upset while it's still correctable, not after the outfall shows it
Traceable
Root cause visibility across treatment stages instead of manual log reconstruction
Automatic
Compliance reporting compiled from continuous data instead of assembled by hand each period
FREQUENTLY ASKED QUESTIONS
Questions Environmental Teams Ask About AI Wastewater Analytics
Does this replace our lab sampling and NPDES reporting process?
No, regulatory sampling and lab analysis remain part of your compliance program exactly as your permit requires. iFactory adds continuous visibility between those scheduled samples, so a developing trend is visible days before the next lab result would have shown it, and compiles the supporting data your team needs for routine compliance reporting.
Explore a demo to see how it complements your existing sampling program.
What data sources does the platform actually use?
The platform pulls from your existing online instrumentation, such as pH, flow, temperature, and dissolved oxygen sensors already installed across the treatment train, along with historical lab results, to build a continuous picture of performance at each stage. Where a stage lacks continuous instrumentation, iFactory can help identify the highest-value points to add.
Contact our support team to review what's available from your current instrumentation.
How does the system trace an exceedance back to its source?
Because performance is tracked continuously at every stage of the treatment train, a shift at the final clarifier can be traced backward through equalization, biological treatment, flotation, and primary separation to find where the anomaly actually started, rather than leaving that reconstruction to a manual review of process logs after the fact.
Explore a demo to see a root-cause trace on a real treatment train.
Can it detect a cooling water contamination event before it reaches the plant?
Yes, flow and quality trends on cooling water streams are monitored alongside process wastewater, so a contamination event that would normally require rerouting is flagged as trends shift rather than after the water has already reached the treatment plant and added unexpected load.
Contact our support team to discuss your site's cooling water configuration.
What does a typical rollout look like for an existing wastewater treatment plant?
Most rollouts begin with the stage carrying the highest compliance risk history, commonly biological treatment or final clarification, connecting to existing instrumentation and historical lab data before expanding coverage to the remaining stages of the treatment train. Each stage is calibrated against your plant's own performance baseline so alerts reflect real deviations rather than normal operating variation.
Explore a demo to get a rollout plan scoped to your treatment plant.
Stop Finding Out About an Upset From Yesterday's Lab Result
iFactory watches your refinery's entire wastewater treatment train continuously, so a developing risk gets caught before it becomes a compliance event.