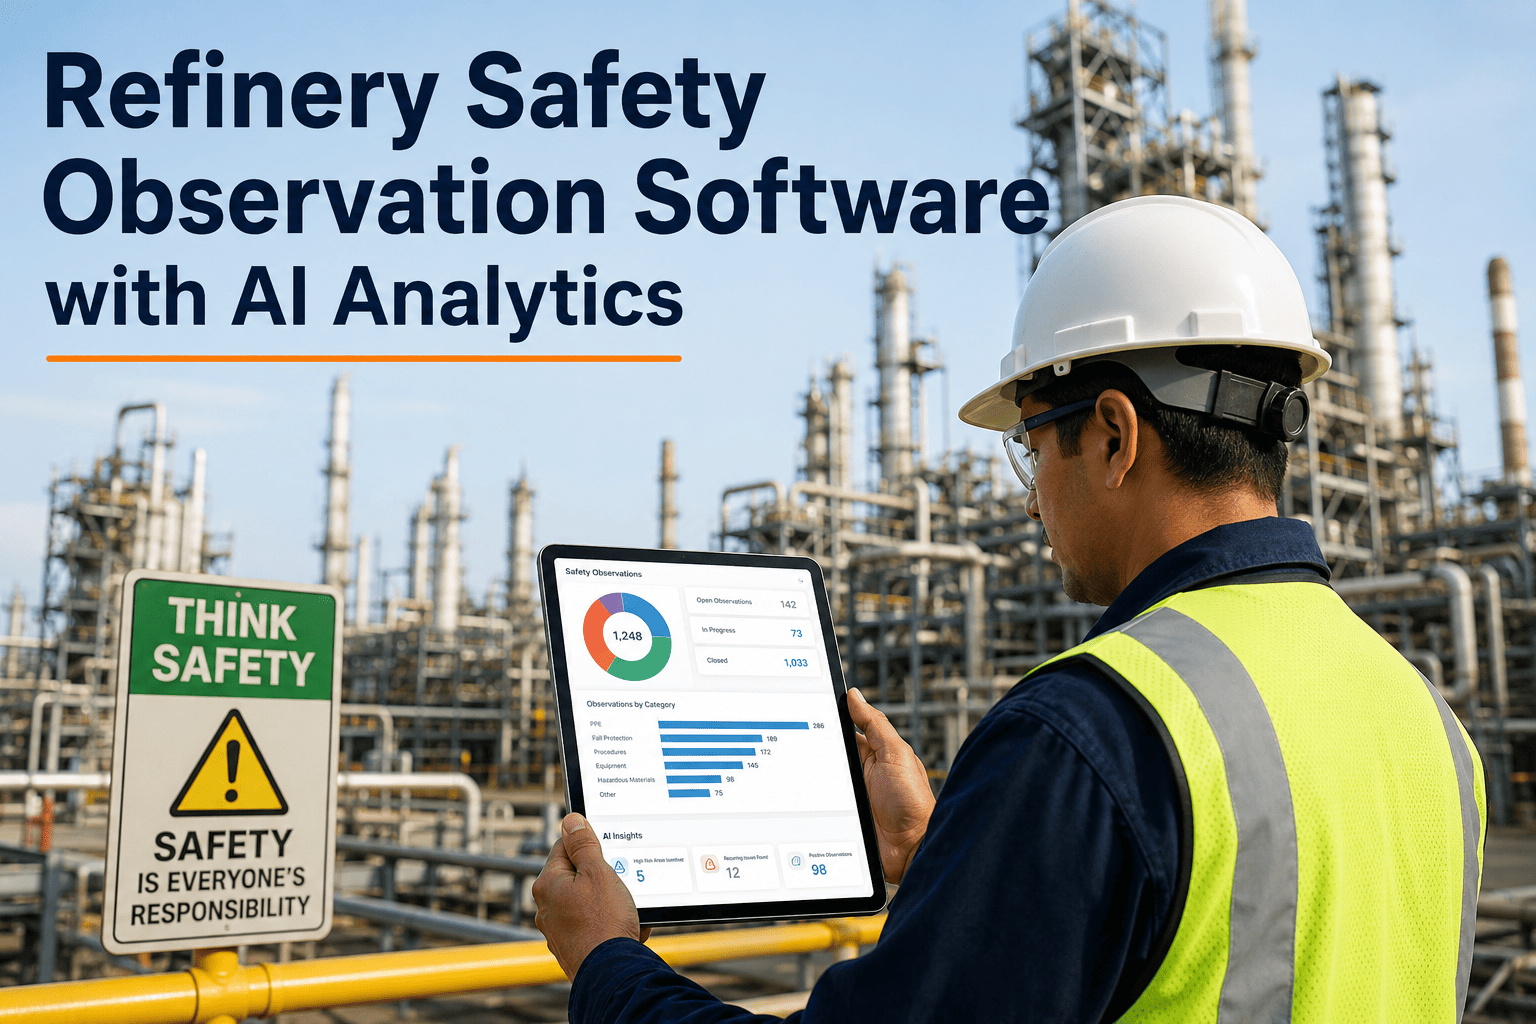
Refinery safety observation programs generate thousands of data points every month — unsafe acts, PPE violations, near misses, and hazard condition reports — yet most HSE teams process this data manually through spreadsheets and weekly summary emails. The result is a reactive safety culture where the same observation types repeat quarter after quarter because underlying patterns are never systematically identified or addressed. AI-powered safety observation analytics changes this by continuously processing observation data to detect emerging hazard trends, correlate unsafe behaviors with specific units or shifts, and deliver prioritized corrective actions before a minor observation becomes a recordable incident. See how AI transforms your observation data by booking a demo with iFactory.
76%
Share of refinery incidents preceded by repeated unaddressed safety observations in the prior 90 days
4-6 Wks
Average delay between observation submission and trend analysis in manual HSE reporting programs
89%
Of unsafe act observations that never receive a verified corrective action in paper-based systems
3.2x
Higher near-miss reporting rate in AI-assisted observation programs versus manual clipboard systems
Turn Thousands of Raw Safety Observations Into Actionable Hazard Intelligence — Automatically
iFactory's Safety Analytics platform ingests every observation your frontline teams submit, classifies it by type and severity using NLP, correlates patterns across units and shifts, and generates prioritized corrective actions before recurring hazards escalate to incidents.
The Four Observation Categories That Drive Refinery Incident Rates
Every refinery safety observation falls into one of four categories — and each category has a distinct predictive relationship to future incidents. Understanding which categories are growing, which units are generating the most observations, and whether corrective actions are actually closing the loop is the difference between a proactive and reactive HSE program. AI analytics makes this visible by classifying and tracking each category independently in real time.
01
Unsafe Acts
Behavioral observations including procedural shortcuts, bypassing safety systems, improper tool usage, unauthorized equipment operation, and work position violations. Unsafe acts account for approximately 80 percent of refinery incidents but are the most underreported category because they require peer observation and voluntary reporting.
Avg 34/month per refinery unit — 67% go unaddressed beyond initial logging
02
Unsafe Conditions
Physical hazard observations including leaking equipment, missing guards, compromised structural elements, inadequate ventilation, spill risks, and blocked emergency access routes. Conditions are easier to observe than acts but harder to correlate with specific risk levels without process context that AI provides by linking conditions to operating parameters.
Avg 22/month per refinery unit — 41% recur within 60 days without AI tracking
03
PPE Non-Compliance
Observations of missing, improper, or damaged personal protective equipment including incorrect respirator selection, expired gas detection badges, degraded chemical suits, and missing hard covers in hot work zones. PPE violations are the most frequently reported category but also the most prone to observation fatigue where HSE teams stop treating them as actionable data.
Avg 41/month per refinery unit — highest volume but lowest corrective action rate
04
Near Misses
Events that could have resulted in injury, environmental release, or equipment damage but did not — dropped loads near personnel, unexpected pressure releases contained by relief systems, and equipment failures caught before catastrophic failure. Near misses are the most predictive observation type for future incidents but have the lowest reporting rate in manual systems due to blame culture concerns.
Avg 6/month per unit in manual systems — rises to 19/month with AI-assisted reporting
Paper-Based Observation Systems vs AI-Powered Safety Analytics
The operational gap between manual and AI-driven safety observation management is not a marginal efficiency improvement — it is a structural difference in how quickly hazard patterns are identified, how reliably corrective actions are tracked, and whether the observation program generates the evidence base needed for regulatory compliance and leadership reporting. This comparison covers the specific operational differences that refinery HSE managers report when transitioning from clipboard-based systems to AI analytics.
| Operational Parameter |
Paper-Based / Spreadsheet Systems |
AI-Powered with iFactory |
| Data Capture Method |
Handwritten forms on clipboards, transcribed to spreadsheets by HSE coordinators — 2 to 4 day entry lag |
Mobile digital forms with photo evidence, GPS location, unit tag, and timestamp — real-time ingestion |
| Observation Classification |
Manual categorization by HSE staff reviewing submitted forms — inconsistent classification across observers |
NLP-powered auto-classification of free-text descriptions into standardized categories with severity scoring |
| Trend Analysis Speed |
Weekly or monthly summary reports compiled manually — patterns identified 4 to 6 weeks after emergence |
Continuous automated pattern detection across units, shifts, contractors, and observation types in real time |
| Corrective Action Tracking |
Manual follow-up in spreadsheets — no automated escalation when action deadlines pass without closure |
Auto-generated CMMS work orders with assigned owners, deadline tracking, and escalation alerts for overdue actions |
| Cross-Unit Correlation |
Nearly impossible — data siloed by unit, shift, and contractor with no systematic cross-referencing |
AI correlates observations across all units to identify systemic issues like training gaps or contractor performance patterns |
| Regulatory Evidence |
Paper files assembled manually for OSHA audits — incomplete chains of observation-to-correction documentation |
Structured digital evidence chain linking each observation to classification, root cause, action, and verified closure |
| Frontline Reporting Rate |
Declining over time as observers lose confidence that submissions lead to corrective action |
Increasing over time as observers see AI-driven responses and verified corrective actions within 24 to 48 hours |
How AI Processes Safety Observations From Capture to Corrective Action
The AI observation analytics pipeline converts raw observation data into prioritized corrective actions through four sequential stages. Each stage adds analytical value — from structured data capture through automated classification, pattern correlation, and action generation. The entire pipeline runs continuously, processing new observations within minutes of submission rather than weeks.
01
Capture
Frontline workers submit observations through mobile forms with structured fields for unit location, equipment tag, observation type, severity assessment, and photo evidence. Timestamp and GPS coordinates are captured automatically, eliminating data entry errors and providing the spatial and temporal context that AI needs for pattern detection.
02
Classify
NLP models trained on refinery safety terminology analyze free-text observation descriptions and automatically classify each submission by category, subcategory, hazard type, and initial severity score. This eliminates the inconsistent manual classification that plagues paper-based programs where the same hazard gets categorized differently by different observers.
03
Correlate
ML models continuously scan the classified observation database for emerging patterns — the same unsafe act recurring across multiple shifts in the same unit, PPE violations clustering around a specific contractor group, or near misses increasing in a particular process area. Pattern detection runs against 12 to 24 months of historical data to distinguish new trends from baseline noise.
04
Act
When patterns are detected or individual observations exceed severity thresholds, the platform auto-generates corrective action work orders in the connected CMMS, assigns responsible parties based on the observation type and unit, sets deadline targets calibrated to severity, and initiates escalation sequences if actions are not closed within the target window.
Measured Impact of AI Analytics on Refinery Observation Programs
Refineries that have deployed AI-driven safety observation analytics report measurable improvements across the key performance indicators that define HSE program effectiveness. The most significant impact is not in the volume of observations captured but in the rate at which observations are converted into verified corrective actions — the metric that directly correlates with incident reduction.
Before AI Implementation
After AI Implementation
The near-miss increase is the most important metric on this chart. Rising near-miss reports do not indicate worsening safety — they indicate improving reporting culture, which is the strongest leading indicator of future incident reduction. AI-assisted programs achieve this because observers see their submissions generating real corrective actions within days, which builds the trust needed to report near misses that manual systems never capture.
Platform Performance Metrics Across Deployed Refinery Sites
68%
Reduction in Repeat Observations
Same-hazard repeat rate drops within 90 days of AI pattern detection activating corrective actions
4 Hrs
Observation-to-Action Time
Average time from observation submission to assigned corrective action work order in CMMS
92%
Action Closure Rate
Corrective actions verified as completed within target deadline — up from 34% in prior manual system
2.4x
Frontline Reporting Increase
Total observation volume growth within 6 months as workers gain confidence in AI-driven response system
iFactory integrates directly with SAP PM, IBM Maximo, Infor EAM, and leading mobile safety form platforms — ingesting observation data without requiring your frontline teams to learn new tools or change their existing reporting workflows. Models train on your refinery's specific observation taxonomy, unit structure, and historical patterns within the first two weeks of deployment.
What Refinery HSE Leaders Report After Transitioning to AI Analytics
For three years we ran a behavior-based observation program with 12 trained observers submitting roughly 400 observations per month across our crude, vacuum, and reformer units. Every month I compiled the data into a summary report for the plant manager — total observations by category, unit breakdowns, and a list of open corrective actions. What I could not do in that spreadsheet was answer the question our plant manager kept asking: are we actually getting safer? The observation count stayed flat, the category mix stayed flat, and the open action list kept growing. When we deployed AI analytics, the first thing the system showed us was that 68 percent of our unsafe act observations were the same four behaviors repeating in the same two units on the same shift — a pattern that had been invisible in my monthly summary because I was aggregating by category and unit separately, never cross-referencing them together. Within 90 days of targeting those four specific behaviors in those two units on that shift, our repeat unsafe act rate dropped by 62 percent.
Senior HSE Manager
Gulf Coast Refinery — Behavior-Based Safety Program, 16 Years in Refinery HSE
The single biggest barrier to our observation program was not capture — it was trust. Operators did not believe that submitting an observation led to anything happening. They would fill out the form, hand it to the HSE coordinator, and never see or hear about it again. Over two years our observation submission rate dropped from 28 per week to 11 per week while our TRIR stayed flat. When we implemented AI-driven analytics, the first change was not the technology — it was the response time. An operator submitted an observation about a missing valve handwheel on a hydrocarbon line at 7 AM. By 9 AM there was a work order assigned to the mechanical team with a 24-hour deadline. By 4 PM the handwheel was installed and the observation was marked closed with a photo of the completed repair. That operator submitted four more observations that same week. Within six months our submission rate was at 42 per week — higher than it had ever been — because the technology made the response visible.
HSE Director
Midwest Refinery — Process Safety and Observations, 21 Years in Oil and Gas Safety
Frequently Asked Questions
Your Safety Observations Are Already Telling You Where the Next Incident Will Happen — AI Makes That Visible
iFactory's Safety Analytics platform classifies, correlates, and acts on every observation your refinery teams submit — converting raw reporting data into prioritized hazard intelligence with CMMS-integrated corrective actions and OSHA-ready compliance documentation in three to five weeks.
NLP Observation Classification
Cross-Unit Pattern Detection
CMMS Work Order Generation
Contractor Analytics
OSHA Compliance Evidence