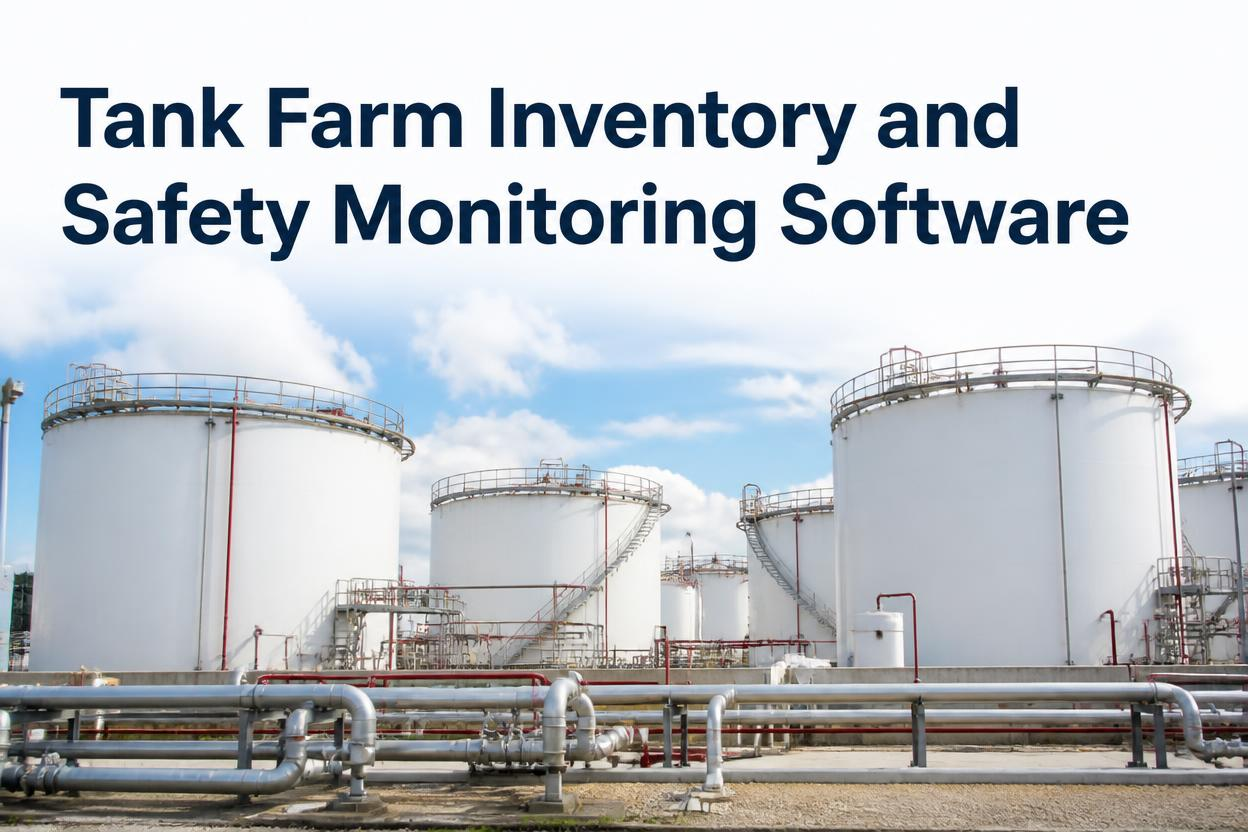
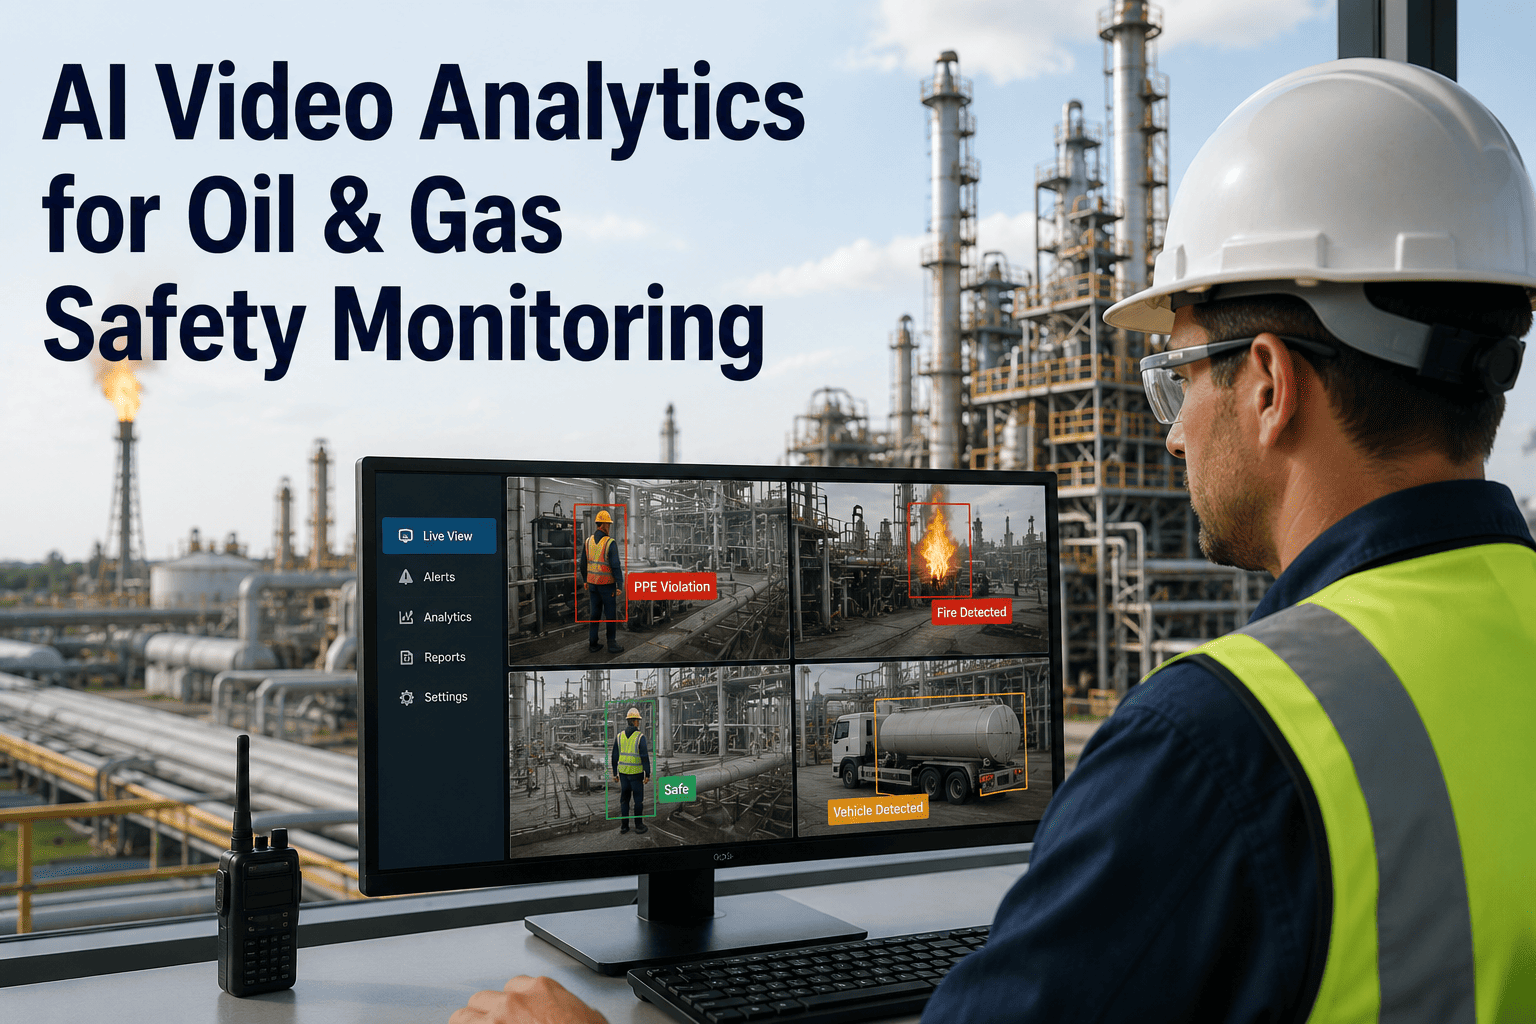
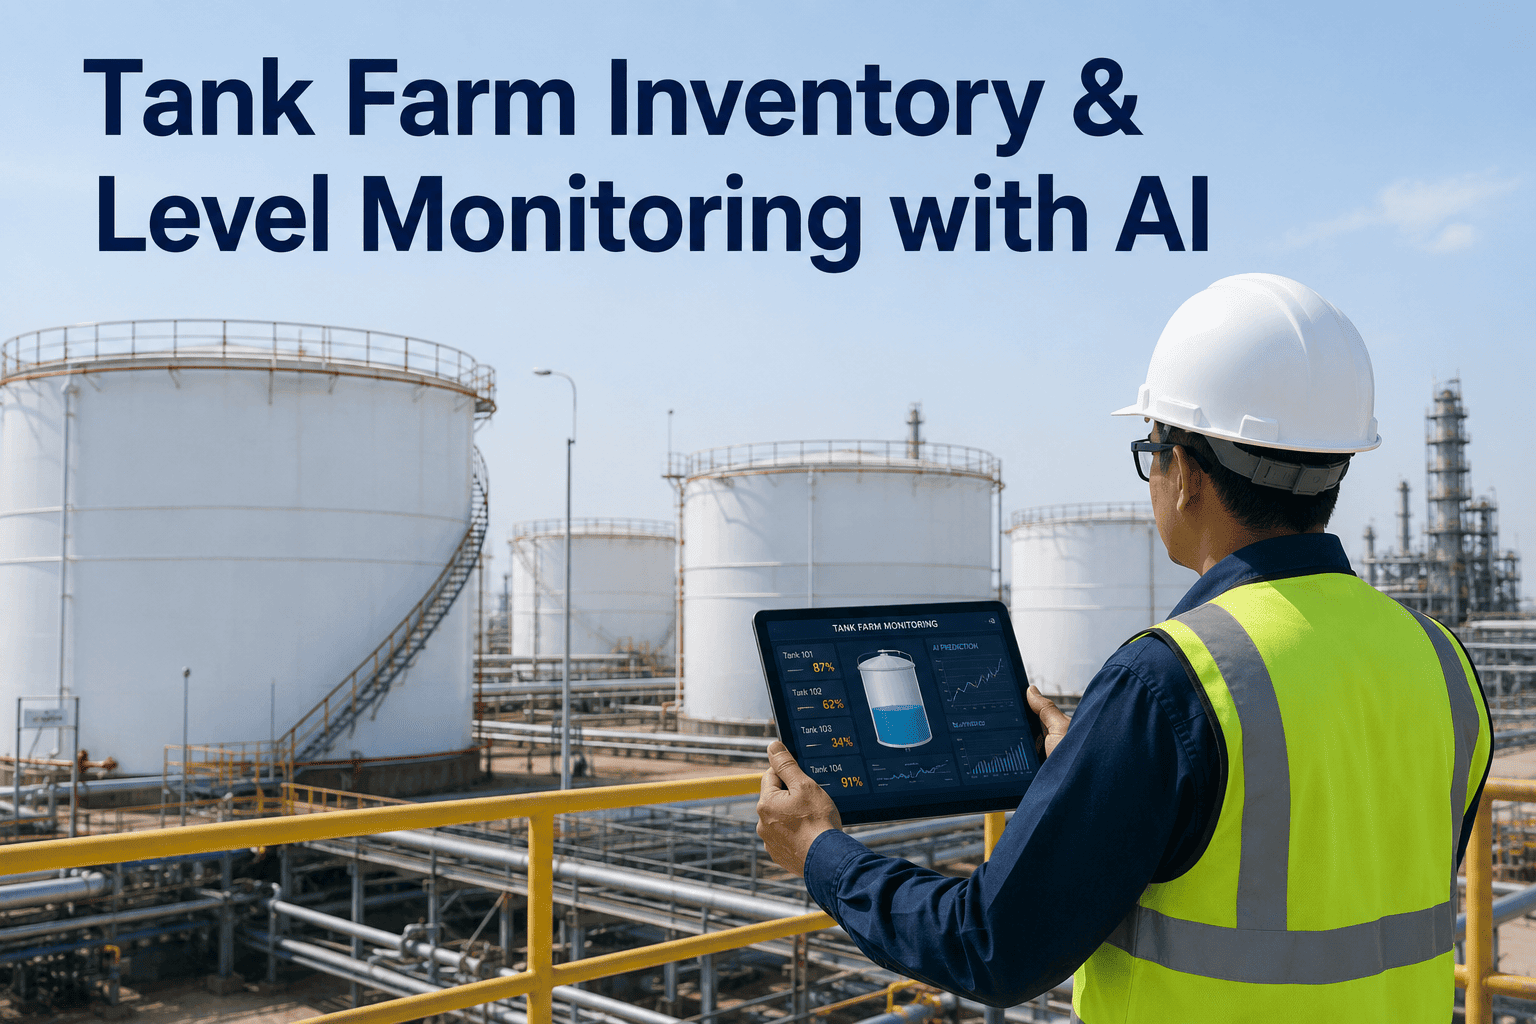
A tank farm can hold millions of dollars of product, yet many terminals still run inventory reconciliation the same way they did twenty years ago: manual gauging, end-of-shift logs, and a spreadsheet that only tells you something went wrong after the barrels are already gone. One documented case found a nine-day gap between barrels shipped and barrels paid for that added up to over a thousand missing barrels before anyone noticed the discrepancy. Unifying tank levels, safety alerts, and inventory movement into one live view closes exactly that kind of gap, and terminal operators who want to see their own tank farm mapped this way can book a demo before their next inventory audit.
Tank Farm Operations · Operations Intelligence
One Live View for Every Tank, Every Alert, Every Barrel
Unify tank levels, safety alerts, inspection evidence, and inventory movement across your entire tank farm so nothing gets discovered after the fact.
What Manual Tank Management Actually Costs
These are the recurring problems terminals report before moving to unified, real-time tank monitoring, and they rarely show up until an audit, an overfill near-miss, or a reconciliation gap forces the issue.
±0.3%
Accuracy achievable with modern radar-based level monitoring, versus manual gauging estimates
9 Days
How long one documented shrinkage gap went unnoticed under manual reconciliation
100+
Tanks a single dashboard can track from one access point at large terminals
Four Things a Tank Farm Dashboard Should Do at Once
Level data, safety alerts, inspection evidence, and inventory movement are usually tracked in separate tools. Bringing them into one dashboard is what turns raw sensor readings into decisions a terminal manager can act on the same shift.
Real-Time Level & Temperature Monitoring
Continuous radar and level sensor data replaces manual gauging rounds, flagging a rising water cut or deviating reading before it becomes a safety incident.
Overfill and Safety Alerting
Built-in overfill prevention and alarm thresholds trigger immediate notifications, helping prevent spills before they reach the environment or the news.
Tank Health Scoring
Composite health scores based on bottom plate corrosion, external condition, and estimated sludge quantity help prioritize which tanks need maintenance first.
Inventory Movement Reconciliation
Automated tracking of transfers, loading, and unloading activity closes reconciliation gaps that manual logs routinely miss for days at a time.
Manual Tank Gauging vs. Unified Real-Time Monitoring
| Function |
Manual Gauging & Logs |
Unified Real-Time Dashboard |
| Level accuracy |
Depends on manual dip readings and rounding |
Radar-based sensors accurate to within a fraction of a percent |
| Overfill risk detection |
Caught only if a round happens to occur in time |
Continuous alarm thresholds trigger immediate alerts |
| Reconciliation gaps |
Can go unnoticed for days between shift logs |
Movement tracked and reconciled automatically |
| Tank maintenance priority |
Based on age or fixed schedule, not real condition |
Ranked by live health score across corrosion and sludge data |
| Multi-tank visibility |
Requires walking or checking each tank separately |
Single dashboard covering the entire terminal |
How the Data Actually Flows
The system works continuously in the background so terminal staff only need to act on exceptions, not chase raw data.
1
Sensors Stream Level, Temperature, and Pressure Data
Wireless and wired gauges on every tank push readings continuously instead of waiting for a scheduled check.
2
Dashboard Normalizes Data Across the Terminal
Readings from every tank, pump, and filter are combined into a single, color-coded view instead of separate spreadsheets or system silos.
3
Health Scores and Alerts Are Calculated
Each tank receives a live health score and any deviation beyond a safe threshold immediately triggers an alert to the operations team.
4
Movement and Reconciliation Update Automatically
Every transfer, loading, and unloading event is logged and reconciled against expected volumes without manual entry.
If your reconciliation report is only accurate at the end of the shift, it's already too late to catch most problems. A live dashboard turns tank data into something your team can act on the moment it changes.
Terminal Operations Perspective
Tank farms rarely fail dramatically. They fail quietly, a fraction of a percent at a time, until someone runs an audit and finds a gap nobody can fully explain. The value of a live dashboard isn't just the alarm it sounds during an emergency, it's the thousand small discrepancies it catches before they ever become one. Terminals that switch to continuous monitoring almost always describe the same experience: the first month is uncomfortable because the data finally matches reality, and every month after that is calmer because the surprises stop happening.
Terminal Operations Manager — Bulk Liquid Storage & Distribution
Frequently Asked Questions
Does this integrate with tank gauges and sensors we already have installed?
Yes, the dashboard is built to ingest data from existing radar, servo, and float-based tank gauging systems rather than requiring a full hardware replacement. Wireless retrofit sensors can be added where coverage gaps exist, and all readings are normalized into the same dashboard regardless of which gauge manufacturer originally supplied them. This keeps deployment cost and disruption low compared to a rip-and-replace approach.
Book a demo to check compatibility with your current gauging hardware.
How does the tank health score actually get calculated?
Health scores are built from a combination of estimated bottom plate corrosion, external tank condition, and estimated sludge quantity, drawing on tank age, product type, and operating history where available. The result is a single composite score on a consistent scale that lets terminal managers rank every tank in the farm by relative risk rather than relying on age-based maintenance schedules alone. Scores update as new inspection and sensor data comes in rather than staying static between formal assessments.
Contact support to see how health scoring would apply to your specific tank inventory.
Can this help prevent overfill incidents specifically?
Overfill prevention is one of the core safety functions built into the platform, with configurable alarm thresholds that trigger immediate alerts as a tank approaches a defined high-level limit. Because level data streams continuously rather than being checked periodically, the system can catch a fast-filling tank well before a scheduled round would have noticed the trend. This directly addresses one of the most common and costly incident types at bulk storage terminals.
Book a demo to see the overfill alerting workflow in action.
How does automated reconciliation actually close inventory gaps?
Every loading, unloading, and inter-tank transfer is logged automatically as it happens and compared against expected volumes in near real time, rather than being reconciled once at the end of a shift or month. This is what catches slow, small discrepancies, the kind that add up to significant volume over days or weeks, long before a formal audit would have surfaced them. Automated reconciliation doesn't replace an audit, but it should make most audits far less eventful.
Contact support to walk through how reconciliation reporting would look for your terminal.
Is this suitable for terminals with a mix of product types, like crude, refined fuels, and chemicals?
Yes, the platform is designed to handle mixed product terminals, since tank health scoring, level monitoring, and safety alerting all account for the specific properties and handling requirements of the product stored in each tank. Crude storage, refined product tanks, and chemical storage each carry different risk profiles, and the dashboard reflects that rather than applying one generic threshold across every tank. This flexibility is particularly relevant for terminals that handle multiple product lines on the same site.
Book a demo to see how the dashboard adapts across different product types.
Stop Finding Out About Tank Problems During the Audit
See your entire tank farm — levels, alerts, health scores, and reconciliation — in one live dashboard built for terminal operations.