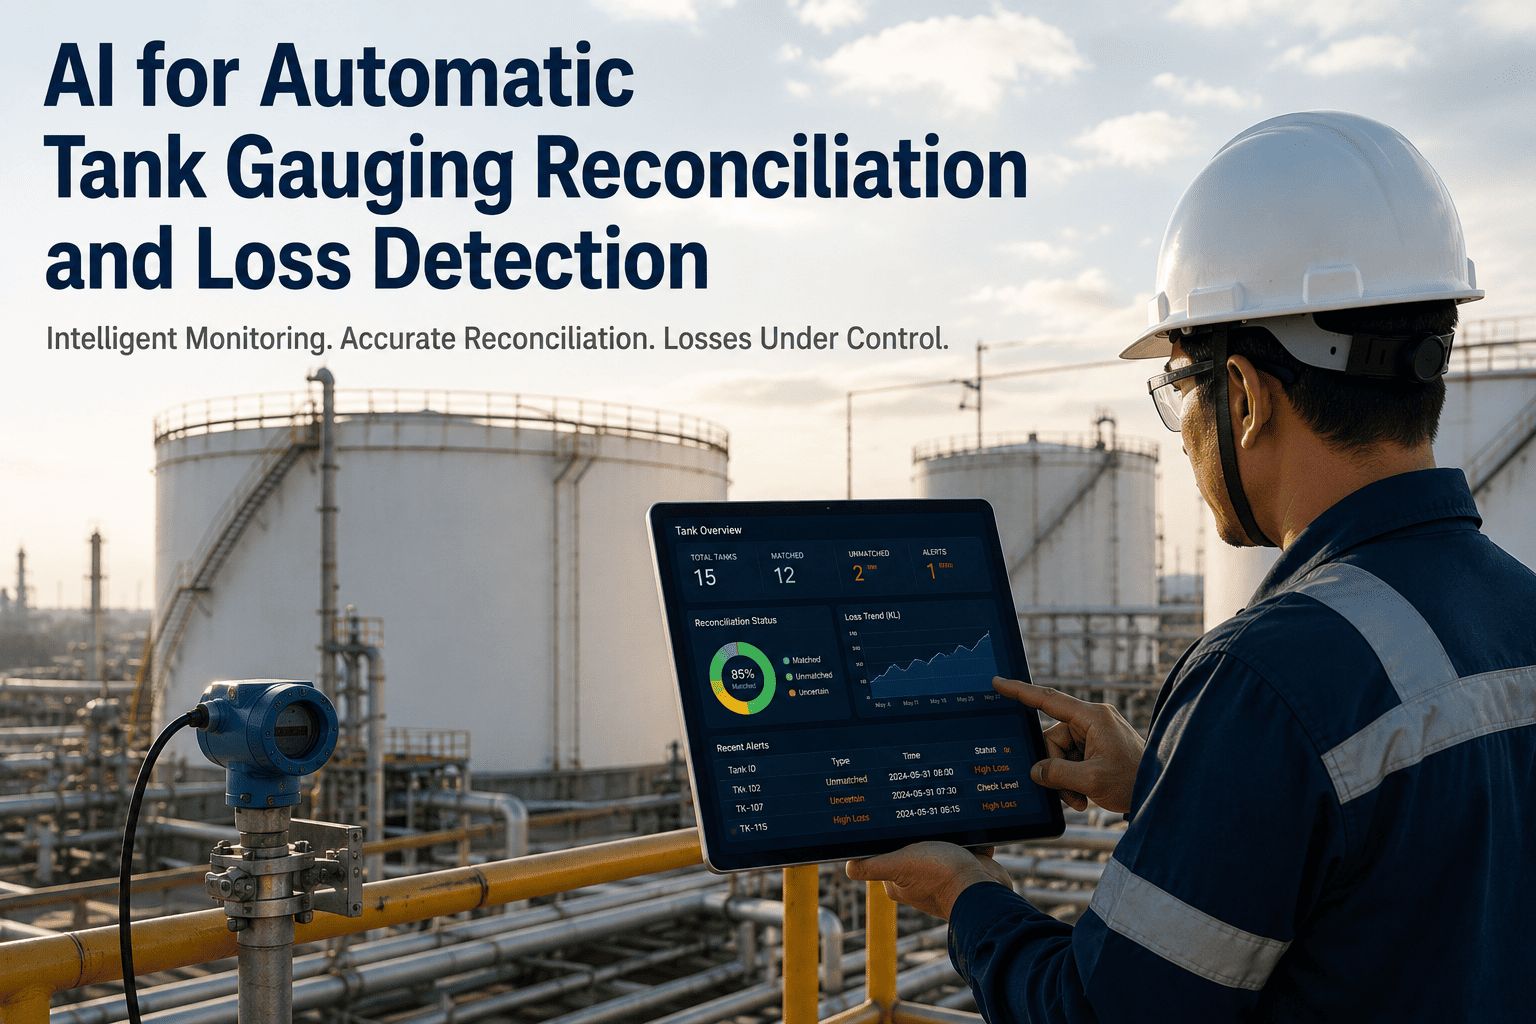
A tank farm can report a clean book inventory and still be losing product every single day, because the number on the report is only as good as the three separate data sources that feed it, and those sources rarely agree with each other by default. Tank gauging tells you what a tank believes it holds, pipeline metering tells you what moved through a line, and truck loading tickets tell you what left the gate, and each carries its own measurement error, timing lag, and rounding behavior. When nobody reconciles the three in real time, the gaps accumulate quietly until an audit, a customer dispute, or a regulatory inspection forces the question nobody wants to answer. iFactory closes that gap with continuous, AI-driven reconciliation across every data source feeding your inventory number, detailed further at iFactory support.
Overview · Inventory & Loss Control
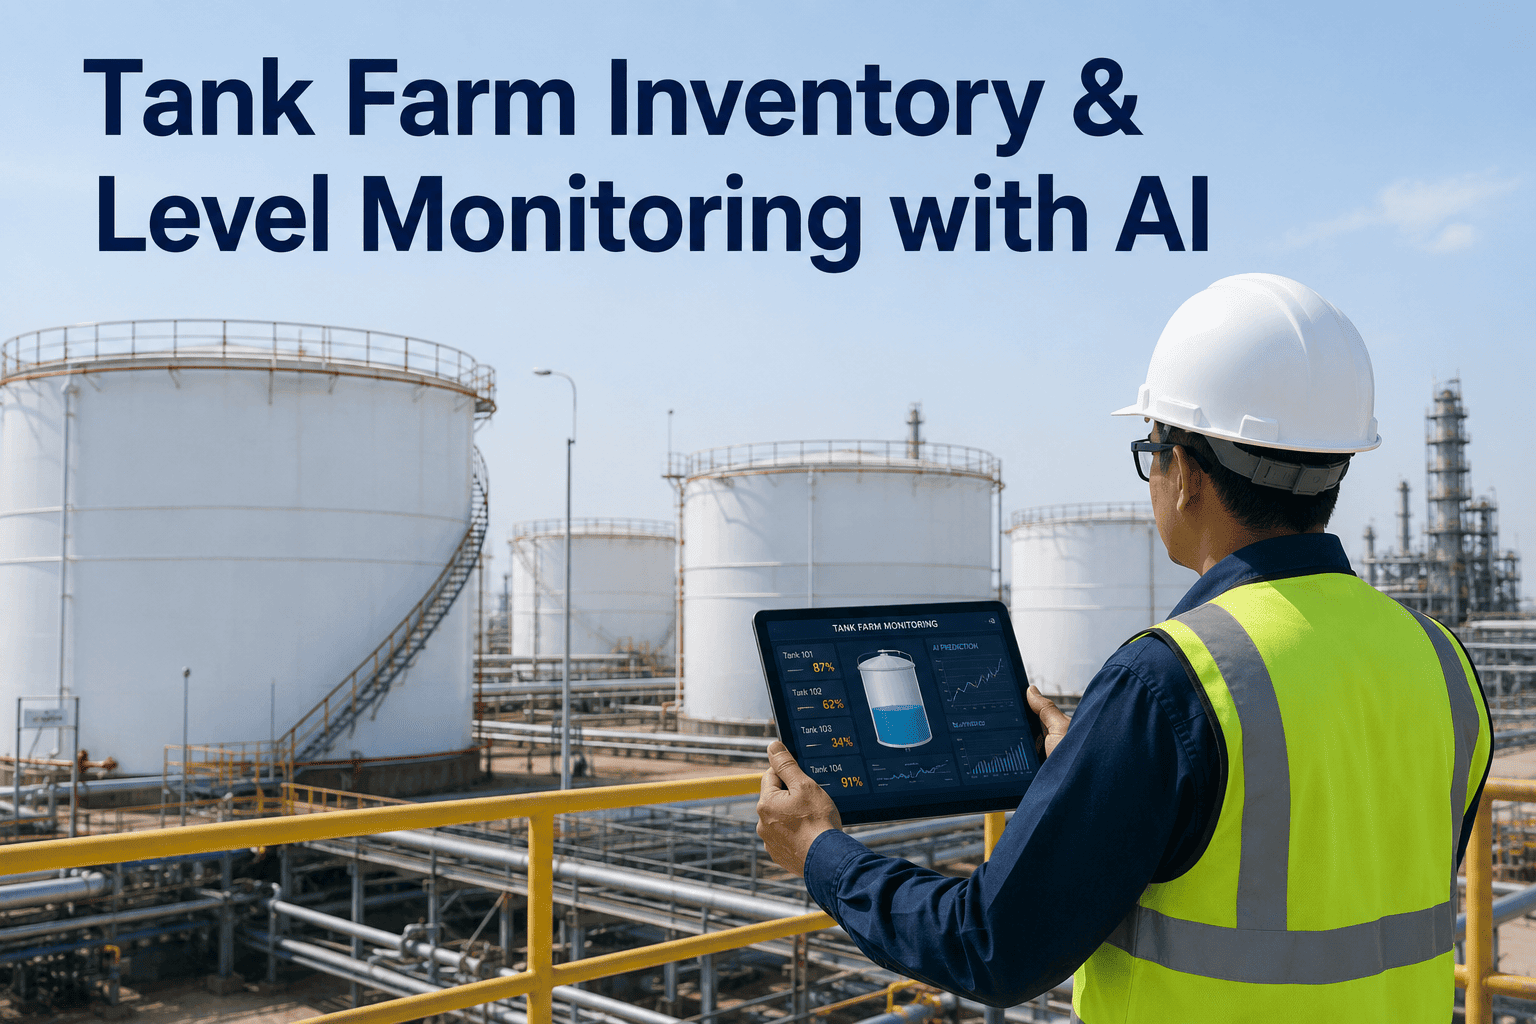
AI for Tank Farm Inventory Management and Loss Control
AI reconciles tank gauging, pipeline metering, and truck loading data continuously to detect inventory losses from measurement error, theft, and evaporation before they surface as an unexplained shortage at month-end.
Where the Losses Actually Hide
Four Categories, One Reconciliation Blind Spot Each
Inventory loss at a tank farm is rarely one dramatic event. It is usually several small, recurring gaps that live in the seam between systems, each invisible until the data from every source is compared side by side.
01
Gauging Measurement Error
Manual dip readings and older float gauges carry inherent measurement uncertainty that compounds across dozens of tanks and hundreds of readings per month, producing a book-to-physical gap that looks random until it is tracked systematically.
02
Temperature and Density Drift
Volume calculations that use outdated or infrequently updated temperature and density corrections misstate net standard volume, an error that grows with ambient temperature swings and is easy to miss without continuous correction.
03
Evaporation and Vapor Loss
Volatile products lose measurable volume to evaporation during storage and transfer, a loss that is often folded into a generic shrinkage allowance rather than tracked per tank, per product, and per season.
04
Transfer and Timing Mismatches
A truck loading ticket, a pipeline meter reading, and a tank gauge reading taken at slightly different times during the same transfer window each capture a different snapshot of the same event, creating an apparent discrepancy that is actually just a timing artifact.
Reconciling Three Data Sources
What Each System Actually Tells You, and Where It Falls Short Alone
Data Source
What It Measures
Typical Standalone Error
Blind Spot Alone
Tank Gauging
Level, temperature, sometimes density per tank
Varies widely by gauge type and calibration age
Cannot see what left through a pipeline or truck bay
Pipeline Metering
Volume transferred through a line over time
Meter drift between calibration cycles
Cannot confirm the volume actually reached or left the tank
Truck Loading Tickets
Volume loaded per truck, per transaction
Manual entry and rounding at the loading rack
Cannot detect a discrepancy unless cross-checked against the tank it drew from
AI Reconciliation Layer
All three sources cross-checked against expected volumes continuously
Flags discrepancy beyond expected tolerance in near real time
Surfaces the gap before month-end, not after
A Month-End Inventory Report That Only Reconciles Once a Month Finds Every Loss Thirty Days Too Late.
iFactory reconciles tank gauging, pipeline metering, and truck loading data continuously, so a discrepancy surfaces the same shift it happens, not at the next audit.
Loss Category Breakdown
Measurement Error, Theft, and Evaporation Each Need a Different Response
A
Measurement Error
The largest share of apparent inventory loss at most terminals traces back to accumulated gauging and metering uncertainty rather than any physical product loss. AI reconciliation isolates this category first by comparing it against known instrument tolerance bands, so it stops consuming investigation time that should go toward genuine losses.
B
Evaporation and Handling Loss
Volatile product loss during storage and transfer follows predictable patterns tied to ambient temperature, tank type, and product vapor pressure. Modeling this per tank and per season separates expected shrinkage from an anomaly that needs investigation.
C
Theft and Diversion
The smallest but highest-consequence category, typically surfacing as a discrepancy that does not fit any measurement-error or evaporation pattern, concentrated around a specific tank, shift, or loading point rather than distributed evenly across the terminal.
Field Example
A Products Terminal Cutting Its Unexplained Monthly Variance by Two-Thirds
A refined products terminal running a mix of gasoline and distillate tanks had been carrying a monthly inventory variance that its operations team attributed broadly to "normal loss" without a category-level breakdown, a figure large enough that it drew attention during the site's annual financial audit two years running. Reconciliation between tank gauging, pipeline receipts, and truck loading tickets was performed manually at month-end, which meant any discrepancy was at least thirty days old by the time anyone investigated it.
iFactory connected all three data sources into a continuous AI reconciliation layer that flagged discrepancies against expected tolerance the same shift they occurred rather than waiting for month-end close. The system quickly isolated that roughly seventy percent of the prior "normal loss" figure was attributable to stale temperature correction factors on two specific tanks rather than genuine product loss, while a smaller but consistent variance on a single loading bay was traced to a truck ticket rounding pattern rather than evaporation. Within two reporting cycles, the terminal's unexplained monthly variance dropped by roughly two-thirds, and the remaining tracked variance is now categorized by cause rather than treated as a single unexplained figure.
2/3 reduction
Unexplained monthly inventory variance
70%
Of prior "normal loss" traced to stale temperature correction
2 cycles
Reporting cycles to reach the corrected baseline
Self-Assessment
Signs a Terminal Needs Continuous Reconciliation
A
Variance Explained as "Normal Loss"
A recurring monthly shrinkage figure that gets written off with a generic explanation rather than broken down by tank, product, and cause is usually hiding a mix of fixable measurement error and genuine loss.
B
Reconciliation Happens Once a Month
If gauging, metering, and loading data are only compared against each other at month-end close, every discrepancy is already weeks old before anyone has the chance to investigate it.
C
Temperature Correction Factors Rarely Updated
Stale temperature and density corrections are one of the most common sources of apparent inventory loss, and they are also one of the easiest to fix once identified through continuous monitoring.
D
No Per-Tank, Per-Product Evaporation Model
Applying one blanket shrinkage allowance across every tank and product on site makes it impossible to tell whether a specific tank's variance is normal seasonal evaporation or something that needs investigation.
Program Design
Building an Audit-Ready Reconciliation Program
1
Connect Every Data Source Continuously
Tank gauging, pipeline metering, and truck loading systems all need to feed the reconciliation layer in near real time rather than through periodic manual exports, which is the difference between catching a discrepancy same-shift versus at month-end.
2
Separate Expected Variance From Anomalies
Build tolerance bands for known measurement uncertainty and seasonal evaporation per tank and per product so the system can distinguish normal noise from a pattern that actually warrants investigation.
3
Log Every Reconciliation Event
A timestamped record of every discrepancy, its assigned category, and its resolution is exactly the evidence chain an internal or third-party audit expects to see rather than a single unexplained month-end variance figure.
4
Review Category Trends Quarterly
Categorized loss data becomes far more useful over time, revealing whether a specific tank consistently runs high measurement error, a loading bay has a recurring ticketing issue, or a genuine anomaly needs escalation.
Frequently Asked Questions
What Terminal and Inventory Control Teams Ask Before Deploying This
How is this different from the reconciliation our terminal management software already does?
Most terminal management software reconciles data on a scheduled basis, often daily or at shift change, and treats each data source largely independently rather than continuously cross-validating gauging, metering, and loading data against each other in near real time. The AI layer is built specifically to catch a discrepancy within the same operating window it occurs, and to distinguish between measurement-error patterns, evaporation patterns, and anomalies that warrant investigation, which a scheduled batch reconciliation process typically cannot do on its own.
Can this help us separate genuine theft risk from normal measurement noise?
Yes, this is one of the most valuable outcomes for terminal operators, since a large share of what gets labeled as "shrinkage" or "unexplained loss" in a manual review is actually accumulated instrument tolerance or evaporation that follows predictable seasonal patterns. By modeling expected variance for each category separately, the system surfaces a genuine anomaly, such as a discrepancy concentrated on one tank or shift that does not fit any expected pattern, as a distinct and investigable signal rather than burying it inside a generic monthly variance number.
Do we need to replace our existing tank gauges to use this?
In most cases no, the reconciliation layer is built to ingest data from existing automatic tank gauging, pipeline metering, and loading rack systems rather than requiring a full instrumentation replacement. Terminals still relying primarily on manual dip gauging will see the largest accuracy improvement from adding continuous level instrumentation, but the reconciliation and anomaly detection layer itself works with whatever measurement infrastructure is already in place. Reach out to
iFactory support to review compatibility with your specific gauging and metering systems.
How quickly can a terminal expect to see its variance categorized accurately?
Once the data sources are connected, the system typically needs a few reporting cycles of continuous data to build an accurate baseline for expected measurement tolerance and evaporation behavior per tank and per product, after which discrepancy categorization becomes reliable enough to act on. Many terminals see meaningful insight within the first reporting cycle, with the categorization accuracy improving further as the seasonal evaporation model incorporates more data across temperature ranges.
Does this integrate with mixed product terminals handling crude, refined fuels, and chemicals together?
Yes, the reconciliation and loss modeling accounts for the specific handling properties of each product type stored, since evaporation behavior, temperature sensitivity, and typical measurement tolerance all vary meaningfully between crude, refined fuels, and chemical products. A mixed product terminal benefits from having each product category modeled separately rather than applying one blanket loss allowance across the entire site. To see how this would map to your specific product mix,
book a demo.
Stop Waiting for Month-End to Find Out What Your Tank Farm Actually Lost.
Continuous AI reconciliation across tank gauging, pipeline metering, and truck loading data, so measurement error, evaporation, and genuine loss are never lumped into one unexplained number again.