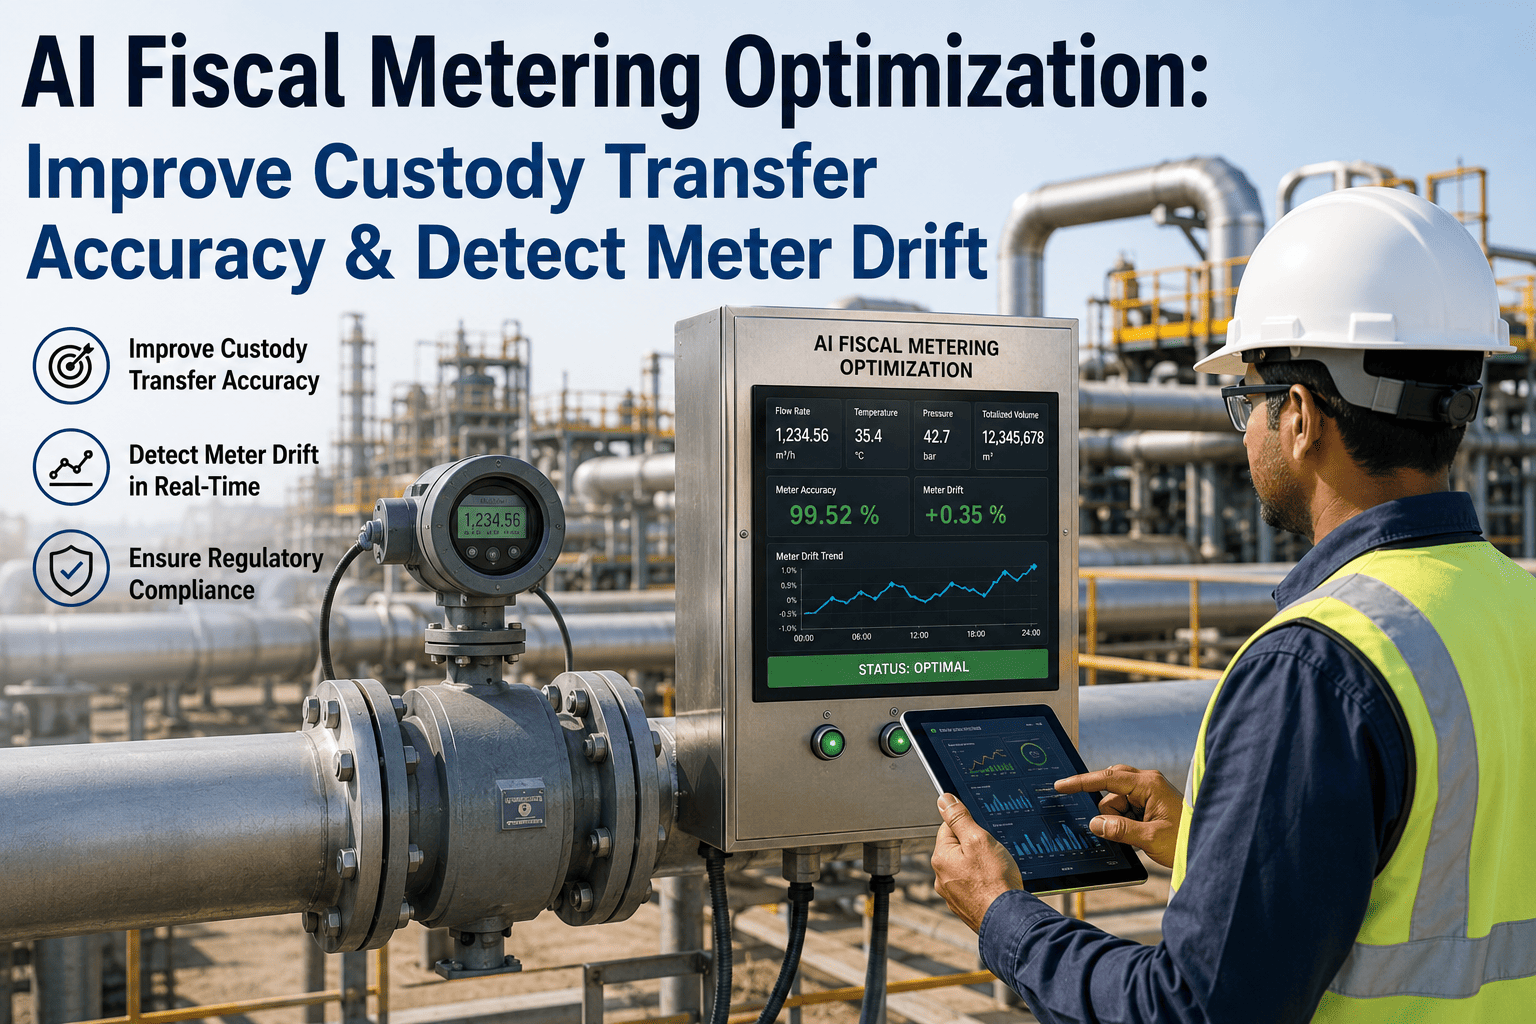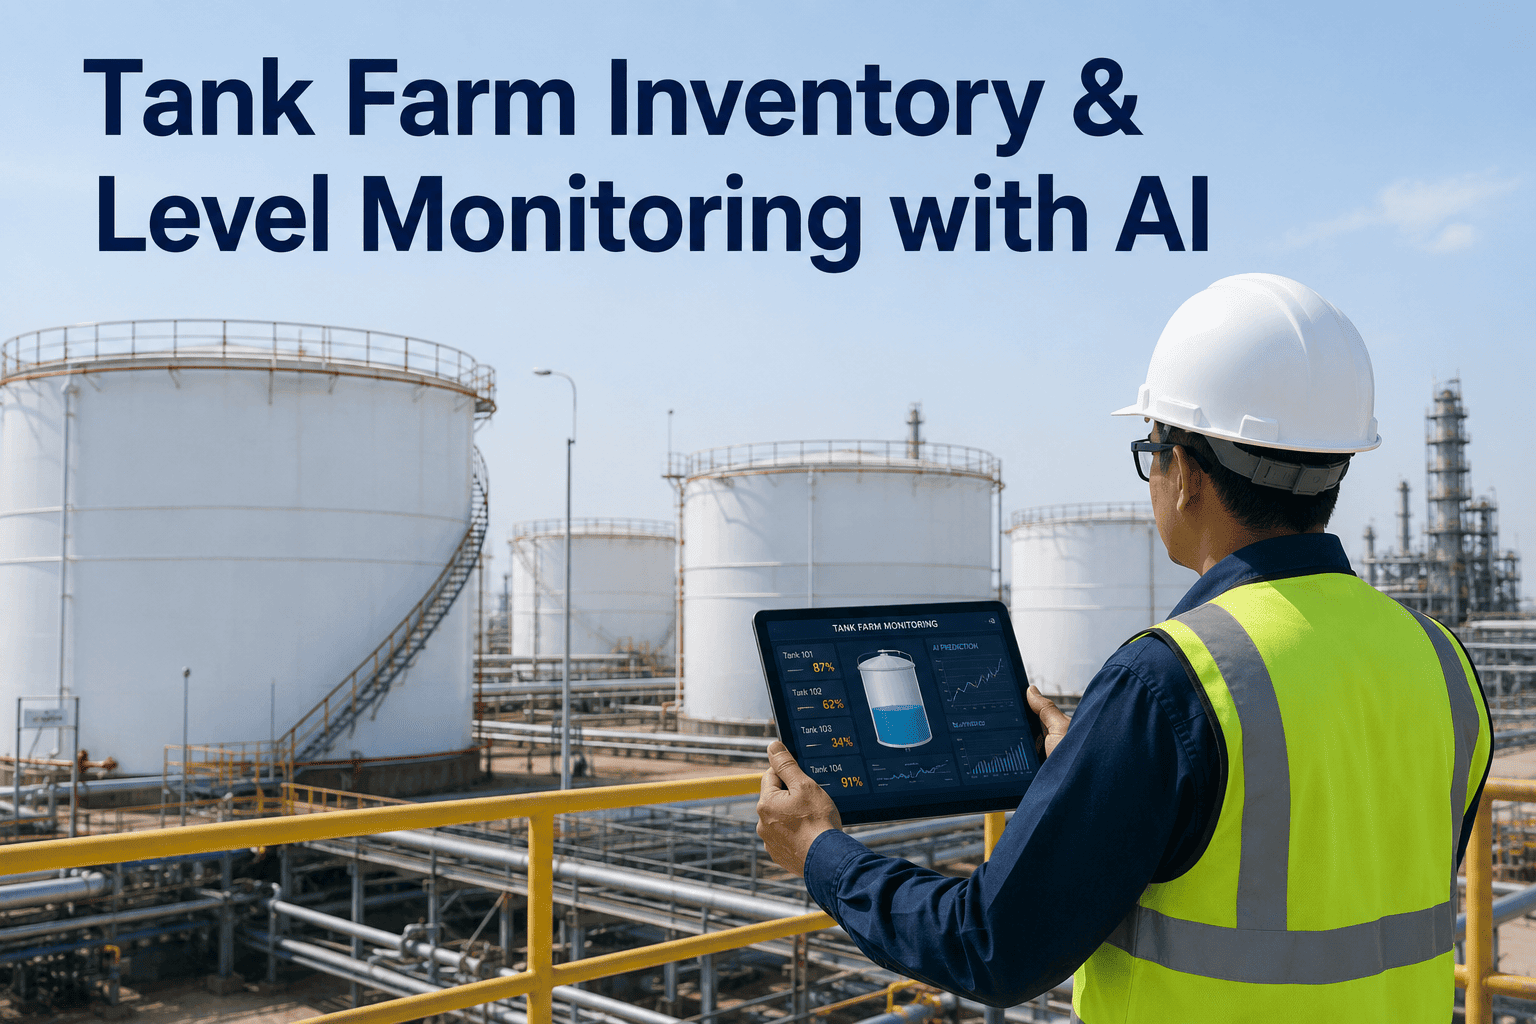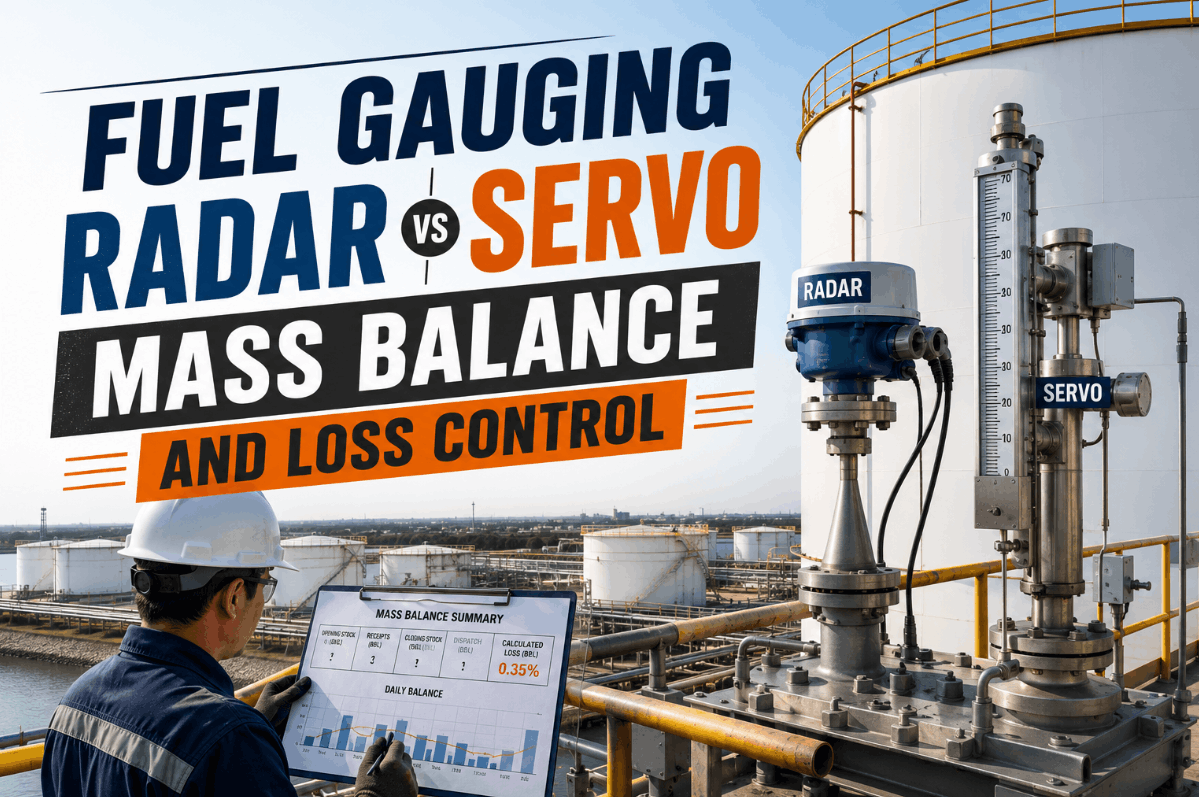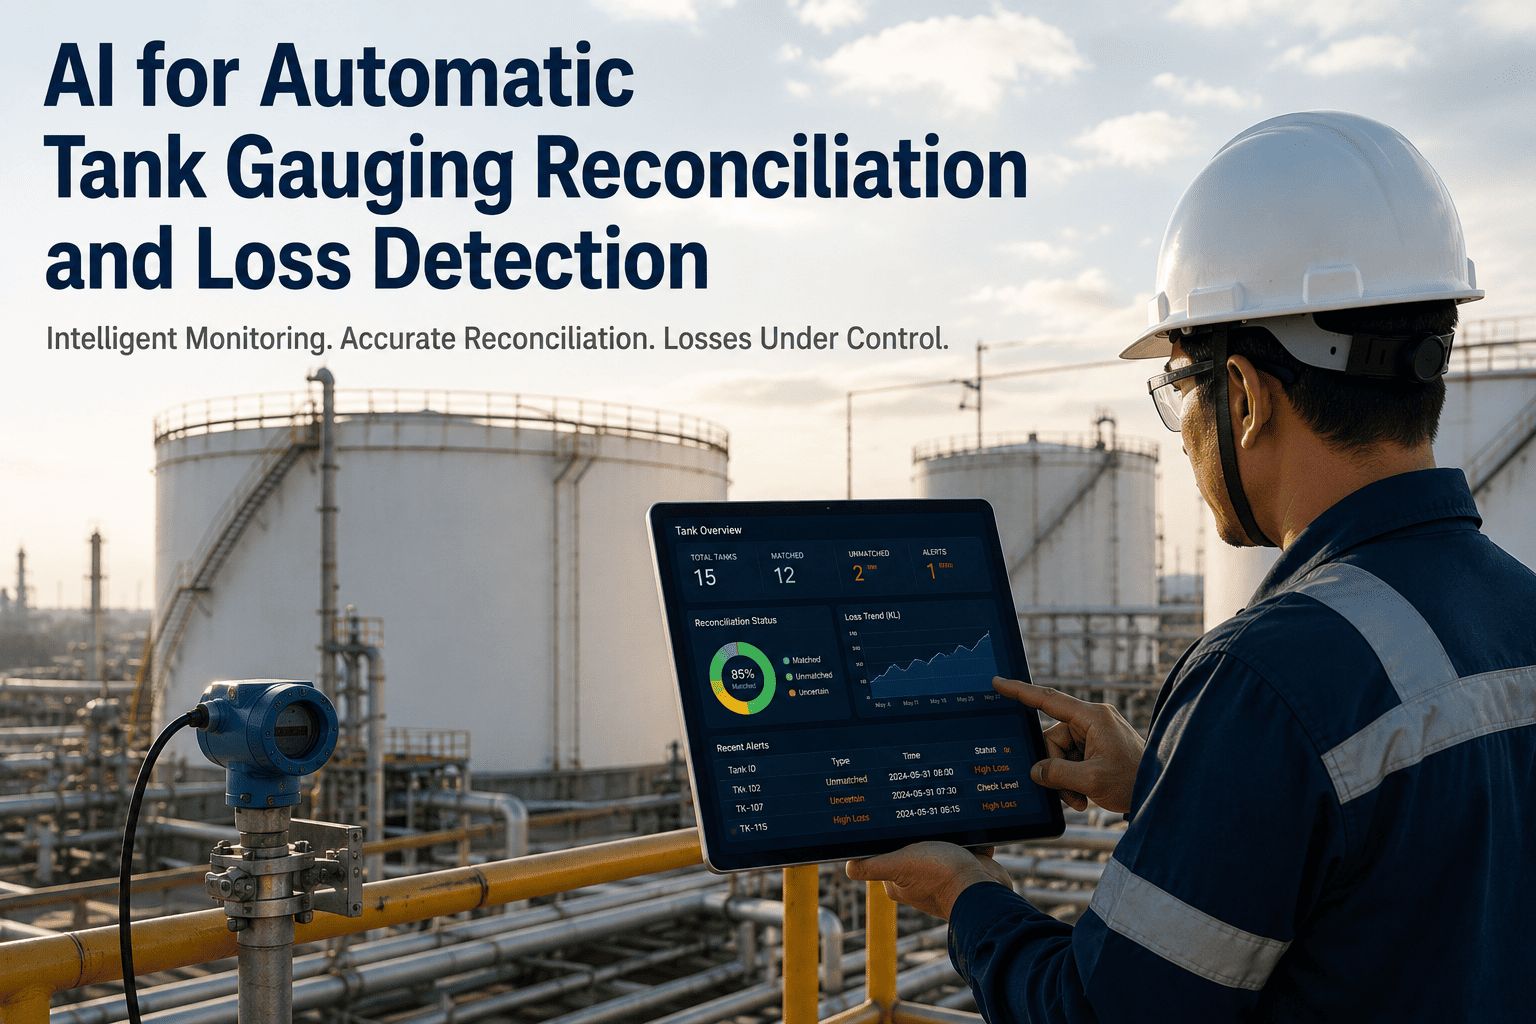
A tank farm can have a perfectly functioning automatic tank gauge, a perfectly functioning pipeline meter, and a perfectly functioning truck loading system, and still lose track of product every single month — because each of those three systems measures volume its own way, at its own moment, under its own temperature assumption, and nothing forces them to agree with each other automatically. Inventory reconciliation is the process of proving that what the tank gauge says is in storage actually matches what the meters say came in and went out, corrected to a common temperature standard so the comparison means something. iFactory's tank gauging reconciliation runs that comparison continuously across every source feeding the balance, so a real discrepancy gets flagged within a shift instead of surfacing three weeks later as an unexplained line on a monthly inventory report.
The Gauge Says One Number. The Meters Say Another. Which One Is Right?
Book inventory and measured inventory are supposed to match after temperature correction. When they don't, AI reconciles every data source continuously to show whether the gap is evaporation, a drifting strapping table, a meter calibration issue, or something that needs a closer look.
From a Gauge Reading to a Number You Can Actually Compare
A raw tank level reading is not directly comparable to a pipeline meter total or a truck loading ticket, because a level reading has to pass through several correction steps before it becomes a standardized volume figure. Skipping or mishandling any one of these steps is one of the most common reasons two systems that are each individually accurate still fail to reconcile with each other.
Gross Observed Volume
The raw liquid volume calculated from the tank level reading against the tank's strapping table, at whatever temperature the product happens to be at that moment.
Temperature Correction (CTL)
A correction factor applied per API MPMS Chapter 11.1 that adjusts the observed volume to a standard reference temperature, accounting for the fact that petroleum liquids expand and contract measurably with temperature.
Gross Standard Volume
The temperature-corrected volume, now on a common basis that can legitimately be compared against another measurement taken at a different temperature and time.
Net Standard Volume
The gross standard volume adjusted for free water, sediment, and other non-product content, arriving at the figure actually used for custody transfer and inventory accounting.
Five Places a Reconciliation Gap Actually Comes From
A variance between book inventory and measured inventory is a symptom, not a diagnosis, and the same size gap can trace back to entirely different root causes depending on the terminal. Sorting a discrepancy into the right category is what determines whether the fix is a recalibration, a strapping table update, or an investigation that needs to move fast.
| Discrepancy Source | Typical Signature | Who Owns the Fix |
|---|---|---|
| Evaporation / Vapor Loss | Small, consistent, temperature and product-type dependent | Operations — vapor recovery, tank roof condition |
| Strapping Table Drift | Gradual, tank-specific, grows slowly over years | Measurement engineering — tank recalibration |
| Meter Calibration Error | Consistent bias on one meter, appears across many transactions | Instrumentation — meter proving and calibration |
| Temperature Correction Error | Larger variance during seasonal temperature swings | Measurement engineering — CTL application review |
| Theft or Unauthorized Movement | Irregular timing, unexplained by any of the above | Security and loss prevention — investigation |
Three Sources, One Balance: Why Reconciliation Has to Triangulate
A tank gauging discrepancy rarely gets diagnosed correctly by looking at the tank alone, because the tank is only one leg of the inventory triangle. Comparing all three sources against each other — not just the tank against a static book figure — is what actually isolates where a discrepancy is coming from.
Automatic Tank Gauge
Continuous level measurement converted to volume through the tank's strapping table, representing what is physically present in storage at any given moment.
Pipeline Metering
Custody transfer meters recording volume moving into or out of the tank via pipeline, each with its own calibration history and proving schedule.
Truck Loading Data
Loading rack meter tickets recording volume dispatched by truck, which need to reconcile against both the tank draw-down and any pipeline receipts during the same period.
Periodic Wet-Stock Checks vs. Continuous AI Reconciliation
Many terminals still run reconciliation as a periodic exercise — a manual wet-stock check at shift end or month close, comparing a tank dip or ATG reading against delivery and loading records for that period. That approach catches large, obvious losses eventually, but it has real limits on speed and precision that continuous reconciliation is specifically designed to close.
Move From a Monthly Surprise to a Shift-Level Signal
iFactory applies the same statistical rigor regulators expect from certified loss-detection methods, but runs it continuously across every tank instead of at a single monthly checkpoint.
A Composite Scenario: The Variance That Wasn't Theft
A products terminal running a dozen above-ground storage tanks had, for several quarters, been carrying a small but persistent negative variance on one specific tank — book inventory consistently running slightly ahead of measured inventory, month after month. The pattern was enough to raise concern, and an initial internal review understandably started by treating it as a possible loss-prevention issue, since an unexplained shrinkage pattern is exactly the kind of signal that gets escalated to security first.
When continuous reconciliation was applied retroactively across the ATG, pipeline receipt, and truck loading data for that tank, a different pattern emerged. The variance tracked almost perfectly with ambient temperature swings across the review period, growing during the warmest months and nearly disappearing during the coldest ones — a signature far more consistent with a temperature correction issue than with theft, which would not be expected to follow a seasonal curve so cleanly. Further investigation traced the issue to an outdated strapping table on that specific tank, last calibrated years earlier, that had developed a small but real bias at the fill levels the tank operated at most often. Once the strapping table was recalibrated, the variance closed to within normal tolerance and stayed there through the following seasonal cycle. The terminal's inventory control manager noted afterward that the seasonal pattern had actually been visible in the raw data the entire time — it simply hadn't been laid out against ambient temperature until continuous reconciliation put both trends on the same timeline.
Rolling Out Continuous Tank Gauging Reconciliation
Data Source Integration
Connect ATG readings, pipeline meter data, and truck loading tickets into one continuous data stream, applying standard temperature correction consistently across all three.
Historical Baseline Review
Run the reconciliation model against historical data to establish each tank's normal variance range and identify any existing unresolved discrepancies.
Cause Categorization Tuning
Calibrate the model against known evaporation rates, meter calibration schedules, and strapping table update history so flagged variances get routed to the right category automatically.
Continuous Live Monitoring
Move reconciliation to a continuous, shift-by-shift cadence with automated alerts for any tank whose variance trend departs from its established normal range.
Common Mistakes When Building a Reconciliation Program
Comparing Uncorrected Volumes
Comparing a raw tank reading directly against a meter total without applying consistent temperature correction to both manufactures a variance that isn't a real loss at all, just an artifact of comparing numbers on different bases.
Reconciling Only at Month End
Waiting for a monthly cycle to check the balance means a developing issue — a slow meter drift, a gradually failing seal — has weeks to compound before anyone has a chance to notice the pattern forming.
Treating Every Variance as a Security Issue
Escalating every unexplained gap straight to a theft investigation, without first ruling out evaporation, calibration drift, or a temperature correction issue, wastes investigative effort and delays the fix that would have actually closed the gap.
Frequently Asked Questions
Why do ATG readings and pipeline meter totals not match even when both are working correctly?
Both systems can be individually accurate and still disagree because they measure volume at different points in time, under different temperatures, and pass through different correction steps before the numbers are directly comparable. Temperature correction to a standard reference basis under API MPMS Chapter 11.1 is what makes the comparison meaningful in the first place — skipping or mishandling that step is a common source of an apparent variance that isn't actually a loss. Visit support to see how reconciliation handles temperature correction across your specific tanks.
How does AI tell the difference between evaporation, a calibration issue, and actual theft?
Each cause tends to leave a different signature in the data — evaporation typically tracks temperature and product volatility, a calibration or strapping table issue tends to be consistent and tank-specific, and theft or unauthorized movement usually shows up as an irregular pattern that doesn't correlate with any of the expected physical variables. Continuous reconciliation across all three data sources makes it possible to compare a current variance against these known signatures rather than guessing from a single monthly number. Book a demo to see how cause categorization works against your terminal's data.
What accuracy level does automated inventory reconciliation need to meet?
A commonly referenced regulatory benchmark for automated inventory reconciliation is the ability to detect a loss rate down to roughly 0.76 liters per hour with at least 95% accuracy, a standard originally established for underground storage tank leak detection that continues to inform how reconciliation system performance gets evaluated more broadly. Meeting that sensitivity generally requires continuous data collection rather than periodic manual checks, since infrequent sampling simply can't resolve a loss that small against normal measurement noise.
Does a strapping table need to be recalibrated on a schedule, or only when a problem appears?
Tank geometry can shift gradually over years due to foundation settlement, structural changes, or wear, which means a strapping table that was accurate when installed can develop a real bias long before anyone notices a specific problem. Continuous reconciliation is valuable specifically because it can surface that kind of slow, gradual drift as a trend well before it grows large enough to trigger a manual investigation on its own.
Can this replace a certified loss-detection method required for regulatory compliance?
Statistical inventory reconciliation is itself a recognized loss-detection method under standards like those applied to underground storage tanks, provided it meets the required sensitivity and accuracy thresholds, so a properly configured continuous reconciliation program can serve that compliance function rather than sitting alongside it as a separate tool. Contact support to review how a specific deployment aligns with your compliance requirements.
Know Which Number Is Right Before the Month-End Report Does
iFactory reconciles ATG, pipeline metering, and truck loading data continuously, so an inventory variance gets a cause attached within a shift, not discovered as an unexplained line item weeks later.