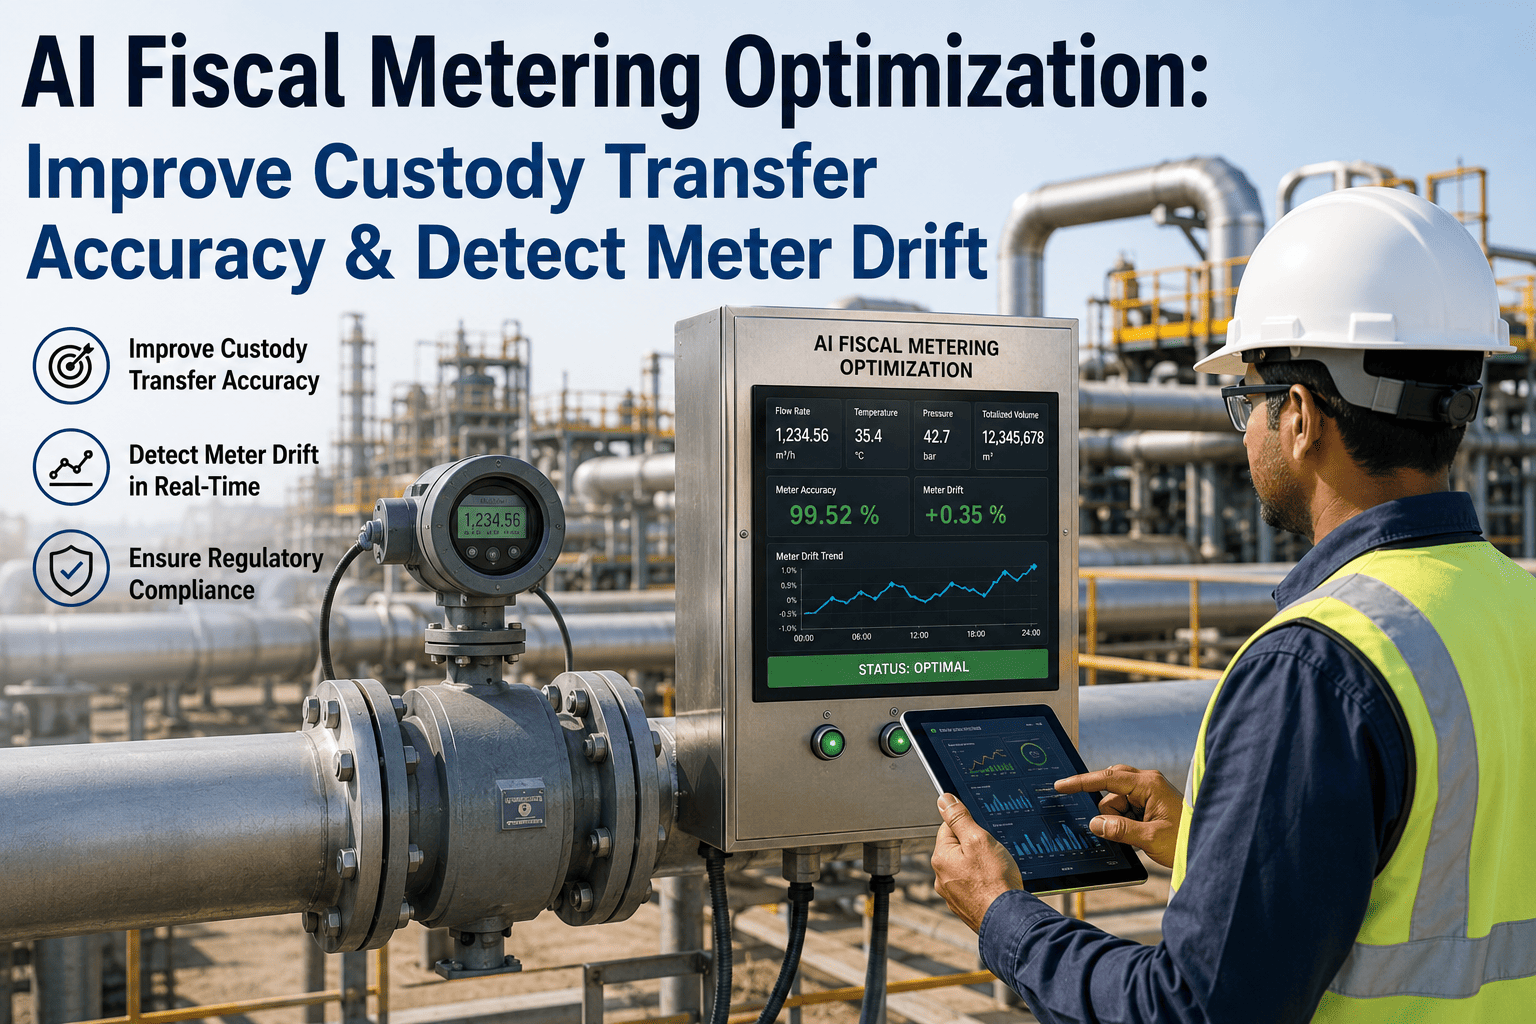
Every barrel of oil or cubic meter of gas that crosses a custody transfer point carries a dollar value attached to it, and that value gets calculated by a meter that nobody is watching in real time. Fiscal metering systems are proved on a calendar, typically annually, sometimes quarterly for critical applications, which means a meter can drift out of tolerance the day after a successful proving run and keep drifting for months before anyone catches it. On a high-volume transfer point, a 0.25% error can equate to roughly $480,000 in annual financial exposure. AI-based drift detection watches meter performance continuously between provings, catching temperature compensation errors, proving inconsistencies, and gradual accuracy shift long before the next scheduled calibration would ever reveal it. To see this running against your own metering data, book a demo.
METERING INTELLIGENCE · FISCAL METERING · CUSTODY TRANSFER
Catch Meter Drift Between Provings, Not At the Next One
iFactory's AI continuously monitors fiscal metering accuracy, detecting meter drift, temperature compensation errors, and proving inconsistencies in real time so custody transfer losses get caught in days, not at the next scheduled calibration.
THE FINANCIAL STAKES
Why a Fraction of a Percent Is a Six-Figure Problem
Custody transfer measurement isn't held to a tight uncertainty standard out of caution, it's held to that standard because the volumes involved turn a tiny percentage error into real money almost immediately. The math is not abstract, it scales directly with throughput.
$480K
Annual Exposure at 0.25% Error
On a transfer point moving 3 million standard cubic meters of gas per day, an error this small equates to roughly this much in annual financial risk at typical gas pricing.
±0.167%
Max Allowable Accuracy Shift
International metrology standards for custody transfer set this as the maximum allowable shift in accuracy compared to a reference standard under disturbed flow conditions.
$1M+
Daily Value at High-Volume Points
The value of gas or oil changing hands at the point of custody transfer on a high-volume pipeline can amount to a million dollars or more in a single day.
A small systematic bias multiplied by millions of barrels or MMBtu a year doesn't stay a rounding error, it becomes a real financial dispute between buyer and seller, which is exactly why the entire custody transfer chain, from meter selection to proving to documentation, exists to eliminate exactly this kind of gap.
THE CALENDAR PROBLEM
Why Scheduled Proving Leaves a Blind Spot
Meter proving works, but it's a snapshot, not continuous coverage. A meter that passes its proving run on a given day can still drift out of tolerance the very next day, and under a standard annual or quarterly calibration schedule, that drift can run undetected for months.
1
Meter Proved
The meter passes its scheduled proving run against a reference standard, confirming it's within tolerance on that specific day, under those specific conditions.
→
2
Conditions Shift
Temperature, pressure, flow rate, or fluid composition change over the following weeks, conditions that a calendar-based schedule has no way to react to as they happen.
→
3
Drift Accumulates
Small, gradual accuracy shift compounds silently, since flow meters don't usually get much attention and a drift can go unnoticed for a long time under routine operation.
→
4
Next Proving Reveals It
Months of misallocated volume only comes to light at the next scheduled calibration, by which point the financial exposure has already accumulated and is difficult to fully reconcile.
This isn't a flaw in proving as a practice, proving is still the accuracy standard the industry relies on. The gap is what happens in between, and that gap is exactly where continuous AI-based monitoring adds coverage that a calendar schedule structurally cannot provide.
Get your metering data reviewed for drift exposure
iFactory can run a diagnostic pass against your historical meter data to show what a continuous monitoring layer would have caught between your last few provings.
THREE ERROR SOURCES
What's Actually Causing the Accuracy Loss
Fiscal metering accuracy loss doesn't come from one cause, it comes from at least three distinct sources, each with a different signature in the data and a different reason it can slip past a routine calibration check.
METER DRIFT
Gradual Sensor Accuracy Shift
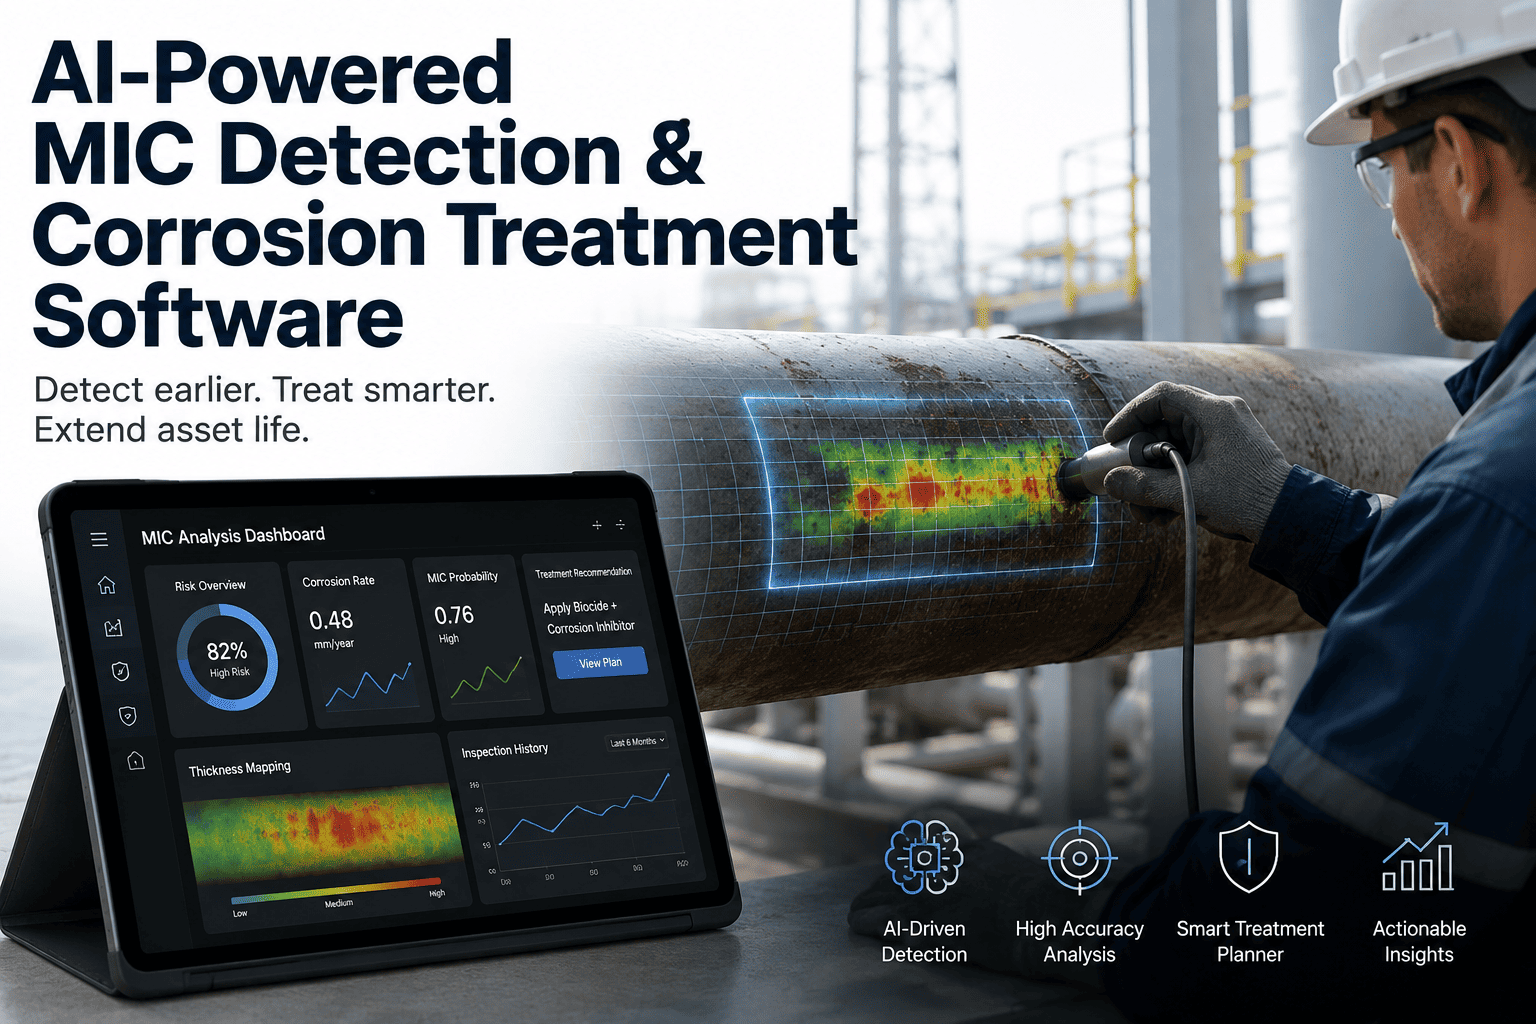
Mechanical wear, sensor fouling, or electronic component aging cause the meter's actual output to diverge slowly from true flow, a change too gradual to notice day to day but very real over months.
TEMPERATURE COMPENSATION
Correction Factor Errors
Fiscal calculations depend on live temperature and pressure correction to standard conditions, and a fault in that correction chain silently skews every volume calculation downstream of it.
PROVING INCONSISTENCY
Unstable or Anomalous Proving Runs
A proving run that produces inconsistent results across repeat passes, or that quietly diverges from historical proving factor trends, is a signal that something in the measurement chain needs attention before the next scheduled interval.
CALENDAR VS CONTINUOUS
Scheduled Calibration Compared to Continuous Monitoring
The choice isn't continuous monitoring instead of proving, it's continuous monitoring alongside proving, extending the confidence you get from a calibration event into every day in between it.
| Factor |
Calendar-Based Proving |
Continuous AI Monitoring |
| Coverage |
A single point-in-time snapshot, typically annual or quarterly |
Continuous, watching every measurement cycle between provings |
| Drift Detection Speed |
Discovered only at the next scheduled calibration |
Flagged within days of the drift pattern emerging |
| Root Cause Visibility |
As-found data shows the error exists, not always when it started |
Trend data pinpoints roughly when the drift began |
| Operational Cost |
Requires bypasses, spare meters, and downtime during proving |
Runs passively on existing measurement data, no service interruption |
| Audit Trail |
As-found and as-left records at each proving event |
Continuous trend log supporting dispute resolution and audits |
Continuous monitoring doesn't replace the documented, standards-compliant proving process your contracts require, it closes the blind spot between proving events so a drift doesn't get to run undetected for months before it's caught.
HOW THE MONITORING WORKS
From Live Data to a Validated Alert
Continuous metering monitoring follows a defined process from raw flow computer data through to an alert your metering engineers can actually act on, without adding noise to a system that already has enough alarms.
1
Data Ingestion
Live flow, pressure, temperature, and calculated volume data streams in from your flow computers and SCADA system continuously, without requiring new hardware at the meter run.
→
2
Baseline Modeling
The system establishes an expected performance baseline from your historical data, including known proving factors and correction behavior specific to your metering point.
→
3
Deviation Detection
Statistical process control methods track meter behavior against that baseline, flagging deviations that exceed expected measurement noise rather than reacting to every minor fluctuation.
→
4
Root Cause Attribution
The flagged deviation is checked against likely causes, drift, temperature compensation fault, or proving inconsistency, so the alert tells your team where to look, not just that something is wrong.
→
5
Engineer Validation
A metering engineer reviews the flagged trend and decides on next steps, an early proving run, an inspection, or continued monitoring, keeping a qualified professional in the decision loop.
TURNKEY DELIVERY
How iFactory Deploys Metering Intelligence on Your System
iFactory connects to your existing flow computers and SCADA infrastructure, establishes a performance baseline from your historical data, and delivers drift alerts to your metering engineers without requiring new hardware at the meter run.
What Gets Built
Integration with existing flow computer and SCADA data, no new field hardware required
Baseline modeling specific to each metering point's historical proving and correction behavior
Statistical deviation detection tuned to distinguish real drift from routine measurement noise
Root cause attribution across drift, temperature compensation, and proving inconsistency
24x7 remote monitoring with alerting routed to your metering engineering team
Deployment Timeline
Weeks 1-4: Flow computer and SCADA integration, historical data pull, baseline setup
Weeks 5-8: Baseline validation against known proving history, deviation threshold tuning
Weeks 9-12: Alerting go-live, engineer training, ongoing monitoring handoff
FREQUENTLY ASKED QUESTIONS
What Metering Engineers Ask Before Adding AI Monitoring
Does this replace our meter proving program, or work alongside it?
Alongside it, not instead of it. Meter proving remains the standards-compliant, contractually recognized method for validating custody transfer accuracy, and nothing about continuous AI monitoring changes that requirement or the documentation your contracts and regulators expect. What continuous monitoring adds is coverage in the gap between proving events, since a meter can drift out of tolerance the day after a successful proving and go undetected for months under a purely calendar-based schedule. iFactory's monitoring layer is built to complement your existing proving program, not substitute for it.
Book a demo to see how this fits alongside your current proving schedule.
How does the system tell the difference between real drift and normal measurement noise?
This is the core challenge continuous monitoring has to solve, and it's handled through statistical process control methods that establish an expected baseline from your own historical meter performance rather than an arbitrary industry-wide threshold. Deviations are only flagged once they exceed the normal variation your specific metering point has historically shown, which is what keeps the system from generating constant false alarms on routine fluctuation. This baseline-relative approach is also what allows the system to work with minimal new instrumentation, since it can learn from data your flow computers are already producing.
Contact our support team to review how baseline modeling would work against your specific meter history.
Do we need to install new sensors or hardware at the meter run for this to work?
In most cases, no. The monitoring system is built to ingest data your flow computers and SCADA infrastructure are already generating, flow rate, temperature, pressure, and calculated volume, rather than requiring new field instrumentation at each metering point. This is what makes deployment realistic across an existing metering fleet without a capital project at every site. Where a specific metering point lacks the data resolution needed for reliable drift detection, that gap gets identified during the initial audit rather than assumed away.
Book a demo to review your current instrumentation against monitoring requirements.
What happens when the system flags a potential drift, does it trigger an automatic action?
No, a flagged deviation routes to your metering engineering team for review rather than triggering an automatic response, since decisions like scheduling an early proving run or dispatching an inspection require professional judgment and carry real operational cost. The system's role is to surface a trend early enough that your team has time to investigate before the drift compounds into a significant financial or contractual issue, not to make that call on its own. Every flagged event includes the trend data and likely root cause, so the engineer reviewing it has the context needed to decide quickly.
Contact our support team to discuss alert routing and escalation for your metering team's workflow.
How long until we'd actually see a drift catch, or is this mostly a long-term risk reduction play?
Both, though the timeline for a first real catch depends heavily on how much existing drift or instability is already present in your metering fleet. Baseline validation in weeks five through eight often surfaces historical patterns worth investigating even before the system is fully live, since comparing current data against your documented proving history can reveal gradual trends that were never flagged in real time. Once monitoring is fully active, the value compounds over the life of the meter, since the whole point is catching what a calendar-based proving schedule would have missed for months.
Book a demo to see what a diagnostic pass against your own historical data would surface.
CONTINUOUS COVERAGE, NOT A CALENDAR SNAPSHOT
Close the Gap Between Provings Before It Costs You
iFactory's AI continuously monitors fiscal metering accuracy, catching drift, temperature compensation errors, and proving inconsistencies days after they emerge instead of months later at the next scheduled calibration.