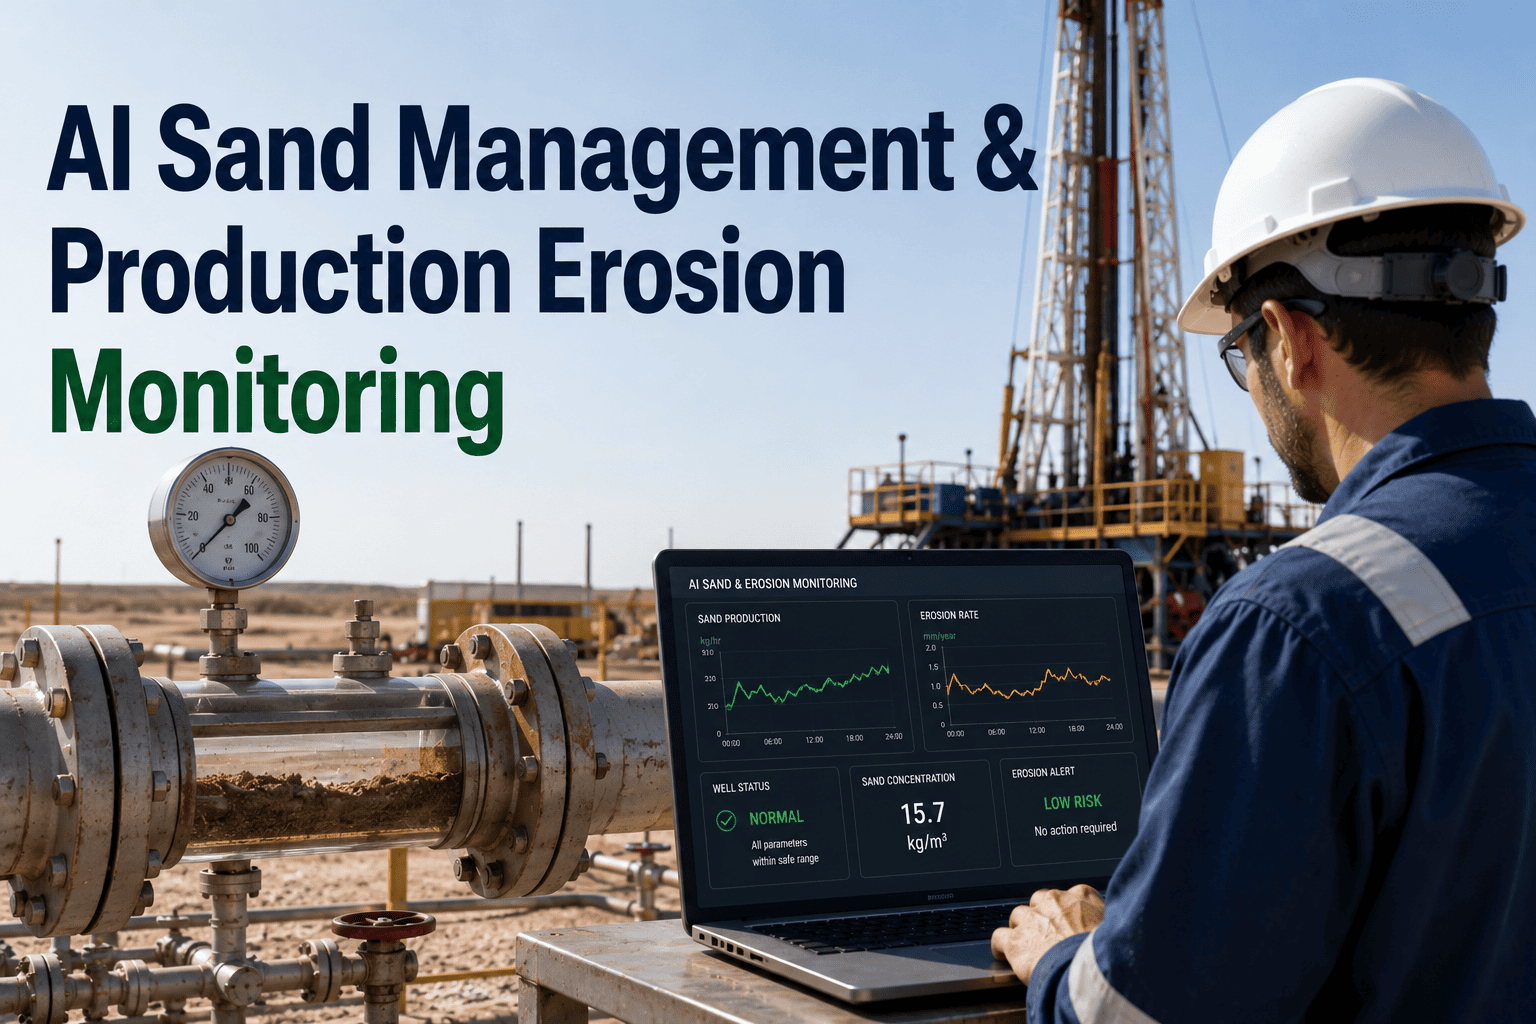
Unconsolidated and weakly consolidated reservoirs across the Gulf of Mexico, West Africa, and Southeast Asia routinely produce formation sand alongside oil and gas, and every grain that reaches surface equipment removes a small amount of metal from chokes, elbows, and separator internals. Left unmonitored, that erosion accumulates quietly until a choke fails or a pipeline wall thins past its safe operating limit, often with no warning beyond a maintenance log nobody reviewed in time. AI-based sand management systems change that by correlating acoustic sand detectors, erosion probes, and production data in real time, flagging rising sand cut and erosion rate long before they force an unplanned shutdown. Operators running high sand-cut wells increasingly treat this kind of continuous monitoring as a production integrity requirement rather than an optional upgrade, a shift covered in more detail in iFactory's support documentation.
01 / The Hidden Cost Of Formation Sand Production
Sand production rarely announces itself with a single dramatic event. Instead it wears away choke trim, thins pipe walls at bends and tees, and gradually degrades separator internals, and because the damage is internal, operators typically only notice once a pressure test or an inspection catches wall loss already well underway. The wells that produce the most sand are frequently also the highest-rate producers, which means unplanned downtime on these wells carries an outsized production impact relative to lower-rate wells elsewhere on the same pad.
02 / How AI Reads Sand Production Signatures
Sand management data typically arrives from several independent sources that were never designed to talk to each other — acoustic sand detectors clamped on the flowline, intrusive erosion probes, choke position history, and periodic production tests. Treated separately, each source gives a partial and often noisy picture. An AI layer trained on this combination cross-checks signals against one another, filtering out flow-noise false positives and surfacing genuine sand cut increases with far more confidence than any single sensor reading alone.
| Data Source | What It Measures | What AI Correlation Adds |
|---|---|---|
| Acoustic Sand Detectors | Relative sand particle impact rate on the flowline | Filters flow-regime noise from genuine sand cut trend |
| Erosion Probes | Cumulative metal loss at fixed monitoring points | Projects remaining wall-loss life at current trend |
| Choke Position History | Drawdown and rate changes affecting sand onset | Links choke moves directly to erosion rate changes |
| Production Test Data | Periodic sand cut and rate sampling | Anchors continuous signals to verified lab-grade points |
03 / Predicting Erosion Rate Before It Becomes Wall Loss
Erosion rate prediction combines established industry velocity limit calculations with a machine learning layer that continuously recalibrates against actual measured wall loss, closing the gap between a generic design-stage estimate and what a specific well is really doing in the field.
04 / Where Continuous Sand Monitoring Pays Off Fastest
Not every well needs the same level of monitoring investment, and prioritizing continuous sand management on the highest-risk wells is how most operators justify the initial rollout before expanding coverage.
05 / Sand Screen And Gravel Pack Performance Tracking
Sand exclusion hardware such as screens and gravel packs is selected at completion based on formation particle size distribution, but real downhole performance can drift from the original design as the formation produces over time.
06 / Rolling Out Continuous Sand Monitoring Without Disrupting Operations
Moving from periodic sand sampling to continuous monitoring is usually a phased rollout rather than a single field-wide switch, and the order in which wells get added to the program matters as much as the underlying technology itself. Most operators start with a small group of the highest sand-cut wells to validate that the AI correlation model is reading their specific sensor mix correctly before expanding coverage, since baseline noise levels and detector sensitivity can vary meaningfully between wells even on the same pad. Once the model is calibrated against a handful of wells with known erosion history, extending it to additional wells typically requires far less tuning, because the underlying correlation logic transfers even though absolute sand cut and erosion rate values differ well to well.
07 / Why Sand Behavior Changes Over Field Life
Sand production is rarely constant across a well's producing life, and treating an early monitoring baseline as permanent is one of the more common gaps in otherwise well-run sand management programs. As reservoir pressure depletes, operators frequently increase drawdown to sustain production rates, and that increased drawdown is one of the most common drivers of rising sand production later in field life even on wells that produced clean for years. Workovers, stimulation treatments, and changes in artificial lift method can also shift sand production behavior in ways a static, one-time screen or gravel pack design never anticipated. Continuous monitoring is what actually catches this kind of gradual behavioral shift, since a periodic annual test schedule can easily miss a trend that develops and accelerates between two scheduled sampling dates.
08 / Turning Sand Data Into An Integrity Reporting Asset
Beyond preventing unplanned downtime, documented sand and erosion monitoring increasingly supports asset integrity audits and insurer reviews, particularly on aging infrastructure where regulators and underwriters expect evidence of active wall-loss management rather than a design-stage assumption alone. Continuous monitoring data, tracked and time-stamped against inspection intervals, gives integrity teams a defensible record showing erosion risk was actively managed rather than assumed away, which carries considerably more weight in an audit than a static corrosion allowance calculation from the original design basis. Facilities that already run this kind of continuous tracking typically find integrity reviews move faster because the supporting evidence is already assembled rather than reconstructed after the fact.
09 / Conclusion — From Reactive Replacement To Predictive Sand Management
Sand production is a manageable production integrity risk once acoustic detectors, erosion probes, and production history are read together rather than reviewed in isolation, and the lead time an AI-driven model provides is usually the difference between a scheduled choke replacement and an unplanned shutdown. Book a demo to see an erosion risk model built around your current well portfolio.
Frequently Asked Questions — AI Sand Management
Most deployments start with whatever sand detection and erosion monitoring hardware is already installed — acoustic sand detectors, intrusive erosion probes, and choke position logs are the most common inputs, supplemented by periodic production test sand cut readings. The system does not require replacing existing sensors; it is built to ingest data from whatever combination of detectors a facility already has in place, correlating them into a single trend rather than requiring a new instrumentation buildout. Wells with only production test data still benefit from trend analysis, though the lead time on alerts is shorter than with continuous acoustic or probe data feeding the model. Facilities considering additional sensor coverage can review recommended configurations through iFactory's support documentation.
Lead time depends heavily on how quickly a given well's sand cut is trending and how close current wall thickness is to its minimum allowable limit, but continuously monitored wells typically generate an actionable alert weeks to months before wall loss would reach a critical threshold under the prior trend. Wells with erratic or rapidly accelerating sand production see shorter lead times than wells with a slow, steady trend, which is part of why continuous monitoring outperforms periodic sampling on the highest-risk wells specifically. The exact window is always well-specific and depends on baseline wall thickness, material, and current erosion rate rather than a single fixed number across a field.
Continuous AI-based sand monitoring is designed to work alongside scheduled inspection programs rather than replace them outright, since physical inspection still provides ground-truth wall thickness verification that sensor-based trend data alone cannot fully substitute. What continuous monitoring changes is the inspection interval itself — wells showing stable, low sand production can often move to longer inspection cycles, while wells with a rising trend get flagged for earlier inspection than a fixed calendar schedule would have caught. This risk-based approach to inspection scheduling is increasingly accepted by integrity teams as a more efficient use of inspection resources than a uniform interval applied across every well regardless of actual condition.
Yes, historical sand cut and particle size trend data is one of the most useful inputs for sizing decisions on both choke trim material selection and surface desanding equipment capacity, since these decisions are frequently made at initial completion based on conservative estimates rather than actual measured field performance. As offset and infill wells come online, accumulated sand data from producing wells in the same formation gives a far more accurate basis for these sizing decisions than relying solely on original reservoir engineering estimates. This is particularly valuable on multi-well pads where desanding equipment is shared across wells with differing sand production profiles. Book a demo to discuss sizing support for your current well portfolio.
Older fields with legacy or partial instrumentation are common candidates for this kind of monitoring precisely because they often carry the highest accumulated wall-loss risk without a corresponding increase in monitoring investment over the years the field has been producing. Implementation typically starts with an inventory of existing sand detection and erosion monitoring hardware already in place, followed by an assessment of which additional sensor points would provide the highest-value coverage given the field's specific sand production history. Many legacy fields find that correlating existing partial data more effectively delivers meaningful improvement before any new hardware investment is even considered.