Corrosion doesn't announce itself. A pipeline losing wall thickness to CO2 and H2S, a tank floor thinning from water bottoms, a piping run under insulation hiding moisture against the metal — none of it shows up until a coupon, probe, or inspection catches it, and by then the damage has already been accumulating for months. Industry estimates put avoidable corrosion cost at roughly 25 to 30% of total corrosion spend, money lost simply because monitoring and mitigation weren't connected into one strategy. See how iFactory connects your corrosion data into one strategy — book a demo.
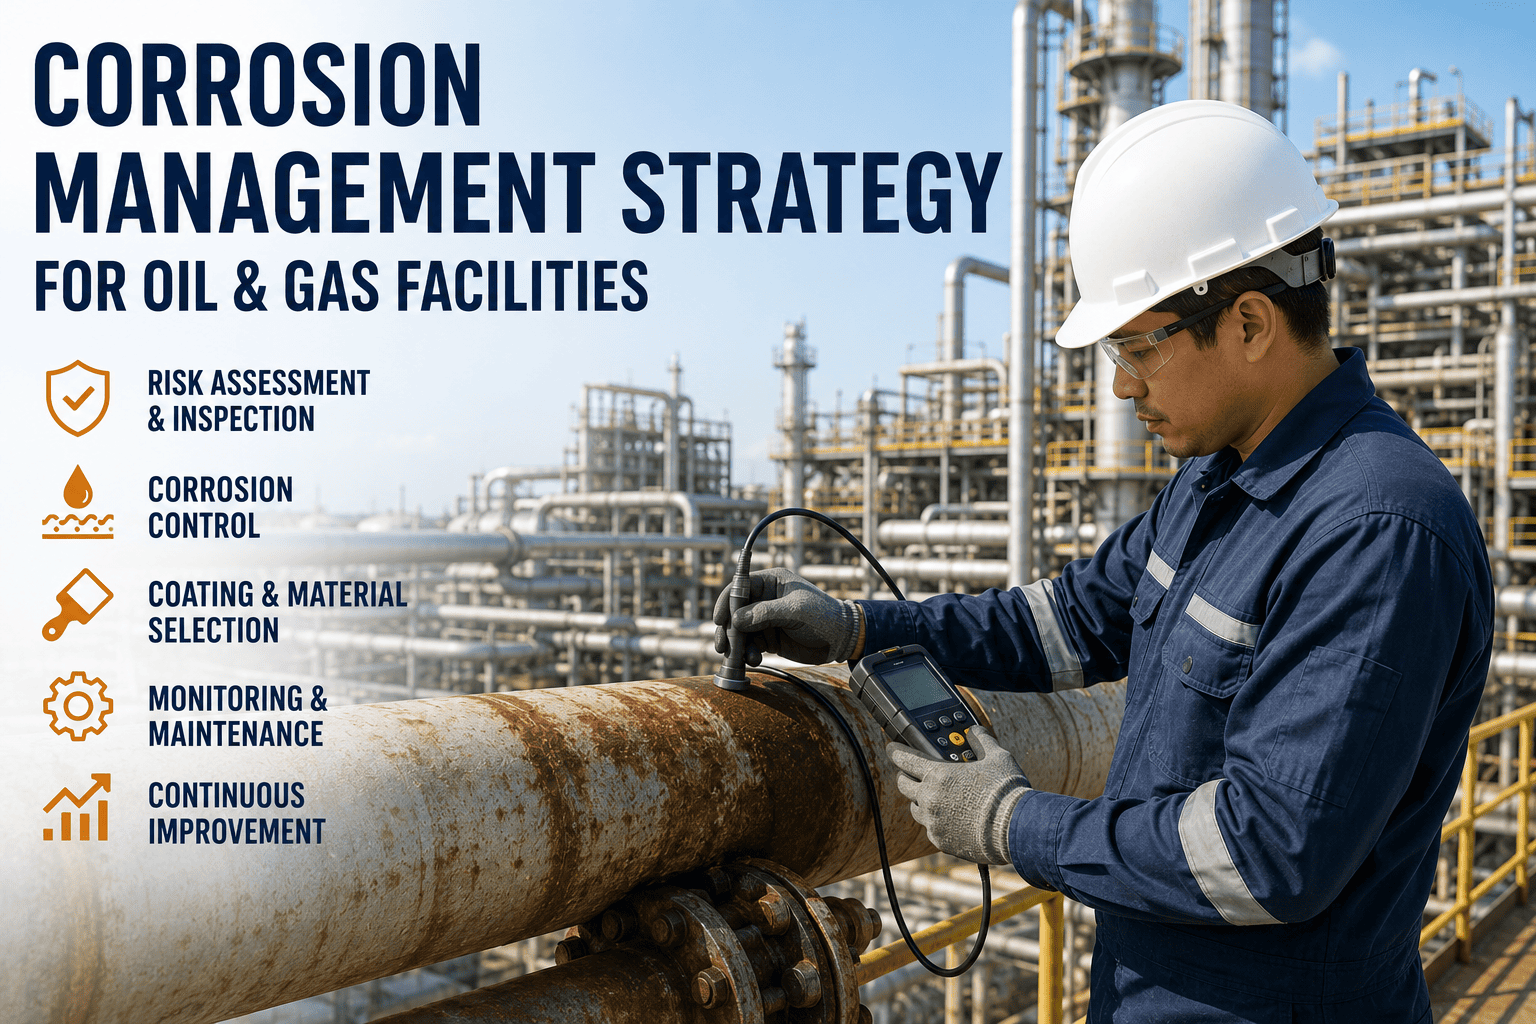
Corrosion Management Strategy
Every Facility Has a Corrosion Strategy. Most Just Don't Know What Theirs Is.
iFactory connects material selection, chemical treatment, cathodic protection, and monitoring data into a single corrosion management strategy — so degradation is caught by data, not by failure.
The Two Faces of Corrosion Risk
Internal Corrosion
CO2 / H2SDissolved gases reacting with produced water inside pipelines and vessels
Flow RegimeMultiphase flow patterns that concentrate corrosive fluids at low points
MicrobialMIC activity in stagnant or low-flow sections of the system
External Corrosion
Coating FailureHolidays and disbondment exposing bare metal to soil or atmosphere
CP ShieldingCathodic protection current blocked from reaching the pipe surface
CUICorrosion under insulation, hidden until the insulation is removed
Building a Strategy Instead of a Checklist
Regulatory-minimum corrosion programs treat cathodic protection surveys and internal monitoring as a compliance cost. A true corrosion management strategy treats the same data as an economic decision — connecting material selection, chemical treatment dosing, and monitoring results so mitigation spend goes where degradation risk is actually highest.
1
Material & Design Selection
Corrosion allowance and material grade selected against expected service conditions, not a generic default spec.
2
Chemical Treatment Program
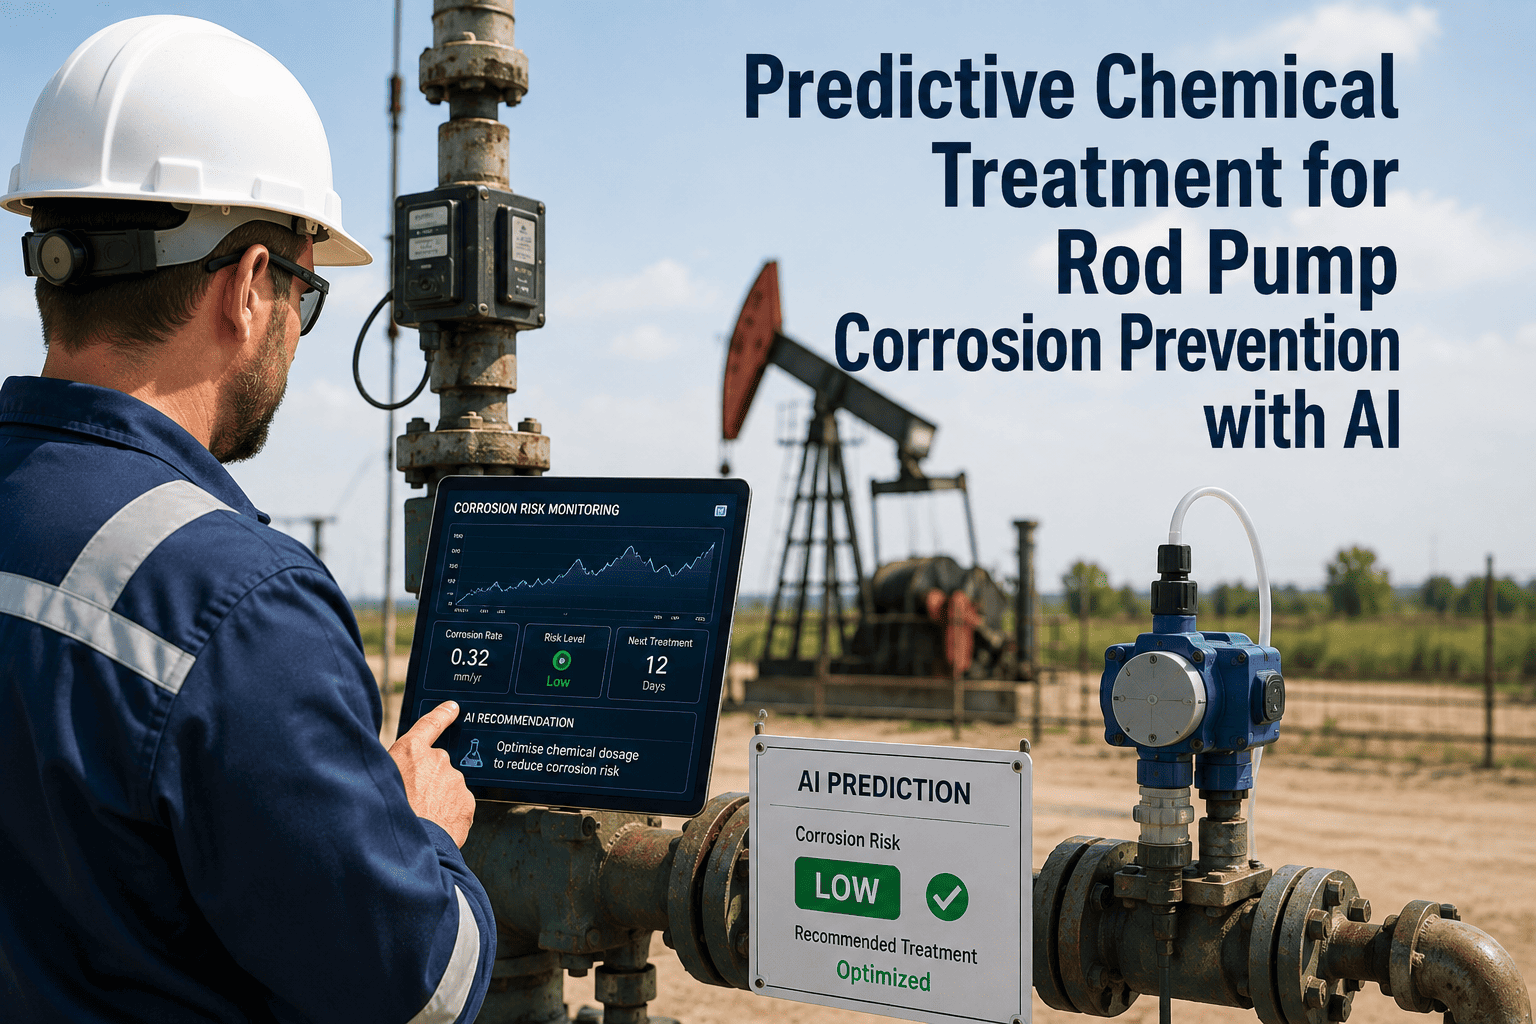
Inhibitor dosing calibrated to actual corrosive constituents rather than a fixed injection rate applied everywhere.
3
Cathodic Protection Design
CP systems designed and surveyed to maintain protective potential across the full buried or submerged asset.
4
Continuous Monitoring
ER probes, coupons, and CP surveys feeding one corrosion record instead of scattered field logs.
5
Inspection & Verification
Wall-thickness inspection results validate whether the mitigation strategy is actually working as designed.
Bring your last corrosion coupon and CP survey results. iFactory will show you where they should already be talking to each other.
Monitoring Techniques That Feed the Strategy
Electrical Resistance Probes
High-sensitivity metal-loss detection that works even in dry gas or low-conductivity fluid, independent of the medium's electrochemistry.
Corrosion Coupons
Direct, physical confirmation of corrosion rate over a known exposure period, still the industry reference method.
Cathodic Protection Surveys
Close-interval potential surveys confirming the buried asset is actually receiving protective current end to end.
Process Condition Monitoring
Pressure, temperature, and water-cut trends that signal a shift in corrosivity before a probe reading confirms it.
Disconnected Monitoring vs. an Integrated Corrosion Strategy
| Corrosion Activity | Disconnected Monitoring | iFactory Integrated Strategy |
| Coupon & probe data |
Logged separately, reviewed periodically |
Streamed into one corrosion record |
| Inhibitor dosing |
Fixed rate regardless of conditions |
Adjusted against real corrosivity trends |
| CP survey results |
Filed for compliance only |
Cross-checked against coating condition |
| Emerging risk detection |
Found at next scheduled inspection |
Flagged as trends shift in real time |
| Budget allocation |
Spread evenly across assets |
Directed to highest corrosion-risk assets |
Where Corrosion Risk Concentrates
Produced Water Systems
High chloride content and dissolved gases make water-handling piping among the fastest-corroding assets on a facility.
Buried Pipelines
External corrosion depends entirely on coating integrity and CP performance staying consistent over decades.
Insulated Piping & Vessels
Corrosion under insulation stays invisible until inspection removes the cladding, often after significant metal loss.
Storage Tank Floors
Water bottoms and microbial activity concentrate corrosion at the tank floor-to-shell interface.
Signs Your Corrosion Program Has a Gap
01
Coupon and probe readings live in different spreadsheets than CP survey results — nobody catches when the two datasets tell contradictory stories.
02
Inhibitor dosing hasn't changed in years despite process conditions shifting — a strategy set once at commissioning and never revisited.
03
Wall-thickness inspection consistently finds loss the monitoring program didn't predict — a sign the model and the field data have drifted apart.
04
CUI findings cluster at the same insulation types every turnaround — a pattern that should be feeding back into design standards, not just repair budgets.
What Changes When Corrosion Data Is Connected
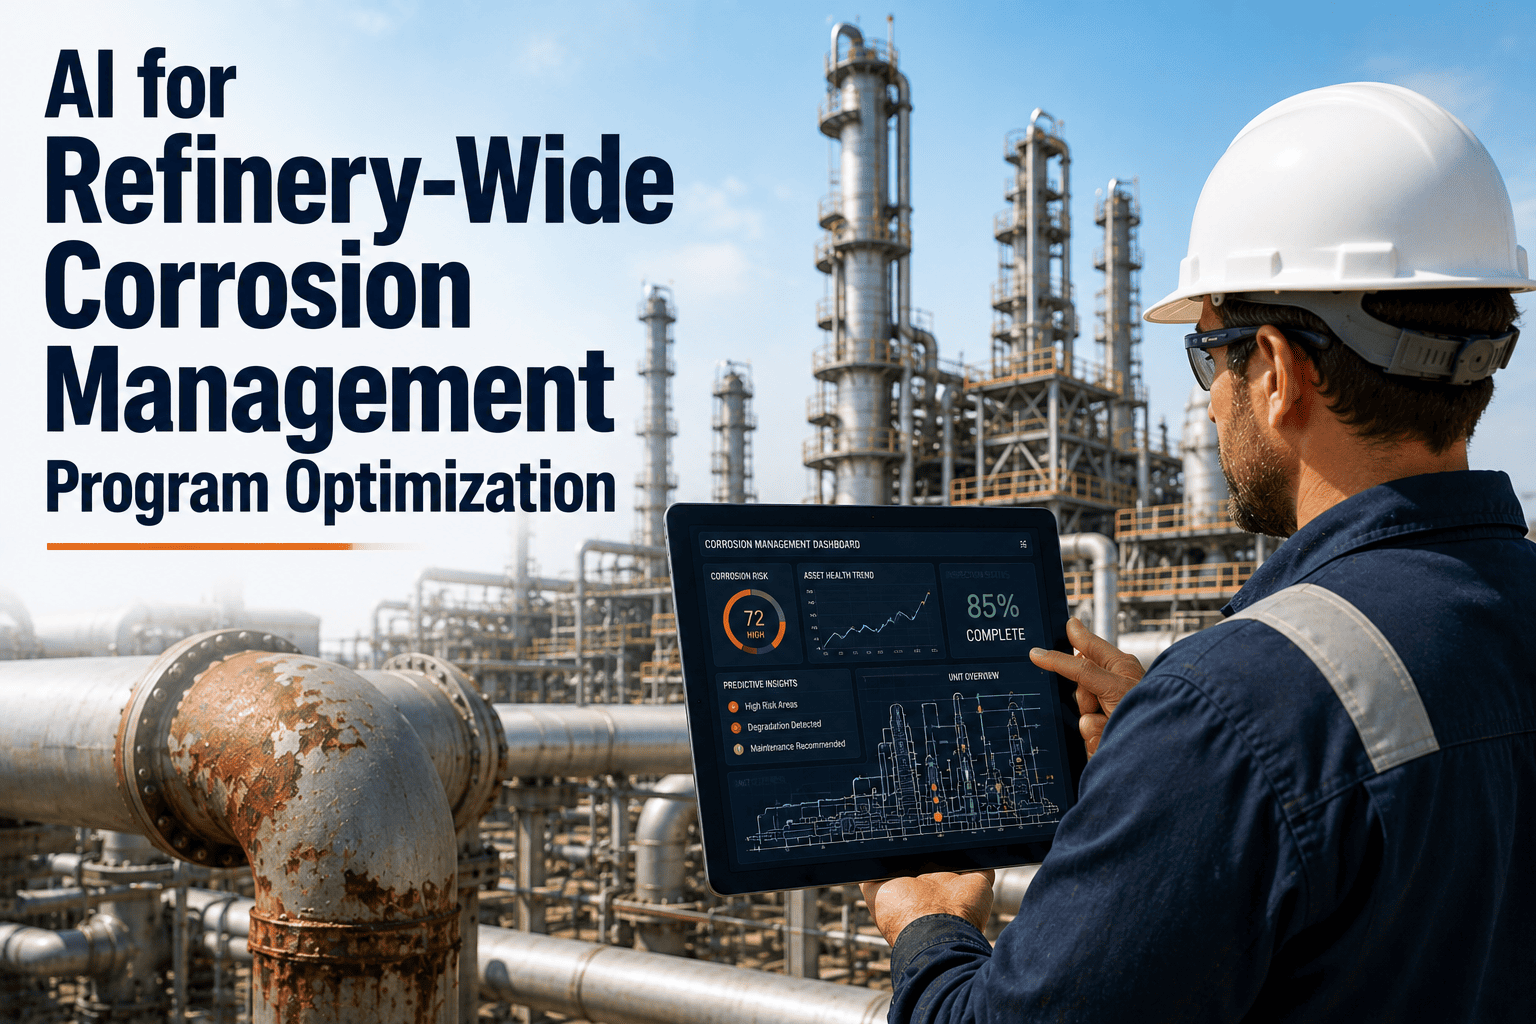
The economic case for an integrated strategy is straightforward once the data is actually connected: a facility that can see coupon trends, CP potentials, and inspection results side by side stops treating each as an isolated compliance task and starts treating corrosion as a single risk curve per asset. That shift changes where the next dollar of mitigation spend goes — toward the produced-water line trending toward its corrosion allowance limit, not toward a line that's been stable for a decade simply because it's next on the inspection calendar. Facilities that make this shift typically see fewer surprise findings at turnaround, because the trend was visible months before the shutdown gave anyone a chance to look closely.
FAQ: Corrosion Management Strategy
What is the difference between corrosion monitoring and a corrosion management strategy?
Corrosion monitoring is the data collection layer — coupons, probes, and surveys that measure what's happening to the metal. A corrosion management strategy is the decision-making layer built on top of that data, connecting material selection, chemical treatment, and inspection planning so mitigation spend and inspection intervals respond to actual measured risk instead of a fixed calendar or budget split. Many facilities have strong monitoring programs but no strategy layer connecting the data to action, which is where preventable failures tend to originate.
How much of corrosion-related cost is actually preventable?
Industry research consistently estimates that a meaningful share of total corrosion cost — commonly cited around a quarter to nearly a third — is avoidable through better use of existing corrosion prevention and control practices, without requiring new technology. The gap is rarely a lack of monitoring data; it is monitoring data that never gets connected to a mitigation decision in time to prevent the damage from accumulating.
Ask our team how integrated monitoring closes that gap.
Why does internal corrosion monitoring still matter if pipelines are already pigged regularly?
Pigging removes settled liquids and debris but does not address the underlying corrosivity of the fluid itself — dissolved CO2, H2S, oxygen ingress, and microbial activity keep working on the pipe wall between pigging runs regardless of how clean the line is. Facilities that assume pigging alone controls internal corrosion are one of the most common sources of unexpected wall-thickness loss found during inspection. Continuous probe and coupon monitoring is what actually confirms whether the corrosion rate is under control.
How does cathodic protection shielding go undetected for years?
Shielding occurs when a disbonded coating, rock shield, or casing blocks CP current from physically reaching the pipe surface, even though the CP system itself reads as fully operational at the test station. Because the rectifier output and pipe-to-soil potentials at accessible test points can look normal, shielding often isn't caught until a close-interval survey or an inline inspection tool identifies active corrosion under the shielded section. This is why CP survey data needs to be cross-referenced against coating condition data rather than reviewed in isolation.
How long does it take to build an integrated corrosion strategy on an existing facility?
For a facility with existing coupon, probe, and CP survey history, a working integrated strategy connecting that data into one record and setting risk-based monitoring priorities typically takes three to five weeks to stand up. The first phase focuses on consolidating historical data and identifying the highest-risk segments; automated trend alerting follows once baseline corrosion rates are established.
Book a demo to scope your facility.
Corrosion Strategy + iFactory
Stop Treating Corrosion Data as a Filing Requirement.
iFactory connects your monitoring, treatment, and inspection data into one corrosion management strategy — so mitigation spend goes where the risk actually is.