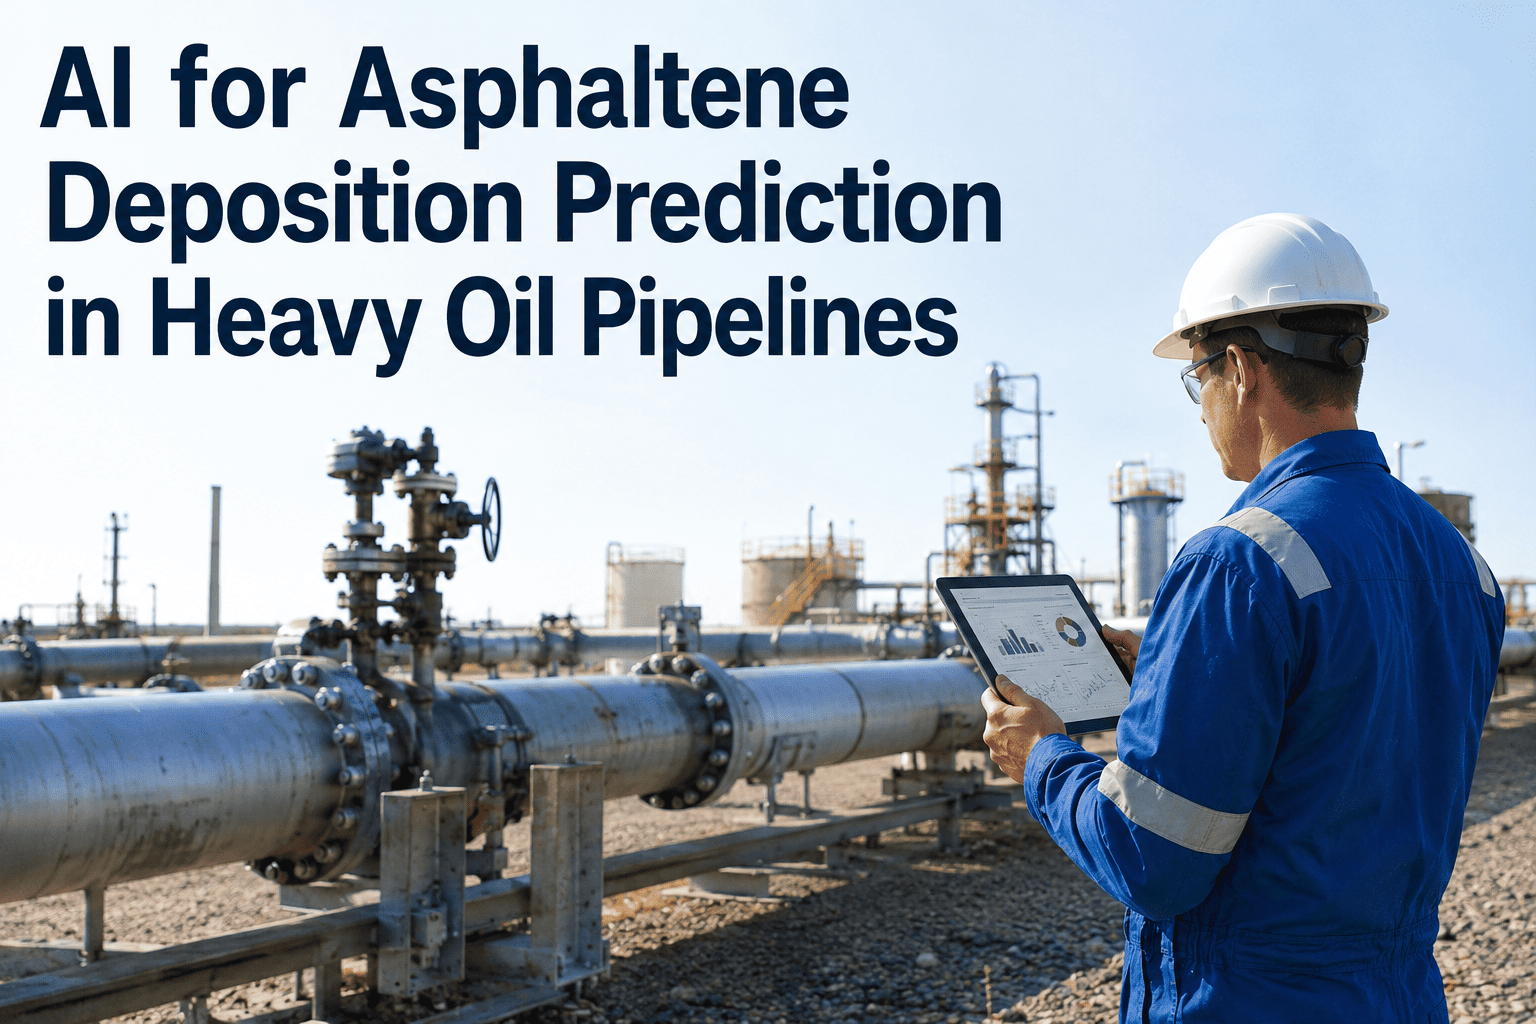
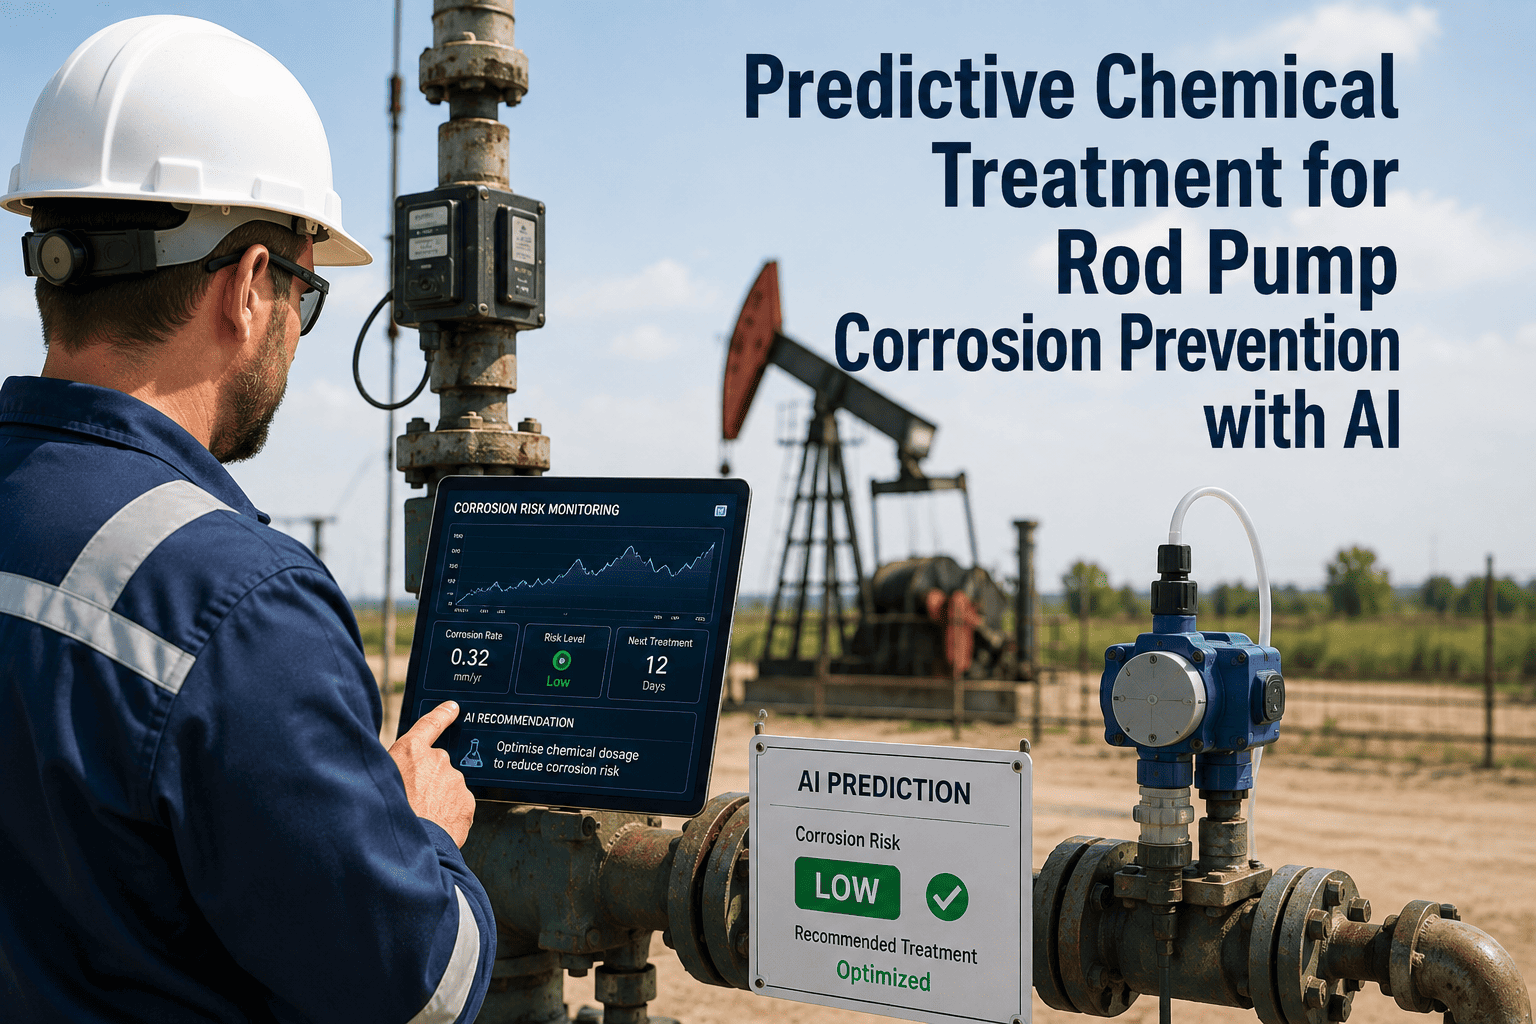
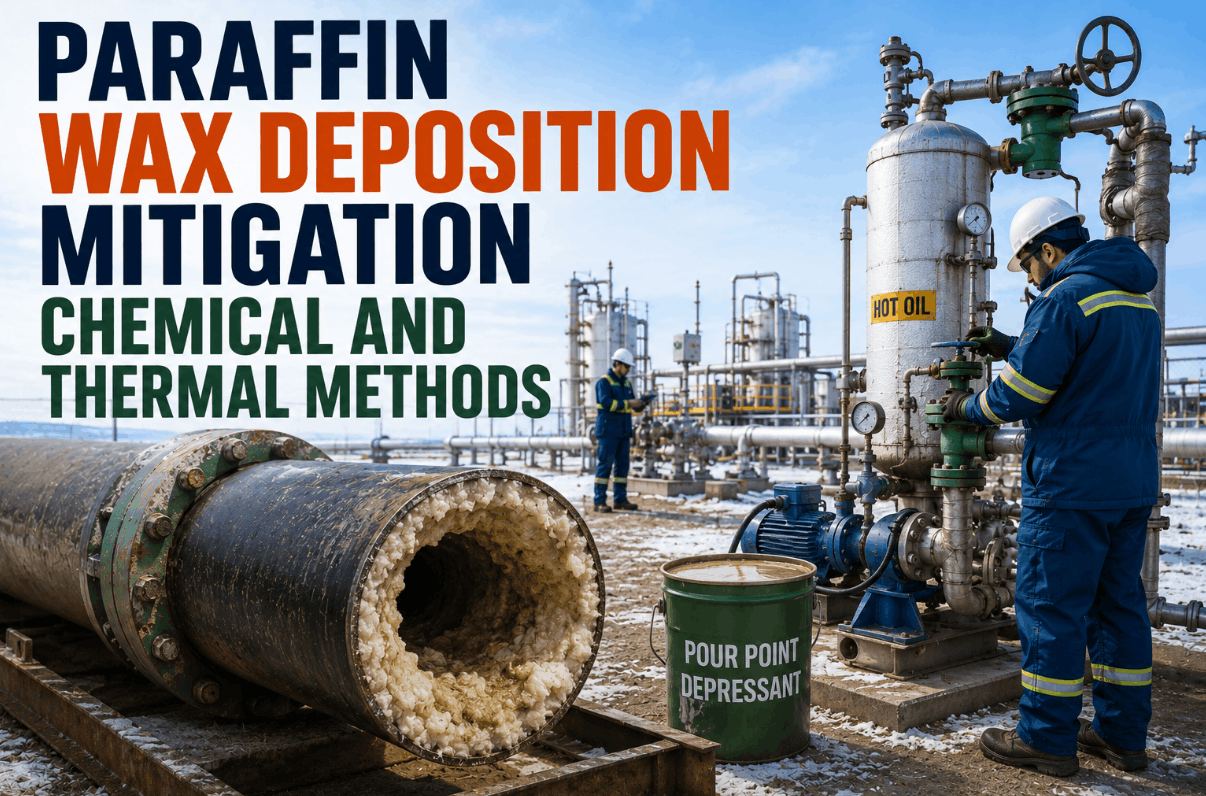
Wax deposition is the flow-assurance problem that never announces itself in time. A crude pipeline can run for weeks with pressure trending upward by a fraction of a percent every shift, and by the time the operator escalates the trend, the wax layer inside the line is already thick enough to double the required pump horsepower — or worse, thick enough that the next pig run will get stuck. Every waxy-crude operator on earth is running the same calendar-based mitigation programme their predecessor set up decades ago: fixed pigging frequency, fixed inhibitor dosing rate, and a hope that the crude composition and flow conditions have not drifted enough to matter this month. AI-based wax deposition prediction ends that guesswork. Models trained on crude composition, temperature profile, flow rate, pressure trend, water cut, and gas-oil ratio predict deposition rate in real time, recommend the right pigging window, and tune inhibitor injection to actual deposition risk instead of a fixed dose. Flow assurance leads ready to see wax prediction running against their own crude and line data can book a demo with the iFactory team.
WAX DEPOSITION · FLOW ASSURANCE · CHEMICAL OPTIMISATION · 2026
Predict Wax. Optimise Chemistry. Prevent Blockages.
AI models trained on crude composition, thermal profile, and flow conditions predict wax deposition rate, tune inhibitor dose to actual risk, and schedule pigging when it is actually needed — not when the calendar says.
5
Primary crude-and-flow factors that dominate wax deposition rate: flow rate, water content, inlet temperature, gas-oil ratio, outlet pressure
1.5 m/s
Flow velocity above which shear stripping meaningfully reduces wax deposition rate inside crude pipelines
Days
Advance warning AI deposition models provide before a wax event becomes visible on the pressure trend chart
Millions
Annual cost per operator of paraffin control across a mature waxy-crude portfolio in typical producing regions
Why Calendar-Based Wax Programmes Fail
The classic wax mitigation programme was built for a world where crude composition, flow rate, and thermal profile were roughly constant over months. It assumed that a fixed pigging frequency and a fixed inhibitor injection rate would cover the operating envelope with margin. That world does not exist anymore. Reservoirs mature and change composition. Water cut climbs shift by shift. Ambient temperatures swing seasonally on shallow-buried onshore lines and daily on above-ground facilities. Blended crudes from multiple wells produce mixed pour points and mixed deposition rates on the same line. The calendar programme reacts to none of this — it over-pigs the healthy lines and under-treats the ones that are actually depositing.
The industry has known this for years. What changed in 2026 is that machine learning models trained on physical deposition data now reliably outperform the empirical rules of thumb operators have been using. Recent published work on Elman neural networks, gradient boosting classifiers, and support vector approaches has demonstrated deposition-rate predictions accurate enough to drive real chemical and pigging decisions, and the underlying data — crude composition, thermal profile, water cut, flow rate, pressure trend — is already flowing through every operator's SCADA and lab systems. The gap is not the science. The gap is a production-ready system that ingests the data, runs the prediction, and closes the loop to the injection skid and pigging schedule.
The Five Factors That Actually Drive Wax Deposition
Peer-reviewed work on wax deposition in oil-gas-water triple-phase pipelines consistently identifies the same five factors as dominant. Any wax prediction model that ignores one of these is guessing on the others. The bars below show the approximate relative influence each factor has on deposition rate in a typical waxy crude system.
What matters for a production deployment is not just knowing that these five factors dominate but understanding how they interact. Temperature drives whether wax precipitates at all, but flow velocity governs how much of the precipitated wax stays on the wall versus getting stripped back into the bulk fluid. Water cut modifies the effective heat capacity of the mixture and shifts the cooling profile along the line. Gas-oil ratio changes the composition of the liquid phase itself. Outlet pressure sets the local thermodynamic state and interacts with GOR through gas evolution. A model that treats these factors independently produces plausible-looking predictions that fail as soon as one input drifts outside its historical range; a model that captures the interactions produces predictions that hold up under changing operating conditions.
Inlet Temperature
Primary driver
Temperature relative to Wax Appearance Temperature (WAT) governs whether wax precipitates at all. As the fluid cools along the line, precipitation accelerates near the wall — the largest single lever in the physics.
Flow Rate & Velocity
Shear stripping
Higher velocity increases shear stripping at the wall and reduces net deposition. Field data shows velocities above 1.5 m/s meaningfully suppress wax buildup; the transition regime between laminar and turbulent flow is actually worst.
Water Cut
Multiphase effect
Water fraction changes the emulsion structure, thermal capacity, and effective viscosity of the mixture. Increases in water cut over field life shift the deposition profile even when the crude itself is unchanged.
Gas-Oil Ratio (GOR)
Solubility shift
Gas evolution along the line changes the solubility envelope for waxy components, altering the temperature at which wax first appears and where along the pipeline it starts to matter.
Outlet Pressure
Pressure regime
Pressure sets the local thermodynamic state that governs wax precipitation onset and shifts along the line profile. Interacts strongly with GOR through gas evolution.
Wax Buildup Progression: What the Model Watches
Wax deposition inside a crude pipeline moves through recognisable stages, and the AI model tracks progress through each one in real time. Understanding the stages matters because the operator response is different at each one. Early stages can be managed with chemistry. Middle stages need scheduled pigging. Late stages require emergency intervention that no operator wants to run. The four-stage progression below is how iFactory represents wax buildup in the operator dashboard, with each stage tied to a specific set of automated recommendations.
Stage 1
Nucleation
Fluid temperature falls below WAT at the pipe wall. First wax crystals form but flow suffers no measurable impact. Continuous inhibitor injection is highly effective at this stage.
Stage 2
Layer Formation
Wax layer thickens on the wall, effective diameter starts to shrink. Small but detectable pressure trend upward. AI model classifies the trend and adjusts inhibitor dose upward before it accelerates.
Stage 3
Growth & Ageing
Layer thickens further and hardens as the wax deposit ages. Pump horsepower required to maintain throughput rises. Model recommends a targeted pig run inside a specific operating window.
Stage 4
Restriction Risk
Effective diameter significantly reduced. Aged wax deposit resists conventional pigging. Emergency intervention window closing — progressive pigging or hot oil circulation required before full blockage.
WAX DEPOSITION · FLOW ASSURANCE · 2026
Run This Against Your Own Crude and Line Data
Bring your crude composition, temperature profile, and line data to a live session — walk through wax deposition prediction, inhibitor dose optimisation, and a data-driven pigging window recommended for your specific pipeline against your real historical operating envelope. See the expected chemical spend reduction and pigging frequency change per line.
From Sensor Data to Chemical Decision: The Model Pipeline
A production-grade wax prediction system is not one model but a pipeline of inputs, feature engineering, prediction, and closed-loop action. The five-block flow below shows what actually happens between the field sensor reading and the chemical injection skid setpoint change, and each block has clear ownership: OT teams own the inputs, data science owns the feature engineering and prediction model, flow assurance owns the decision layer, and operations owns the closed-loop actuation on the injection skid and pigging planner.
01
Inputs
Crude composition from lab, WAT and pour point from SARA analysis, real-time inlet and outlet temperature, flow rate, pressure trend, water cut, GOR, ambient conditions, historic pigging events.
→
02
Feature Engineering
Derived features: temperature-vs-WAT margin along the line, effective diameter estimate from pressure trend, cumulative deposition since last pig run, seasonal and diurnal thermal cycles.
→
03
Prediction Model
Gradient boosting, Elman neural network, or hybrid physics-plus-ML model produces deposition rate per line segment, days-to-pig-window, and inhibitor demand curve for the next operating window.
→
04
Decision Layer
Model output translated into operator-facing recommendations: inhibitor dose change, pigging window, or emergency escalation with confidence score and supporting evidence from feature contributions.
→
05
Closed Loop
Approved recommendations flow to the chemical injection skid setpoint, the pigging planner, and the operator HMI. Every action logged for continuous model retraining and audit.
Pigging or Inhibitor? The Decision Framework
Every wax mitigation decision ultimately comes down to a choice between mechanical removal, chemical prevention, or thermal management — or a combination of all three. The framework below is how the iFactory decision layer weighs the trade-offs against the specific line conditions.
The right answer is rarely the same across a portfolio. A deepwater subsea tie-back with a WAT-marginal thermal profile is a Branch A candidate; the same operator's onshore mature waxy field is almost certainly Branch B or Branch C. This is where AI-driven decision layers pay for themselves against a fixed corporate paraffin policy: the model applies the framework line by line, with the specific composition, thermal profile, and flow conditions of each asset, rather than defaulting the whole portfolio to a single strategy that fits none of them well. Flow assurance leads reviewing their portfolio for the first time usually find that between a quarter and a third of the lines were on the wrong branch — often over-treating with expensive continuous inhibitor when scheduled pigging would have delivered the same result at a fraction of the chemical spend.
BRANCH A
Continuous Inhibitor Dosing
When: predicted deposition rate is low-to-moderate, WAT margin is comfortable, and the line is expensive to pig (deepwater, ESP-lifted, long tie-back).
Model tunes dose rate against predicted deposition, avoiding both under-treatment and expensive over-dosing.
BRANCH B
Scheduled Pigging Window
When: predicted deposition builds steadily but stays inside safe operating envelope. Onshore or shallow-buried lines with easy pig launcher access.
Model recommends a specific pig run inside a specific 24-72 hour window, rather than a fixed calendar frequency.
BRANCH C
Blended Chemistry + Pigging
When: high-water-cut mature line with mixed crude blend and variable ambient temperature. No single approach covers the operating envelope.
Model splits the strategy: baseline inhibitor to suppress nucleation, then scheduled pigging aligned to deposition curves.
BRANCH D
Thermal Intervention
When: deposition prediction crosses restriction-risk threshold or a pig run has already been missed. Emergency window.
Model recommends hot oil circulation or progressive pigging campaign, and escalates to the operations superintendent with full deposition history.
Where This Pays Back Across the Value Chain
Wax deposition prediction pays back fastest where paraffin control is a large operating expense line item, where line access is difficult, or where a single blockage event has catastrophic downstream consequences. The five deployment contexts below are where iFactory has seen the strongest business case, but the principle scales across almost any waxy-crude producing environment where instrumentation and historian data already exist to feed the prediction layer.
DEEPWATER
Subsea Tie-Back Flowlines
Long subsea tie-backs cool crude rapidly below WAT; mechanical intervention is prohibitively expensive. AI-driven inhibitor dose optimisation is the primary mitigation lever, and small reductions in dose rate compound into significant chemical cost savings over the field life.
ONSHORE FIELD
Waxy-Crude Gathering Systems
Mature onshore fields with high-wax crude spend millions annually on pigging and chemistry. Predictive scheduling eliminates over-pigging on healthy lines and catches the wells that actually need attention before pressure trending flags them.
MIDSTREAM
Blended-Crude Trunk Lines
Trunk lines receiving crude from multiple upstream sources see a moving compositional target that fixed inhibitor programmes cannot track. AI models correlate composition, temperature, and pressure trend to keep the trunk in safe operating envelope.
ESP-LIFTED
Downhole and Wellhead Zones
Electric submersible pump systems are highly sensitive to wax build-up on the discharge tubing. Predictive dose tuning protects ESP run life by keeping the tubing profile inside the safe restriction envelope shift by shift.
EXPORT
Terminal and Export Pipelines
Long export lines running through varying ambient temperatures and grades face seasonal and diurnal deposition swings. AI-driven prediction lets terminal operators tune throughput, temperature, and chemistry to keep the line reliably inside spec.
What Flow Assurance Leads Are Reporting
The perspective below comes from a flow assurance manager running paraffin control on a portfolio of mature onshore waxy-crude wells. It captures the operational change that happens once real-time deposition prediction sits between the SCADA feed and the pigging planner, and it is representative of what iFactory sees across mature waxy-crude portfolios in the first two quarters after go-live.
Our wax programme used to run on a fixed pigging calendar regardless of what the crude was actually doing that week. Once we had continuous pressure and temperature trending on the flowline feeding the prediction model, we could see deposition building days before a pig run was even scheduled. We stopped over-pigging healthy lines, we started focusing chemistry on the wells that were genuinely depositing, and our paraffin spend per barrel dropped meaningfully inside the first two quarters — with no compromise on uptime.
Flow Assurance Manager · Mature Onshore Waxy-Crude Portfolio · Multi-Well Deployment · Anonymised for confidentiality
Frequently Asked Questions
The questions below are the ones flow assurance engineers, production superintendents, and chemical treatment managers ask most often when scoping an AI-based wax deposition prediction and optimisation programme. Each answer is written to give practitioners enough detail to make a real decision rather than a marketing summary. If your specific crude composition, line geometry, or operating envelope raises a question that is not covered here, the fastest way to a precise answer is a working session with the iFactory flow assurance team against your own data.
A meaningful starting point is a SARA analysis or equivalent crude composition report, WAT and pour point values, a rough thermal profile of the line, and roughly three to six months of historian data for flow rate, inlet and outlet temperature, and pressure trend. That baseline is enough for the model to produce useful deposition-rate predictions and initial inhibitor and pigging recommendations, with confidence intervals that shrink as more data accumulates. Operators with mature historian archives can bootstrap in weeks; operators starting fresh instrumentation take a few months to build the first calibrated model. Teams can book a demo to see how much of the input set is already sitting in their existing SCADA and lab systems.
No — it complements them. Physics-based simulators are the right tool for offline design work and detailed transient studies. What they do not do well is run continuously against live sensor data across a large portfolio of lines and produce operational recommendations shift by shift. The AI prediction layer fills that operational gap: it uses the same physical understanding of wax deposition that the simulators are built on, but operates against real-time data and delivers actionable recommendations to the injection skid and the pigging planner. Operators who have already invested in a simulator get the most value by using its outputs as training features for the AI layer, effectively multiplying the return on the existing simulation investment.
This is one of the strongest reasons to use a learning model rather than a fixed rule of thumb. Every new lab result — SARA fractions, WAT, pour point, wax content — feeds into the model as a fresh training signal for that specific well or trunk line. As the field matures and composition drifts, the model re-weights the influence of each input factor automatically. This is exactly the failure mode that kills calendar-based programmes: the crude changes but the calendar does not. The AI model tracks the change explicitly, and the confidence intervals on its predictions widen when a new sample departs significantly from the historic envelope, prompting a review before automated recommendations continue to fire.
Both, depending on how the operations team wants to structure the loop. Most operators run the system in advisory mode for the first three to six months — the model produces recommended inhibitor dose changes, and the flow assurance engineer approves each one before the injection skid setpoint is adjusted. Once the recommendation quality has been validated across a full seasonal cycle, the operations team typically opens the loop for automatic dose adjustments inside a bounded operating envelope, with the engineer retaining approval authority for any change outside that envelope. Pigging recommendations always require human approval because pig runs involve logistics and downstream coordination that go beyond the model's operating context.
A pilot deployment on one representative line typically completes in six to ten weeks, covering historian integration, feature engineering, model training on the baseline data, and shadow-run validation against actual pigging outcomes. Portfolio scale-up after the pilot moves much faster because the platform, data ingestion, and decision layer are already built — new lines add mostly configuration effort per well. A portfolio of twenty to thirty wells typically completes within a single quarter after the pilot, and the ROI compounds as more lines come under predictive control. For a specific timeline estimate against your portfolio, reach the iFactory flow assurance team through support.
WAX DEPOSITION · FLOW ASSURANCE · 2026
Ready to Replace the Calendar with a Prediction?
See real-time wax deposition prediction, chemistry optimisation, and pigging window recommendation running against a crude portfolio like yours. Bring lab data, thermal profile, and historian access — the iFactory flow assurance team walks through the specific opportunities and expected paraffin spend reduction on the call, mapped to your portfolio.