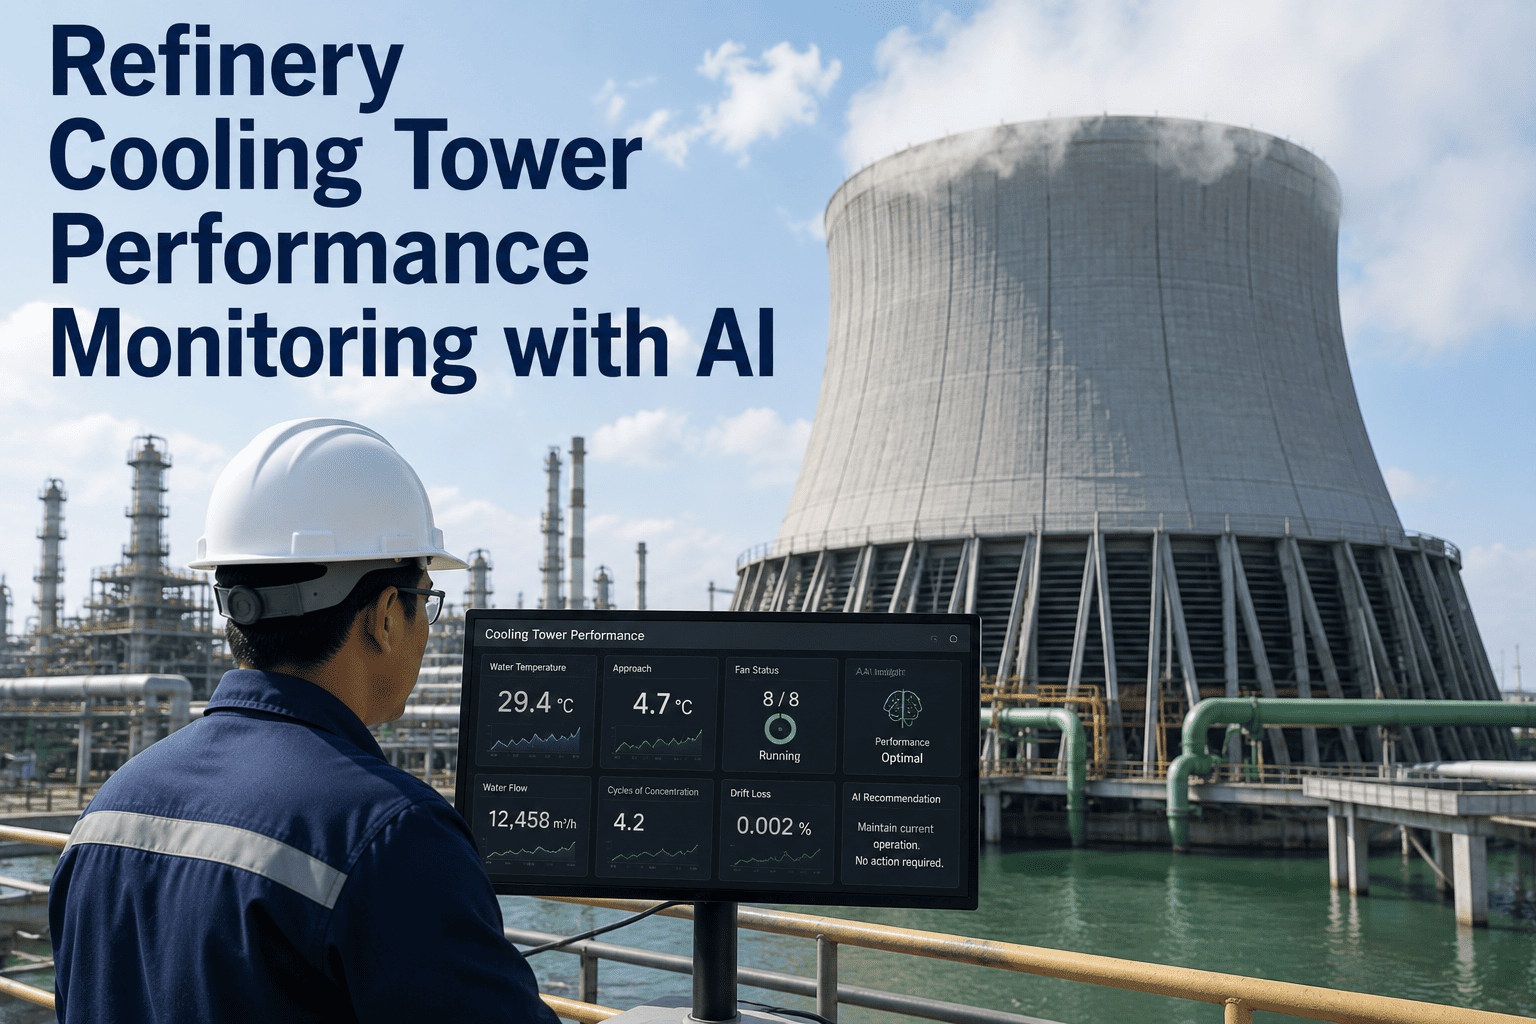
Cooling water systems quietly touch almost every major piece of rotating and heat-transfer equipment on a plant, which means a slow drift in water chemistry rarely announces itself until a heat exchanger is already fouled or a tower structure is already corroding. Most sites still manage cooling water with a handful of grab samples a week and a chemical feed rate nobody has revisited in months. iFactory turns that into continuous chemistry monitoring tied to real treatment outcomes, and you can book a demo to see it running against your own cooling loop.
Three Threats Working Against Every Cooling Water System at Once
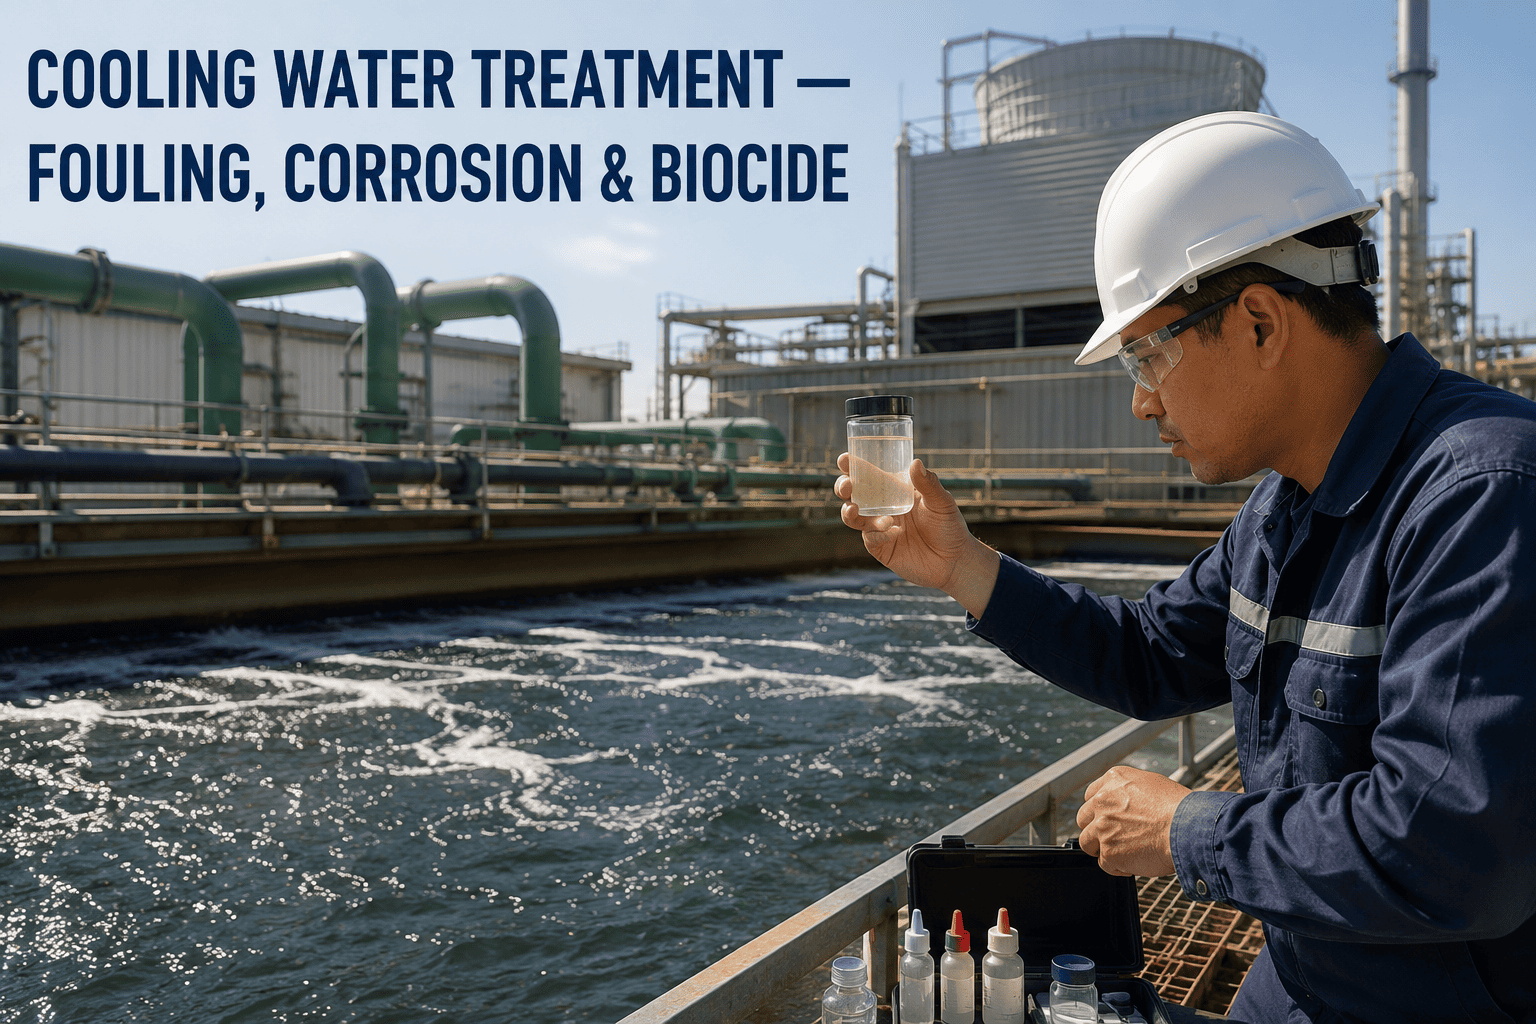
iFactory monitors scaling potential, corrosion rate, and microbiological growth continuously, adjusting treatment recommendations before any one threat gets ahead of the program.
A Few Samples a Week Cannot Catch a Chemistry Drift in Time
Cooling water chemistry does not stay still. Makeup water quality shifts with the season, process leaks introduce contamination without warning, and cycles of concentration drift as blowdown rates are adjusted for water conservation targets. A treatment program built around twice-weekly grab samples and manual titrations is working from data that is already stale by the time it reaches the water treatment vendor's report, and by then scale or corrosion may already be forming on surfaces nobody can inspect without a shutdown.
The Chemistry Signals a Treatment Program Should Never Lose Sight Of
| Parameter | What It Signals | Typical Monitoring Approach |
|---|---|---|
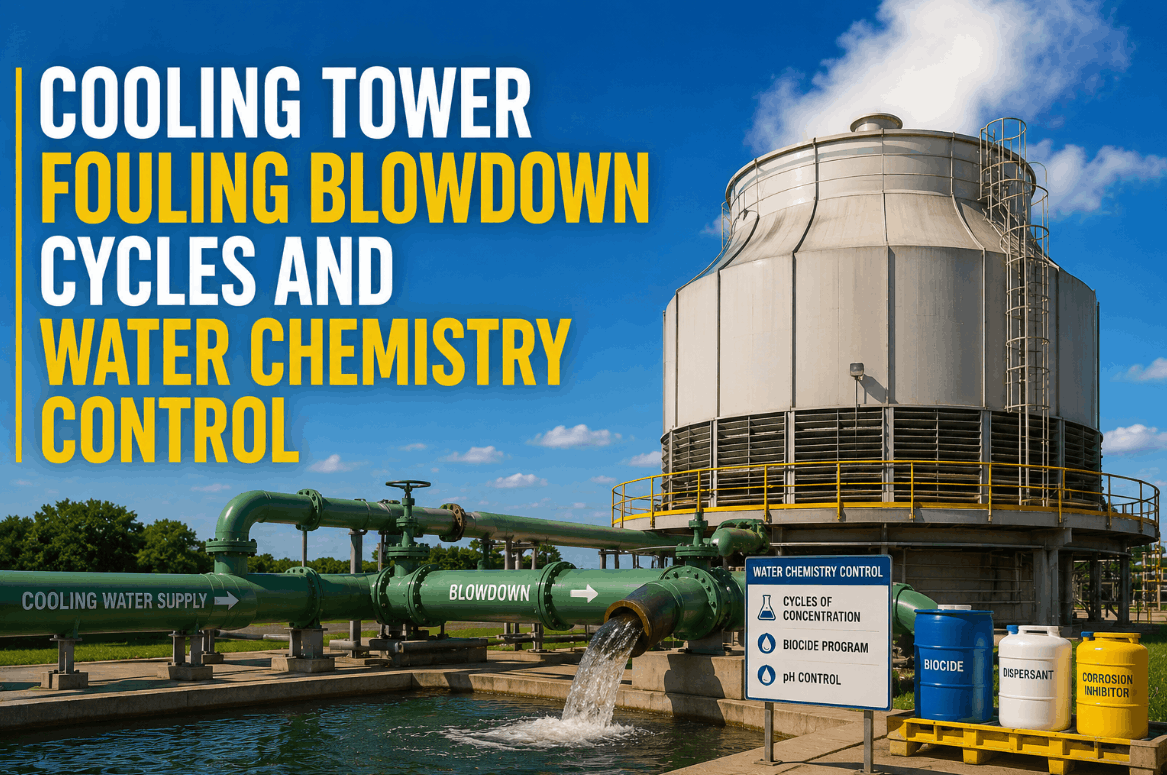
| Cycles of Concentration | Whether blowdown rate is keeping dissolved solids in a safe range | Conductivity ratio between makeup and recirculating water |
| Langelier Saturation Index | Scaling versus corrosive tendency of the current water chemistry | Calculated from pH, alkalinity, hardness, and temperature |
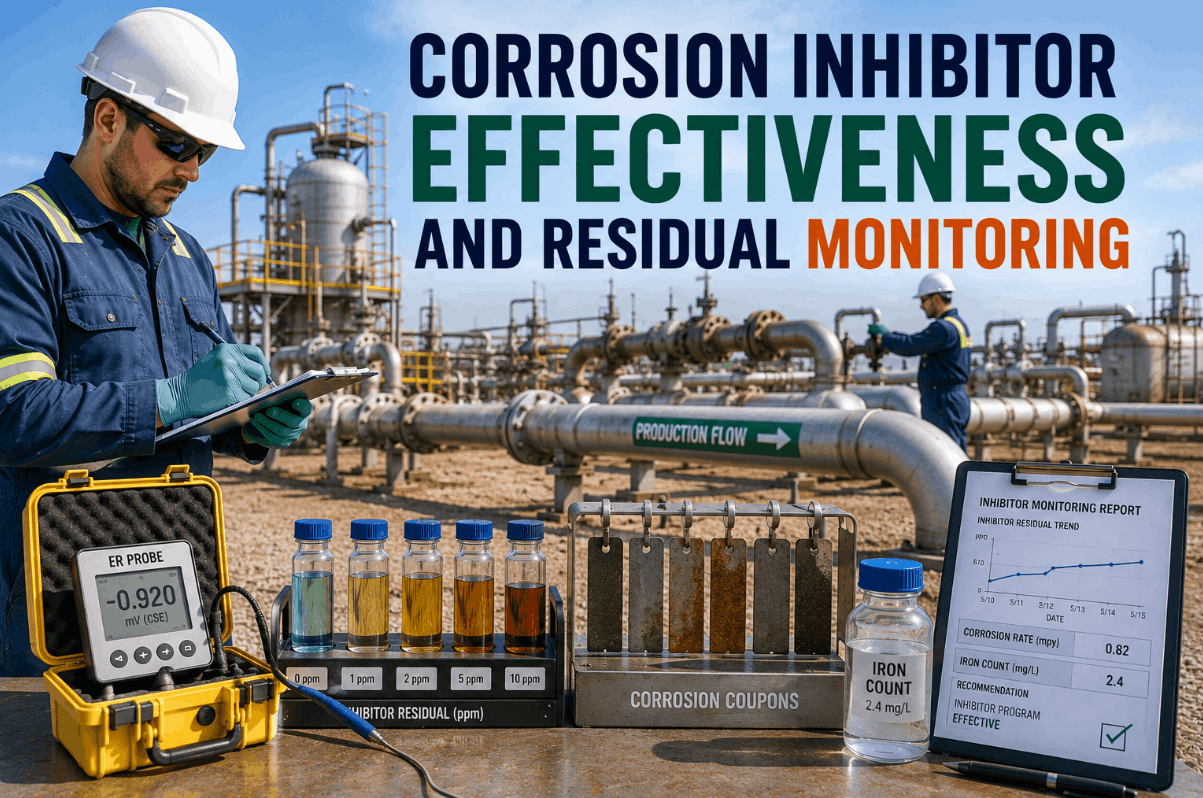
| Corrosion Coupon Rate | Actual metal loss rate experienced by system materials | Periodic coupon weighing, increasingly supplemented by online probes |
| Microbial Activity (ATP) | Biological growth potential ahead of visible biofilm formation | Rapid ATP testing or continuous biofouling monitors |
Turning Scattered Water Chemistry Data Into One Continuous Treatment Signal
Conductivity, pH, and ORP sensors feed data continuously so scaling and corrosion tendency indices are recalculated in near real time rather than twice a week.
Blowdown rate recommendations balance water conservation targets against the dissolved solids limit the current chemistry can safely tolerate.
Microbial activity trends inform biocide dosing timing and selection, reducing both under-treatment risk and unnecessary chemical overdosing.
Coupon and online probe data are tracked over time against treatment changes, showing which adjustments actually reduced metal loss.
Catch Chemistry Drift Before It Becomes a Fouled Exchanger
iFactory tracks cooling water chemistry continuously and flags drift toward scaling, corrosion, or biological risk in real time.
Moving From Grab Samples to Continuous Treatment Monitoring
Baseline Current Chemistry
Historical grab sample data and treatment records are reviewed to establish where the system currently sits against scaling and corrosion risk.
Connect Online Sensors
Conductivity, pH, ORP, and where available biofouling monitors are integrated to feed continuous chemistry data into the platform.
Set Treatment Thresholds
Alert thresholds for scaling index, corrosion rate, and microbial activity are configured against your specific materials and operating conditions.
Refine Dosing Over Time
Chemical feed and blowdown recommendations are refined continuously as the platform learns how your system actually responds to treatment changes.
Why the Same Treatment Program Behaves Differently Across the Year
A biocide dosing schedule and blowdown target set during a cool spring week rarely holds up once summer cooling load and ambient temperature both climb, since warmer recirculating water accelerates both scale formation and microbial growth at the same time evaporation losses increase makeup water demand. Programs that are not adjusted seasonally tend to run under-treated exactly when risk is highest and over-treated during milder months when the extra chemical cost was never needed.
Higher heat rejection duty and warmer supply water push both scaling tendency and microbial growth risk upward simultaneously, requiring tighter monitoring intervals.
Reduced flow and longer residence time in some loop sections can create stagnation zones where biofilm risk rises even though overall cooling demand is lower.
Seasonal changes in river, well, or municipal makeup water hardness and alkalinity shift the baseline chemistry the treatment program has to work against.
Heavy rainfall reaching open cooling towers can introduce organic load and sediment that spike microbial activity readings within hours.
Where Cooling Water Treatment Programs Quietly Lose Effectiveness
Adjusting pH alone without accounting for alkalinity and hardness together can push the Langelier index in the wrong direction unintentionally.
A biocide dosing calendar set once and left unchanged misses the seasonal windows when microbial risk actually peaks.
Quarterly coupon pulls average out short-term corrosion events, hiding exactly the excursions a treatment program most needs to catch.
Questions Operations Teams Ask About Automated Water Treatment Monitoring
Stop Managing Cooling Water Chemistry With a Twice-Weekly Snapshot
iFactory keeps scaling, corrosion, and microbiological risk visible continuously across your cooling loop.