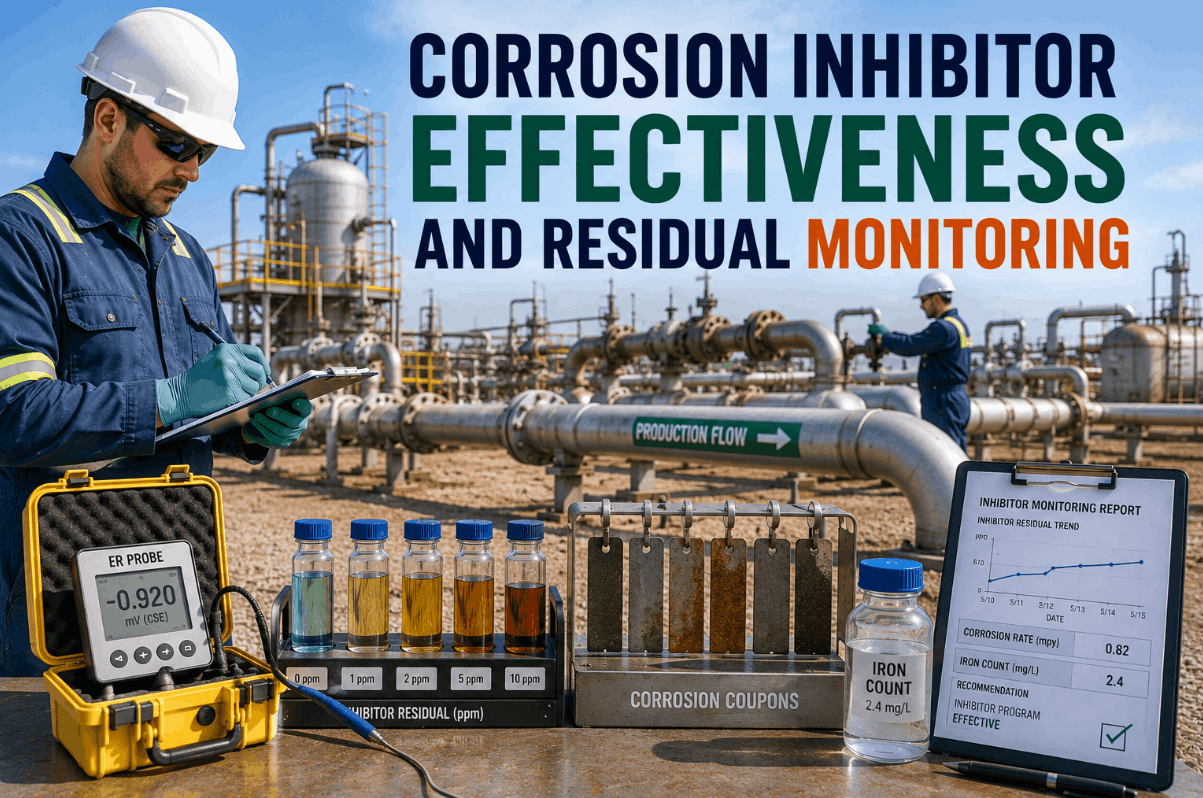
Injecting a corrosion inhibitor and assuming it is working is one of the most expensive habits in oilfield production chemistry. Inhibitor film performance depends on dose rate, water cut, flow regime, and CO2 or H2S partial pressure — all of which shift continuously, while injection rates are often set once and rarely revisited. Without a monitoring program built on residual concentration testing, corrosion coupons, ER probes, and iron count trending, an operator has no way to confirm the inhibitor film is actually intact until a leak or a failed inline inspection proves otherwise. Production and integrity teams reviewing their current monitoring cadence can Book a Demo with iFactory to see how trend data supports an existing inhibitor program.
Why "We Inject Inhibitor" Is Not the Same as "We Control Corrosion"
Corrosion inhibitors work by forming a protective film on the pipe wall, and that film only holds if the inhibitor concentration stays above a minimum effective level under actual field conditions — not the conditions it was originally dosed for. Water cut rises, flow velocity changes, a slug of CO2-rich gas breaks through, and the film that was adequate six months ago is no longer enough. The only way to know whether protection is holding is to monitor it directly, through a combination of methods that each tell a different part of the story. No single data point proves an inhibitor program is working; convergence across several independent measurements does.
The Monitoring Toolkit: What Each Method Actually Tells You
Effective corrosion monitoring layers complementary techniques rather than relying on one. Each method below answers a slightly different question, and integrity teams typically run two or more together to build a defensible picture of inhibitor performance.
Corrosion Coupons — Mass Loss Over Time
A weighed metal coupon is exposed to the process stream for a fixed interval, then removed, cleaned, and reweighed. The mass loss converts directly to an average corrosion rate over that period. Coupons are inexpensive and simple, but they report a historical average and can miss short-lived upset conditions or localized pitting between pulls.
Electrical Resistance (ER) Probes — Continuous Metal Loss
ER probes measure the change in electrical resistance of a metal element as it thins from corrosion, providing a continuous, near-real-time corrosion rate rather than a single averaged value. This makes ER data well suited to confirming whether an inhibitor dose change actually produced a sustained drop in corrosion rate, rather than waiting for the next coupon pull to find out.
Residual Inhibitor Concentration — Is the Film Actually There
Residual testing measures how much inhibitor remains in the produced water or condensate after injection, typically by titration or extraction methods. A residual that consistently sits below the minimum effective concentration signals the film is likely thin or absent, even if no corrosion event has shown up yet. Industry guidance treats residual concentration as a leading indicator to corroborate, not a standalone proof of protection.
Iron Counts — Reading the System's Own Evidence
Iron count monitoring measures dissolved or total iron in produced water as a direct byproduct of active corrosion. Tracked consistently at the same sample point and normalized for water production rate, rising iron counts are one of the clearest signs that inhibitor performance has degraded somewhere upstream of the sample location.
Building a Convergent Monitoring Program
No single method above is sufficient on its own — coupons can miss localized attack, residual tests can be skewed by partitioning between oil and water phases, and iron counts can be muddied by produced solids. A defensible inhibitor program correlates results across methods and re-evaluates dosing when the data, taken together, points the same direction. Teams designing this kind of layered program can Book a Demo to see how iFactory brings these data streams into one view.
Comparing Monitoring Methods at a Glance
The table below summarizes how the core monitoring methods complement each other across response time, what they actually measure, and where each one falls short on its own.
| Method | What It Measures | Response Time | Key Limitation |
|---|---|---|---|
| Corrosion Coupons | Average mass loss over exposure period | Weeks to months per pull | Misses short upsets between pulls |
| ER Probes | Continuous metal thinning rate | Near real-time | Reports general, not localized, corrosion |
| Residual Concentration | Inhibitor remaining in produced fluid | Per sample event | Partitioning between oil/water can skew results |
| Iron Counts | Dissolved/total iron in produced water | Per sample event | Affected by solids and sample handling |
The biggest mistake I see in corrosion management programs is treating inhibitor injection as a checkbox instead of a controlled process. A pump running at its setpoint tells you chemical was injected — it tells you nothing about whether the film actually held under that week's water cut and flow conditions. The operators who avoid surprise failures are the ones who look at coupon trends, ER data, residuals, and iron counts together and ask whether the story is consistent. When those signals start to diverge, that is exactly when a dosing review should happen — not after the next inline inspection comes back with metal loss nobody expected.
Conclusion: Monitoring Is What Turns Inhibitor Into Protection
A corrosion inhibitor program is only as strong as the data confirming it works. Coupons, ER probes, residual concentration testing, and iron counts each answer a different part of the question, and used together they turn inhibitor injection from an assumption into a verified control. iFactory supports that verification by trending these data streams continuously, helping integrity and production chemistry teams catch a drifting program before it shows up as a failed pipe segment.
Frequently Asked Questions
No. Residual concentration is a useful leading indicator, but industry guidance treats it as a guide to corroborate alongside coupon, ER, or iron count data — not a standalone proof of protection.
Coupons measure average mass loss over a fixed exposure period and require physical retrieval, while ER probes provide a continuous, near-real-time corrosion rate without removing the sensor.
Iron counts reflect actual corrosion byproducts from the whole system upstream of the sample point, providing an independent cross-check against localized ER probe readings.
Review frequency should scale with how often operating conditions change; rising water cut, CO2 content, or flow rate shifts are common triggers for an earlier-than-scheduled review.
No. iFactory aggregates and trends existing coupon, ER probe, residual, and iron count data so teams can see convergence across methods, rather than replacing the underlying lab and field testing.