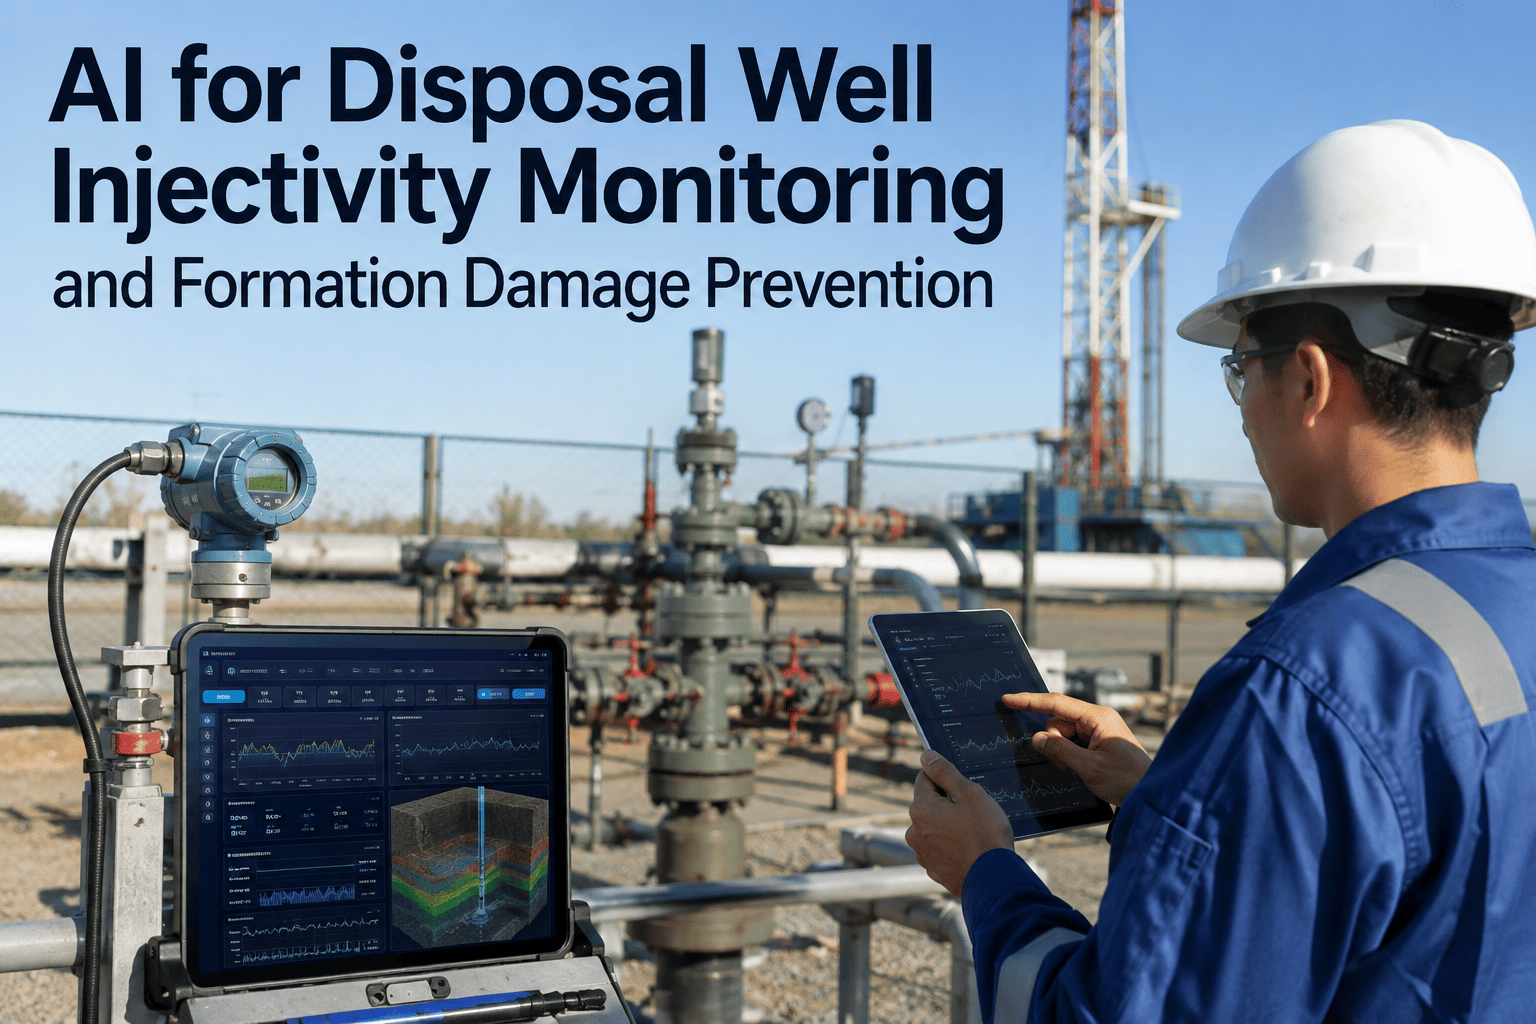
A Class II disposal well does not fail without warning, it drifts. Injection pressure creeps closer to the permitted maximum over weeks as near-wellbore permeability declines from suspended solids and scale, and by the time a monthly report shows the trend, an operator is often choosing between an emergency workover and a mechanical integrity test that was never going to pass. Regulators do not treat that gradual drift as a minor paperwork issue, a lost mechanical integrity test triggers an immediate shut-in, and continuing to inject a well that is out of permit compliance is a civil penalty exposure that can run past twenty-five thousand dollars per day per violation. iFactory's AI platform ingests your injection pressure, volume, and annulus data continuously, flags injectivity decline before it becomes a permit violation, and you can book a demo to see it running against your own well data.
Know a Well Is Drifting Out of Permit Weeks Before the Report Does
Class II disposal wells report injection pressure and volume monthly, but the underlying formation damage that eventually causes a permit exceedance or a failed mechanical integrity test builds continuously. iFactory monitors that data in real time, predicts injectivity decline before it forces a shut-in, and keeps your compliance record audit-ready.
A Missed Trend Becomes a Shut-In, Not a Warning Letter
Class II wells, covering enhanced oil recovery injection and saltwater disposal, exist under the Safe Drinking Water Act specifically to keep injected fluid confined to the authorized zone and away from underground sources of drinking water. That single purpose is why the enforcement posture around these wells is so immediate. When a mechanical integrity test fails, or when injection pressure exceeds the permitted maximum, the standard regulatory response is not a corrective action plan with months to comply, it is an operational shut-in, often required within 48 hours of discovery, sometimes immediately.
The financial exposure compounds from there. Beyond the civil penalty structure that can reach tens of thousands of dollars per day per violation, an unplanned shut-in halts disposal capacity for a producing field that depends on that well to handle produced water, which can force curtailed production upstream while the well is repaired, retested, and recertified. None of this happens because an operator ignored a warning, it happens because injectivity decline is a slow, continuous process that a monthly paper report is poorly suited to catch before it crosses a permit threshold.
The regulatory logic behind this severity is straightforward once you consider what a Class II well actually protects. A significant share of the population draws drinking water from underground aquifers, and the entire UIC framework exists to keep produced brine and other injected fluids from ever reaching those aquifers. That is why operator responsibilities following a mechanical integrity failure are spelled out with specific, short timeframes rather than left to operator discretion, injection must cease immediately upon discovery, the enforcement office must be notified within 24 hours, and a written follow-up report is typically due within days. There is very little room in this framework for a slow response, which makes early detection the only real lever an operator has to avoid the scramble entirely, and it is also why regulators treat a documented history of proactive monitoring as meaningfully different from an operator who was simply caught off guard.
The Formation Damage Mechanisms Behind a Rising Pressure Trend
Injectivity decline is not random, it follows well-documented physical mechanisms that build up gradually near the wellbore, which is exactly why continuous data makes such a difference over a monthly snapshot. Understanding what is actually happening downhole helps explain why the pressure trend, not just the pressure value on report day, is the signal worth watching.
Each of these mechanisms shows up first as a small, steady rise in the injection pressure needed to maintain the same volume, well before that rise crosses a permit limit or fails a test. A monthly report captures a single point on that curve. Continuous monitoring captures the curve itself, which is the difference between reacting to a violation and correcting course before one occurs.
This is also why treating injectivity decline purely as an engineering curiosity understates its importance. Produced water handling and disposal is consistently one of the largest ongoing operating costs for producers managing mature fields, and a disposal well that loses injectivity is not just a compliance risk, it is a capacity problem that forces an operator to either accept a slower disposal rate, spend on remedial treatment such as acid stimulation or workover, or bring a second well online sooner than planned. Catching the decline trend early gives an operator options, whereas discovering it at the point of a failed test or a pressure exceedance leaves only the most expensive and time-constrained choices available, often under a regulatory clock that leaves little room to shop for the best price on emergency repair work.
See Injectivity Decline Modeled Against Your Own Wells
Bring your injection pressure and volume history, and see how early iFactory's platform would have flagged the trend that led to your last mechanical integrity concern. Book a demo with our engineering team.
Every Data Point EPA and State Regulators Already Require, Watched Continuously
iFactory does not ask operators to collect new categories of data, it applies continuous monitoring and predictive analysis to the same parameters Class II permits and EPA UIC guidance already require, closing the gap between when a trend starts and when someone notices it.
None of this data replaces the annual and monthly reports still required by your permit, it strengthens them. The same continuously logged readings that power the early-warning alerts also compile directly into the reporting formats operators already submit, so the monitoring investment pays for itself twice, once in the early warning it provides, and again in the reporting burden it removes from whoever currently pulls those numbers together by hand each month.
The Same Well, Two Very Different Amounts of Warning
Monthly reporting was never designed to catch a developing problem early, it was designed to document compliance after the fact. Continuous monitoring changes what an operator actually knows in the weeks before a threshold is crossed.
| Factor | Standard Monthly Reporting | iFactory Continuous Monitoring |
|---|---|---|
| Data Frequency | Monthly maximum pressure and volume figures | Continuous, matched to permit-required intervals |
| Trend Visibility | One data point per reporting period | Full injectivity trend visible as it develops |
| Warning Before Exceedance | Often none, discovered at or after the threshold | Weeks of lead time as pressure trend approaches limit |
| MIT Failure Risk | Integrity issues surface only at scheduled test | Annulus and pressure anomalies flagged as they occur |
| Audit Documentation | Manual compilation of paper and spreadsheet records | Timestamped, continuous record ready for inspection |
A Shut-In Costs More Than the Repair Itself
The direct cost of a mechanical integrity failure, remediation work, a retest, and possibly a workover, is usually the smallest piece of the total financial impact. The larger cost sits upstream, in the produced water that a field still generates every day the disposal well is offline. If a single well normally handles disposal for a cluster of producing wells, taking it out of service can force those wells to either curtail production to match remaining disposal capacity or truck produced water to an alternate site at a meaningfully higher cost per barrel, both of which erode margin for as long as the shut-in lasts.
That cost compounds when the shut-in was avoidable. A well that fails an MIT because internal pressure had been trending upward for months without anyone flagging it did not fail suddenly, it failed on a schedule that continuous monitoring would have surfaced weeks earlier. The gap between a planned remedial workover, scheduled during a low-impact production window with parts and crew arranged in advance, and an emergency shut-in discovered at test time is often the difference between a manageable operating expense and a genuinely disruptive event, and that difference is almost entirely a function of how much advance warning the operator actually had.
What Disposal Well Operators Ask Before Deploying Continuous Monitoring
Catch Injectivity Decline Before It Becomes a Violation
iFactory monitors injection pressure, volume, and annulus data continuously against your permit limits, predicting decline before it forces a shut-in. Book a demo and bring your current well inventory.