Produced Water Monitoring — Quality, Disposal & Treatment
By Johnson on July 31, 2026
For every barrel of oil produced at a mature well, operators are commonly managing several barrels of produced water alongside it, and that ratio only climbs as fields age. Produced water is not a byproduct that can be handled loosely — its volume drives handling and disposal costs, its chemistry determines what treatment path is even viable, and disposal well compliance is one of the more closely watched regulatory areas in upstream operations. Getting visibility into quality, volume, and treatment performance in real time changes produced water from a reactive cost center into something an operations team can actively manage. More detail is available through iFactory's water monitoring team.
iFactory Guide — Oil & Gas
Produced Water Monitoring: Quality, Disposal, and Treatment
Real-time visibility into produced water quality, volume, and treatment effectiveness helps operators control handling costs and stay ahead of disposal well compliance limits before a violation happens.
typical produced water to oil ratio at mature onshore wells
Real-Time
Quality readings
Volume
Trend tracking
SWD
Compliance alerts
Treatment
Performance tracking
Why Produced Water Management Gets Harder Over Time
Water cut rises as a field ages, meaning the same well that produced mostly oil in its early years can shift toward producing mostly water as reservoir pressure declines and water breakthrough increases. That shift quietly changes the economics of the well, since handling, treating, and disposing of the growing water volume adds cost that does not show up as clearly on a production report as the oil volume does. Operators managing a large well count without granular water monitoring often discover the true handling cost only after it has already eroded margin across the field for months.
The Three Things That Actually Need Monitoring
01
Water Quality
Total dissolved solids, oil and grease content, suspended solids, and chemical composition determine which disposal or treatment path is viable and how a specific batch will perform against injection well limits.
02
Water Volume
Daily and cumulative produced water volume per well and per facility drives trucking schedules, disposal well capacity planning, and the underlying handling cost model for the field.
03
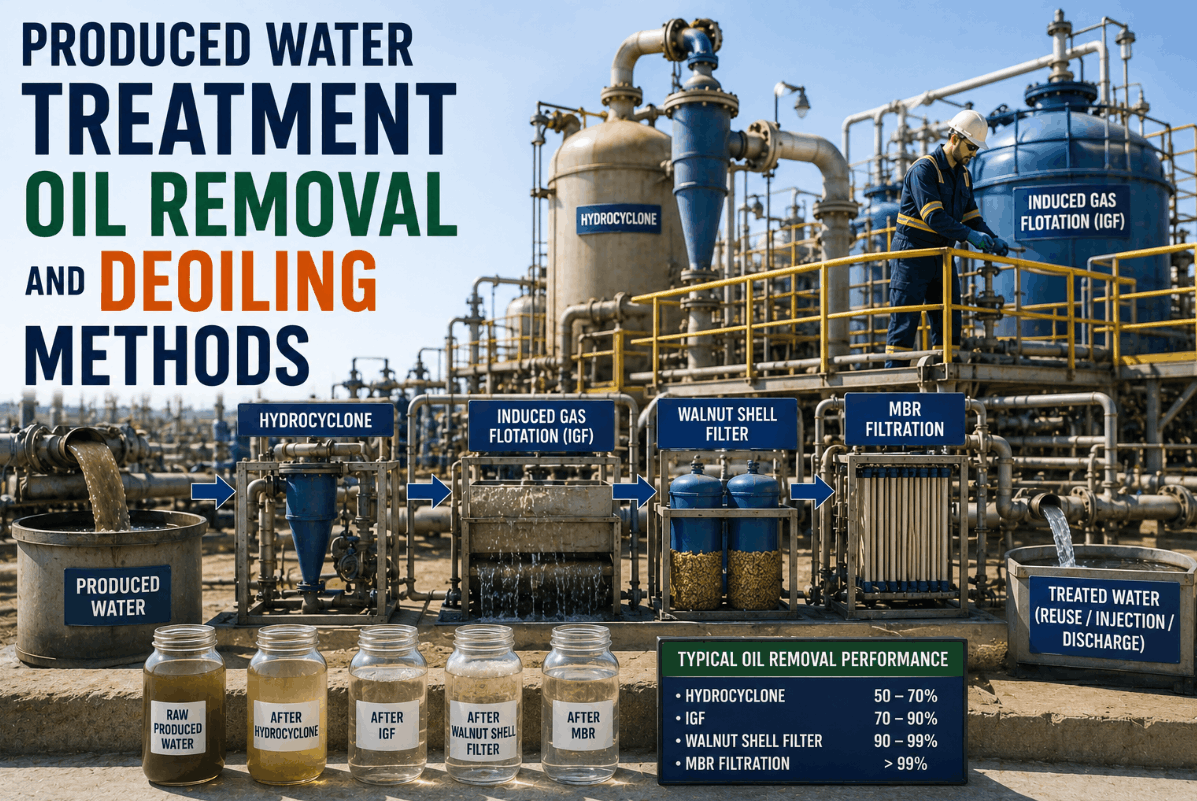
Treatment Effectiveness
Performance of separators, filtration, and chemical treatment stages against target output quality shows whether the treatment train is actually delivering the water quality it is designed for, cycle over cycle.
What Happens Without Real-Time Visibility
Without continuous monitoring, most operators are relying on periodic manual sampling — a technician pulling a sample on a set schedule, sending it to a lab, and getting results back days later. That approach works reasonably well for routine tracking, but it means a quality excursion between sampling events can go undetected until the next scheduled sample, by which point out-of-spec water may already have been sent to a disposal well or a treatment system may have been running below target performance for an extended period without anyone knowing.
Where Monitoring Points Sit in the Produced Water Path
Want to see what continuous monitoring would have caught in your last disposal well compliance report? Share a sample dataset with our team for a no-cost review.
The Cost Structure Behind Produced Water Handling
35%
Trucking and Transfer
Hauling cost from tank battery to disposal well or treatment facility, which scales directly with volume and distance and is often the single largest line item.
30%
Disposal Well Fees
Per-barrel disposal cost charged by injection well operators, with pricing often tiered by water quality and volume commitment.
20%
Treatment Chemicals and Equipment
Chemical treatment costs and equipment maintenance for separators and filtration systems used to bring water to target quality before disposal or reuse.
15%
Compliance and Reporting Labor
Staff time spent on manual sampling, lab coordination, and regulatory reporting for disposal well operations and water quality documentation.
What Real-Time Monitoring Changes
Earlier
Detection of Quality Excursions
Continuous readings flag an out-of-spec batch as it happens rather than at the next scheduled sample, giving operators time to reroute or adjust treatment before a compliance issue occurs.
Optimized
Trucking and Disposal Scheduling
Volume trend data across the field allows trucking and disposal scheduling to be planned proactively rather than reactively responding to tank levels as they approach capacity.
Verified
Treatment System Performance
Ongoing comparison of treatment input and output quality shows whether a treatment train is degrading before it fails to meet target specification entirely.
Reduced
Compliance Reporting Burden
Continuous data logging replaces much of the manual sample-and-report cycle, giving field staff time back for other operational priorities.
How Water Chemistry Shapes Disposal and Reuse Options
Not all produced water is handled the same way, and the deciding factor is almost always chemistry rather than volume alone. High total dissolved solids content, elevated oil and grease concentration, or the presence of specific compounds like barium or hydrogen sulfide all change which disposal path is even permissible and what treatment steps are required before that path is viable. A field with relatively benign water chemistry might have reuse for hydraulic fracturing fluid as a realistic option, cutting freshwater sourcing costs significantly, while a field with more challenging chemistry may be limited to injection disposal regardless of how much treatment investment is made. Understanding where a specific well or tank battery's water actually sits on that spectrum, continuously rather than through occasional sampling, is what lets an operations team make an informed call about which handling strategy actually makes economic sense for that asset.
This is also where the gap between average field chemistry and individual well chemistry tends to cause problems. Blending water from multiple wells into a shared tank battery averages out chemistry in a way that can mask a specific well producing consistently out-of-spec water. Without well-level monitoring, that well's contribution simply becomes part of the field average until a compliance issue traces back to it — at which point isolating the source well from a shared tank battery after the fact is a much harder diagnostic exercise than catching it with continuous, well-level readings from the start.
Building a Business Case for Continuous Monitoring
Operators evaluating whether continuous produced water monitoring is worth the investment typically build the case around three questions: how much is currently being spent on manual sampling and lab turnaround relative to the value of catching issues faster, how close current disposal well operations run to their permitted limits on a routine basis, and how much of current trucking and disposal cost is driven by inefficient scheduling rather than actual water volume. Fields answering yes to any of those tend to see the clearest return, since continuous monitoring directly addresses each of those cost drivers rather than adding a general-purpose data layer with no specific problem attached.
Question 1
Sampling and Lab Turnaround Cost
How much staff time and lab spend currently goes into manual sampling, and how much delay exists between sample collection and actionable results.
Question 2
Margin to Permitted Limits
How close routine disposal well operations run to permitted injection limits, and how much warning time current sampling frequency provides before a limit is approached.
Question 3
Trucking Schedule Efficiency
How much current trucking dispatch relies on reactive tank-level checks versus proactive scheduling based on known accumulation trends.
Frequently Asked Questions
What sensors are typically used for continuous produced water quality monitoring?
Continuous monitoring typically combines inline sensors for parameters like conductivity, turbidity, oil-in-water concentration, and total dissolved solids at key points along the water path, supplemented by periodic lab sampling for parameters that are harder to measure continuously or that regulators require lab-verified results for. The specific sensor package depends on your field's water chemistry and which disposal or treatment path you are running, and gets scoped during the initial site assessment. Talk to our team about the right sensor mix for your operation.
Can this help avoid a disposal well compliance violation before it happens?
Yes, that is one of the more direct value drivers operators see — continuous quality monitoring at the point of transfer to the disposal well means a batch trending toward an out-of-spec parameter is flagged in real time, giving field staff the chance to hold the batch, adjust treatment, or reroute before it reaches the well and creates a compliance exposure. This shifts compliance from a reactive, after-the-fact reporting exercise to something actively managed at the point of transfer. Book a walkthrough to see the alerting workflow in action.
How does volume tracking actually reduce trucking costs?
Volume trend data across a field's tank batteries lets trucking dispatch move from a fixed schedule or reactive tank-level response to a planned schedule based on actual accumulation rates per site, which reduces both wasted trips to tanks that are not yet full and emergency dispatch for tanks that fill faster than expected. Fields with highly variable water cut across wells tend to see the largest scheduling efficiency gains once accumulation patterns are visible site by site. Share your current trucking schedule with our team for a comparison.
Does this integrate with our existing SCADA or field data system?
The monitoring platform is built to integrate with the SCADA and field data infrastructure most operators already run, exchanging sensor readings, alerts, and volume data through standard interfaces rather than requiring a separate standalone system for water monitoring. This means water quality and volume data can appear alongside your existing production and facility data rather than living in a disconnected tool. Reach out to our integration team to confirm compatibility with your current systems.
What does a typical deployment look like for a multi-well field?
Deployment typically starts with a site assessment covering your current tank batteries, treatment infrastructure, and disposal points, followed by sensor installation at the key monitoring checkpoints identified during that assessment, and a validation period comparing continuous readings against your existing lab sampling process before full cutover to real-time monitoring as the primary data source. Timeline scales with well count and facility complexity and is scoped specifically to your field during planning. Book a demo to get a deployment timeline scoped to your field.
Stay Ahead of the Next Compliance Report.
See Real-Time Produced Water Monitoring Running on Your Field Data
Share a sample of your current water quality and volume data, and our team will show you what continuous monitoring would have surfaced across your last reporting period.