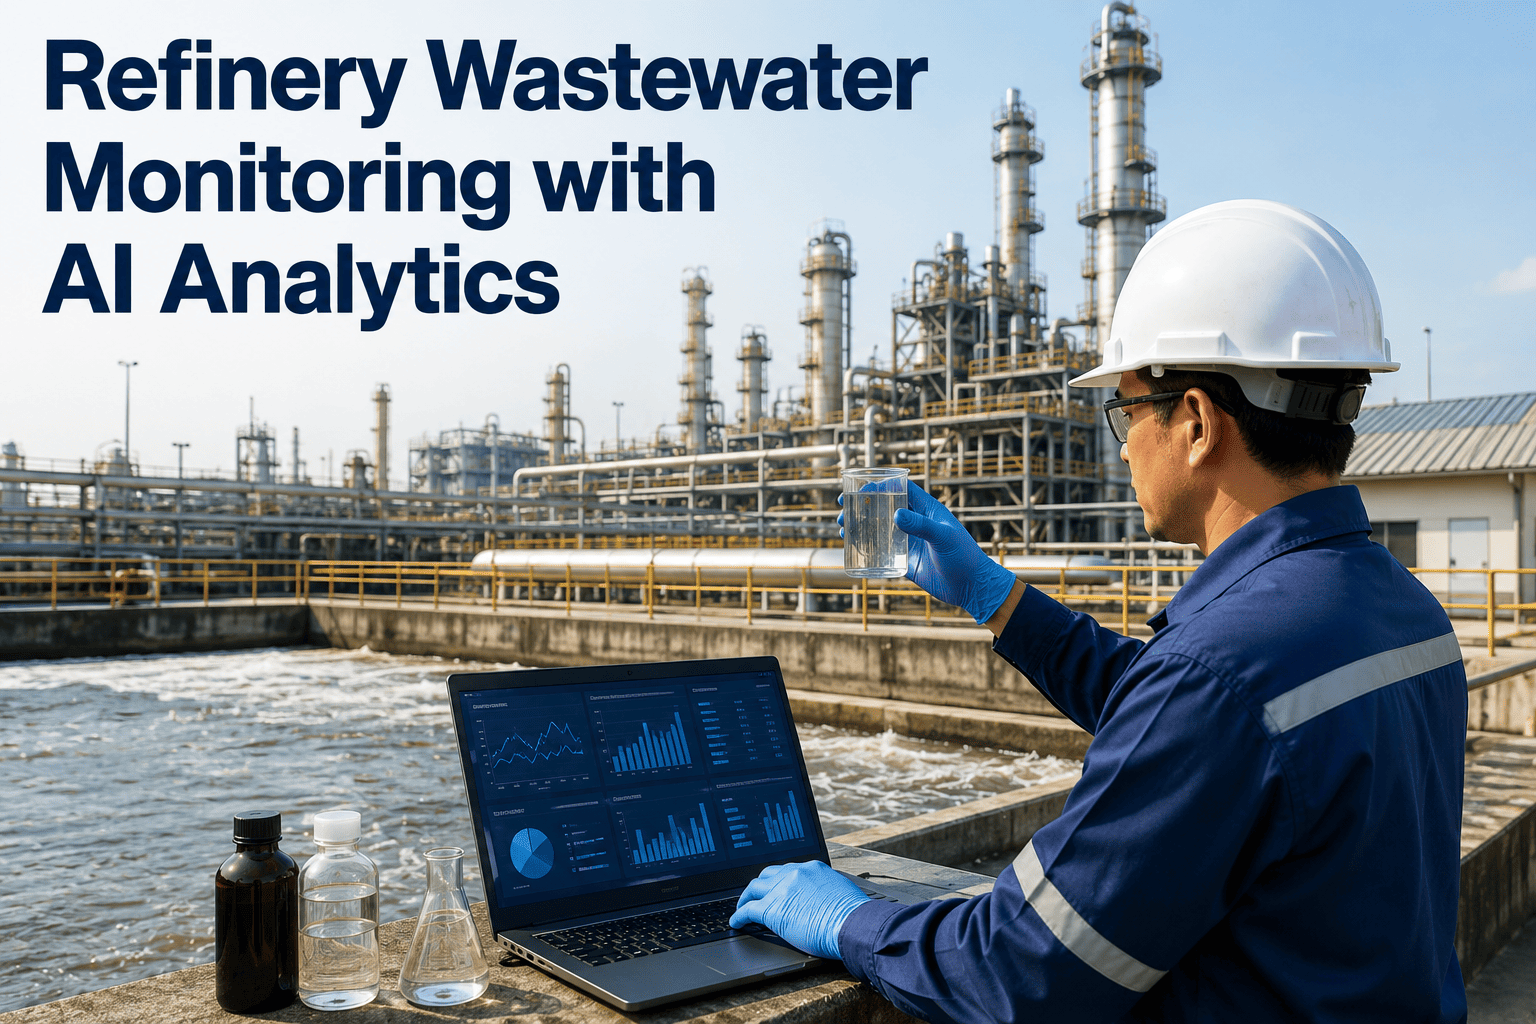
A refinery wastewater treatment system runs as a sequence of stages, and a problem at any one of them, an oil carryover past the API separator, a DAF unit losing float efficiency, a biological process losing microbial health, shows up hours later as an effluent parameter drifting toward its permit limit. By the time a lab sample confirms the excursion, the water causing it has often already left the outfall. Environmental teams are left explaining a violation after the fact instead of correcting the process that caused it. Talk to iFactory support about predictive monitoring across your wastewater treatment train.
Refinery · Environmental Compliance · Wastewater Treatment
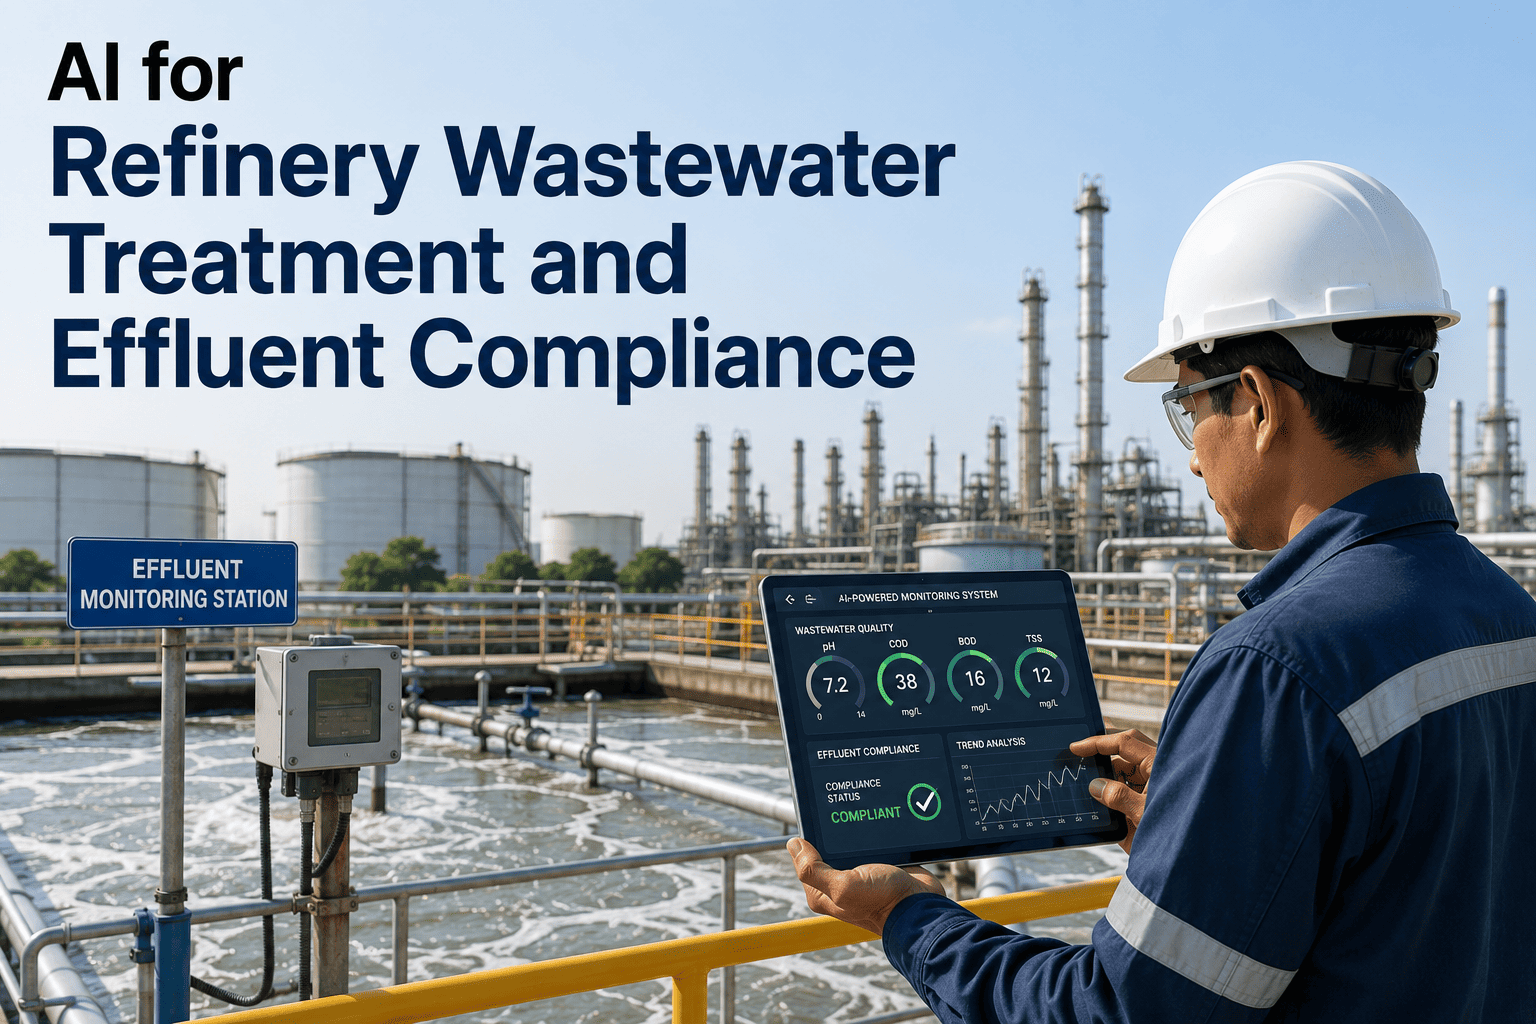
AI for Refinery Wastewater Treatment and Effluent Compliance
API separator, DAF, and biological treatment performance determine whether effluent stays inside NPDES permit limits or drifts toward a reportable excursion. Here is how AI tracks that performance stage by stage, and how far ahead it can flag trouble before it reaches the outfall.
24 Hrs
Typical lead time between an early process indicator and a resulting effluent excursion at the outfall
3 Stages
API separator, dissolved air flotation, and biological treatment, each contributing to final effluent quality
Continuous
Parameter tracking across the treatment train instead of relying on periodic grab sample results alone
The Treatment Train
Effluent Quality Is Decided in Three Stages Before Water Ever Reaches the Outfall
Refinery wastewater moves through a sequence of physical, chemical, and biological processes before discharge, and each stage is responsible for removing a different category of contaminant. Understanding what each stage is supposed to be doing is the first step in catching where it has started to fall short.
1
API Separator
Gravity separation removes free oil and heavier solids from incoming process water, forming the first line of defense against oil carryover into downstream stages.
Watched: oil film thickness, interface level, retention time
→
2
DAF Unit
Dissolved air flotation attaches microscopic air bubbles to remaining emulsified oil and suspended solids, floating them to the surface for skimming and removal.
Watched: float efficiency, air-to-solids ratio, skimmer performance
→
3
Biological Treatment
Microorganisms break down dissolved organic compounds, reducing BOD and COD before the water is considered ready for discharge or further polishing.
Watched: dissolved oxygen, sludge age, microbial health indicators
→
4
Outfall
Final effluent is discharged under the conditions defined by the plant's NPDES permit, where every parameter above limit becomes a reportable event.
Watched: oil and grease, TSS, BOD, pH, ammonia
Where It Breaks Down
What Actually Goes Wrong at Each Stage of the Treatment Train
API Separator Upset
A sudden oil slug from an upstream process unit or a high interface level can overwhelm separator retention time, letting free oil pass through into the DAF stage before it has fully separated.
DAF Efficiency Loss
Incorrect air-to-solids ratio, chemical dosing drift, or a fouled skimmer mechanism reduces float efficiency, allowing emulsified oil and solids to carry into the biological stage instead of being removed.
Biological Process Stress
A toxic shock load, dissolved oxygen shortfall, or nutrient imbalance stresses the microbial population, reducing organic removal efficiency and raising BOD in the final effluent over the following hours.
Early Warning Window
The 24-Hour Gap Between a Process Indicator and an Effluent Excursion
The value of predictive monitoring comes from the time lag built into the treatment process itself. An upset at the API separator or DAF stage does not reach the outfall instantly, it takes hours to move through retention time, biological reaction time, and final clarification, and that lag is exactly the window a predictive model uses to give teams a chance to intervene.
Hour 0
Upstream Upset Detected
An abnormal indicator appears at the API separator or DAF stage, such as rising interface level or falling float efficiency.
Hour 6–10
Biological Stage Impact
If unaddressed, the disturbance reaches the biological treatment stage, where dissolved oxygen or organic loading begins shifting from baseline.
Hour 18–24
Effluent Parameter Drift
Final effluent quality begins moving toward permit limits, the point at which a grab sample would first reveal the problem without predictive monitoring.
Hour 24+
Reportable Excursion Risk
Without intervention, the parameter can cross the permit limit, creating a reportable exceedance that predictive monitoring is specifically designed to prevent.
A Permit Excursion Is Rarely a Surprise — It Is a 24-Hour-Old Process Upset Nobody Traced Yet
iFactory tracks API separator, DAF, and biological treatment indicators continuously, giving environmental and operations teams the lead time to correct an upset before it becomes a reportable effluent exceedance.
Compliance Parameters
The Core Effluent Parameters Every NPDES Permit Tracks
Most refinery NPDES permits center on a consistent set of effluent parameters, each tied to a different stage of the treatment train and each carrying its own consequence if it drifts out of tolerance.
Measured Outcomes
What Refineries Report After Deploying Predictive Wastewater Monitoring
24 Hrs
Advance Warning on Excursions
Early indicators at the API separator and DAF stages typically give a full day of lead time before an effluent parameter would otherwise drift out of permit limits.
Fewer
Reportable Exceedances
Catching process upsets before they propagate through the treatment train reduces the frequency of permit violations requiring regulatory reporting.
Faster
Root Cause Identification
Tracing an effluent drift back to the specific stage and indicator that caused it replaces guesswork with a documented process trend.
Continuous
Coverage Beyond Grab Samples
Process-level monitoring fills the gap between periodic lab samples, catching drift that would otherwise go unnoticed between sampling intervals.
Field Example
A DAF Efficiency Drift Was Traced and Corrected Before Reaching the Outfall
A refinery's wastewater treatment team had experienced a reportable oil and grease exceedance several months earlier, traced after the fact to a period of reduced DAF float efficiency that had gone unnoticed until the weekly composite sample results came back. Following that event, the plant implemented continuous monitoring of DAF air-to-solids ratio and skimmer performance alongside API separator interface level. Several weeks later, the system flagged a gradual decline in DAF float efficiency consistent with the pattern that had preceded the earlier exceedance, correlating with a chemical dosing pump that had begun underperforming. Operations adjusted the dosing rate and inspected the pump within hours of the alert, well before the disturbance had time to propagate through biological treatment and affect final effluent quality. The composite sample taken that week showed oil and grease well within permit limits, and no exceedance was recorded.
Hours
Time from alert to dosing pump correction
0
Exceedances recorded following the correction
Same Pattern
Correctly matched against the prior incident's early signature
Within Limits
Composite sample result for the affected week
Common Questions
AI for Refinery Wastewater Compliance — What Environmental Teams Ask First
How does predictive monitoring differ from the composite and grab sampling we already do for NPDES reporting?
Composite and grab sampling remain the regulatory basis for permit compliance reporting and are not replaced by predictive monitoring. What predictive monitoring adds is continuous visibility into the process indicators between sampling events, so a developing problem is visible well before the next scheduled sample would catch it, giving teams time to correct the process rather than simply document a result after the fact.
Contact support to see how process monitoring complements your existing sampling program.
Can the system account for the natural variability in refinery wastewater composition from different upstream units?
Yes, the model is trained against your plant's own historical process data, which inherently captures the normal variability introduced by different upstream units feeding the treatment system at different times. This means alerts are calibrated to what is genuinely abnormal for your specific wastewater profile rather than flagging every routine fluctuation, which is essential in a refinery setting where feed composition is rarely constant.
Book a demo to see how the model calibrates to your treatment train's baseline.
What early indicators actually predict a biological treatment upset before dissolved oxygen or BOD visibly change?
Indicators such as a sudden shift in DAF effluent oil concentration, an unusual pH swing entering the biological stage, or a change in influent flow rate often precede a visible dissolved oxygen or BOD change by several hours, since the biological population takes time to respond to a disturbance in its feed water. Tracking these upstream indicators together, rather than waiting for the biological stage's own output metrics to move, is what creates the lead time predictive monitoring depends on.
How is this different from the alarms already built into our DCS for the treatment system?
Standard DCS alarms are generally configured around fixed setpoints for individual parameters, triggering once a value crosses a threshold that has often already caused downstream impact. Predictive monitoring instead looks at the relationship and trend across multiple indicators simultaneously, aiming to flag the pattern that precedes a threshold breach rather than the breach itself, which is what creates meaningful advance warning instead of a same-moment alarm.
Contact support to compare predictive alerting against your current DCS alarm configuration.
Does implementing this kind of monitoring require new instrumentation at the API separator, DAF, or biological stages?
Many refineries already have sufficient instrumentation at each treatment stage to support predictive monitoring, since interface level, flow, dissolved oxygen, and similar measurements are commonly already in place for operational control. Where gaps exist, a targeted assessment typically identifies the minimum additional instrumentation needed rather than requiring a full system overhaul.
Book a demo for an instrumentation gap review of your treatment train.
Effluent Compliance Is Won or Lost at the API Separator and DAF Stage, Hours Before the Outfall Sees It
iFactory monitors your full treatment train continuously, correlating process indicators across API separator, DAF, and biological treatment stages to give your environmental and operations teams a real lead time window before an effluent excursion becomes reportable.