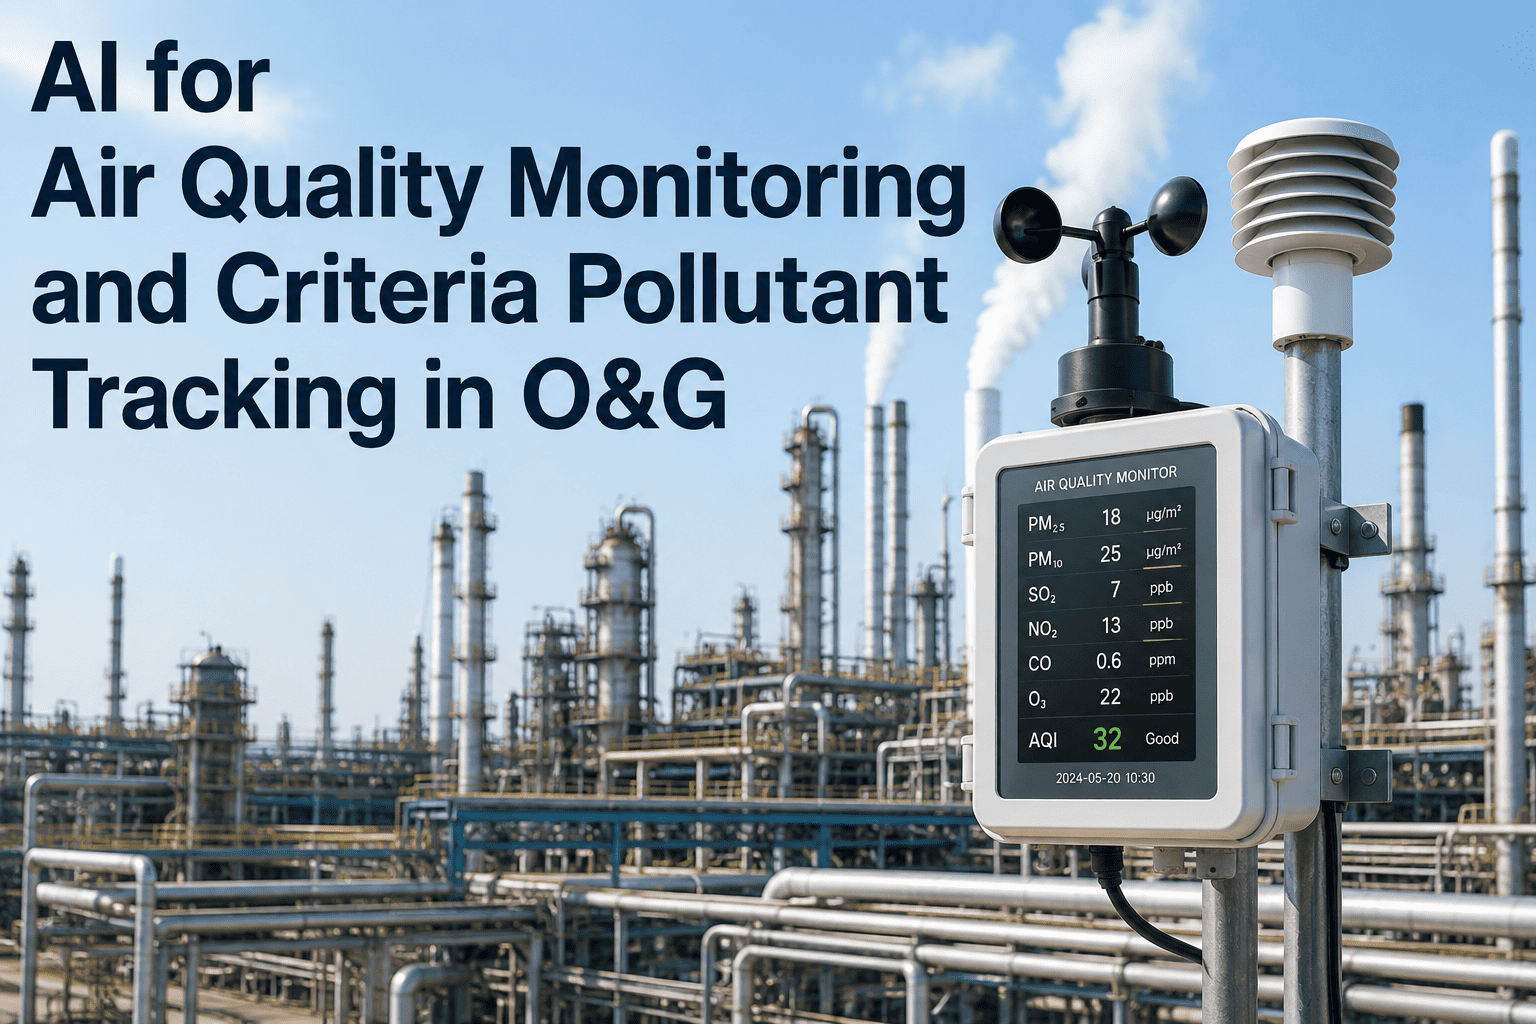
Most oil and gas facilities still find out about an air permit exceedance the same way they've found out for decades, a stack test performed once a quarter, an annual emissions inventory compiled months after the fact, or a regulator's inspector showing up with a portable analyzer on a day nobody chose. In between those snapshots, a process heater running rich, a flare pulling more assist gas than it should, or a tank farm venting more than its permitted VOC loading can run for weeks without anyone knowing a NAAQS threshold or a state permit limit was ever crossed. Continuous emissions monitoring has existed for years, but turning raw NOx, SOx, CO, PM2.5, and VOC readings into a defensible, permit-referenced compliance picture in real time has always required more engineering hours than most environmental teams have to spare. AI closes that gap by calculating compliance against NAAQS and permit limits continuously, flagging drift before it becomes an exceedance instead of after a report is due. Book an air quality monitoring demo to see it running against your own permit limits and stack data.
AI-Driven Air Quality Monitoring and Criteria Pollutant Compliance
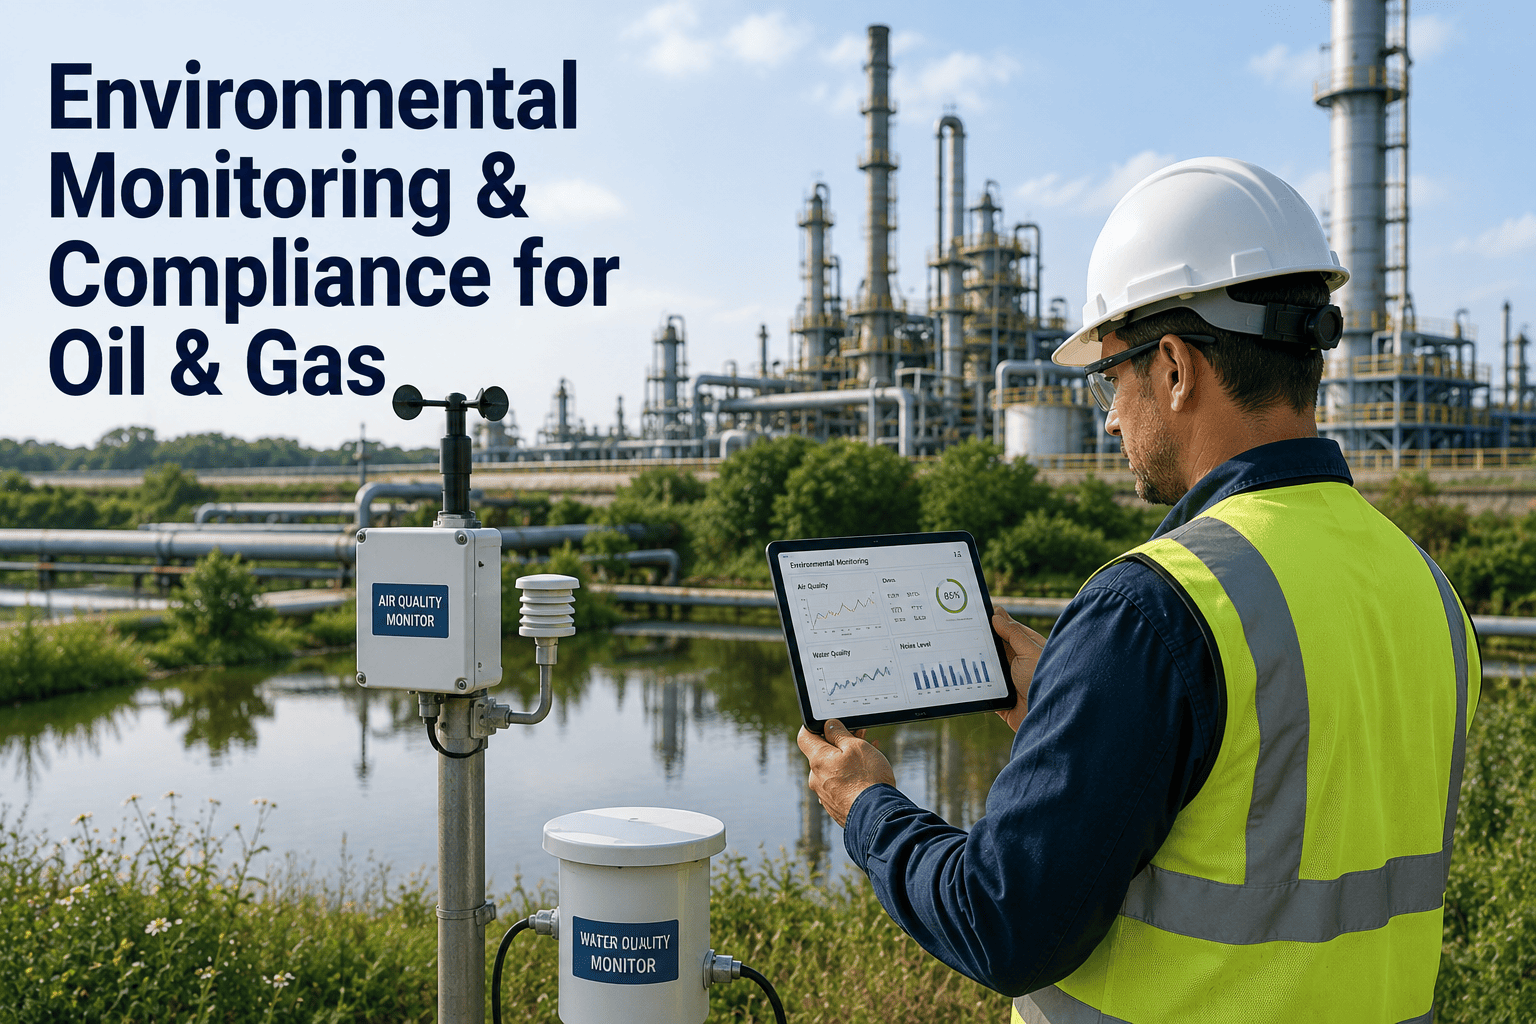
Process heaters, flares, tanks, and compressor engines all emit criteria pollutants continuously, but most facilities only check compliance periodically. AI pulls live CEMS, PEMS, and flow data together, calculates compliance against NAAQS and permit limits in real time, and flags drift toward a threshold days before a quarterly report would ever catch it.
Why Periodic Sampling Misses Real Exceedances
A quarterly stack test or an annual emissions inventory captures conditions on one day, under one operating scenario, and extrapolates from there. Real process conditions swing with feed composition, ambient temperature, combustion air trim, and equipment wear, none of which pause for the test window. The gap between what a permit assumes and what a unit actually emits on a bad day is exactly where most compliance exposure hides.
is the typical stack testing cadence most process heaters and flares are held to under state permits
current annual NAAQS primary standard for PM2.5, tightened from 12.0 µg/m3 in the 2024 revision
of flare and heater excess emission events reviewed in enforcement cases involve conditions between scheduled test dates
of lag typical between an emissions inventory calculation and the operating period it's meant to represent
The Five Criteria Pollutants Every Site Tracks
Each pollutant has its own NAAQS threshold, its own primary source across a typical facility, and its own regulatory averaging period. AI models are built around each pollutant's specific standard rather than a single generic emissions dashboard.
Nitrogen Oxides
Primary NAAQS standard of 100 ppb over a 1-hour average and 53 ppb annually. Dominant sources are process heater and boiler combustion, with burner tuning and excess air trim as the main operating levers.
Sulfur Oxides
Primary NAAQS standard of 75 ppb over a 1-hour average. Driven mainly by fuel gas sulfur content and acid gas flaring events, making fuel gas composition monitoring a key leading indicator.
Carbon Monoxide
Primary NAAQS standard of 9 ppm over an 8-hour average and 35 ppm over 1 hour. A rising trend usually signals incomplete combustion at a heater or flare tip before it shows up as a visible smoking event.
Fine Particulate Matter
Primary NAAQS standard of 9.0 µg/m3 annually and 35 µg/m3 over 24 hours. Sources include combustion soot and fugitive dust, with the annual standard tightened significantly in the 2024 EPA revision.
Volatile Organic Compounds
Not a NAAQS pollutant directly, but a regulated ozone precursor tracked against permit loading limits, mainly from tank flashing losses, fugitive component leaks, and flare destruction efficiency shortfalls.
Where These Pollutants Actually Come From on Site
Every emission source on a facility contributes a different mix of pollutants, and continuous monitoring only becomes actionable once it's tied back to the specific unit driving a trend.
Process Heaters and Boilers
The largest continuous NOx, SOx, and CO source on most sites, directly tied to burner tuning, excess air ratio, and fuel gas composition, all of which drift gradually between tune-ups.
Flares
Destruction efficiency for VOCs and CO depends on assist gas ratio, heating value, and exit velocity, all of which can degrade quietly long before a flare is visibly smoking.
Storage Tanks
Working and breathing losses release VOCs continuously, with flashing losses spiking sharply during high-throughput filling events that periodic testing rarely captures.
Compressor Engines
NOx and CO output shifts with load, air-fuel ratio, and engine wear, making engines a frequently underweighted contributor to site-wide criteria pollutant totals.
How AI Turns Raw Emissions Data Into a Compliance Picture
The calculation itself, comparing a measured concentration against a permit limit, is simple. What's hard is doing it continuously, correctly, and across every source and averaging period a facility is actually held to.
Continuous Data Ingestion
CEMS, PEMS, flow meters, and fuel gas analyzers feed live readings in for every monitored source across the site, rather than a snapshot pulled during a scheduled test.
Averaging Period Calculation
Each pollutant is rolled up against its own regulatory averaging window, 1-hour, 8-hour, 24-hour, or annual, exactly as the applicable NAAQS or permit condition requires.
Permit Limit Cross-Reference
Calculated values are checked continuously against the specific limits written into each source's air permit, not a generic threshold, since permit conditions vary unit by unit.
Drift Detection and Alerting
Trends approaching a limit are flagged well before a formal exceedance, giving the environmental and operations teams time to adjust combustion or process conditions.
Regulatory Reporting
Excess emission reports, deviation reports, and annual inventories are compiled directly from the continuous record, cutting the manual data assembly work each reporting cycle requires.
Periodic Stack Testing vs Continuous AI Monitoring
Periodic testing and dispersion modeling remain regulatory requirements in their own right, but they were never designed to catch what happens between test dates. Here is how the two approaches compare on the questions that actually determine compliance exposure.
Swipe left to see the full comparison
See Your Own Emission Sources Against Your Permit Limits
iFactory can map your existing CEMS, PEMS, and process data against your specific NAAQS and permit thresholds before a rollout is scoped, so you see the compliance picture before committing to anything.
From Normal Trend to Reportable Exceedance
Not every fluctuation in emissions data needs the same response. A tiered escalation model keeps small drifts from becoming noise while making sure a genuine approach toward a limit gets attention fast.
Normal Operating Range
Readings track within the historical baseline for that source and averaging period, logged continuously with no action required beyond routine review.
Elevated Trend
A sustained upward trend approaching a meaningful fraction of the permit limit triggers a review of recent process changes and combustion tuning before it progresses further.
Action Level
The trend crosses an internal action threshold set below the regulatory limit, prompting operator notification and a documented corrective action before a formal deviation occurs.
Reportable Exceedance
The applicable averaging period value crosses the permit or NAAQS limit, generating the documentation and root cause record needed for the required regulatory deviation report.
Common Air Quality Monitoring Mistakes
Most compliance gaps trace back to a handful of recurring issues, not a lack of monitoring equipment.
Treating VOCs as a Single Number
Lumping tank losses, fugitive leaks, and flare destruction shortfalls into one VOC total makes it impossible to know which source actually needs attention when the number climbs.
Missing the Averaging Period That Matters
A source can look fine on an annual average while still exceeding a 1-hour or 24-hour limit repeatedly, a distinction periodic reporting frequently glosses over.
Not Correlating Emissions to Process Data
A concentration spike without the corresponding process context, fuel gas composition, load, ambient temperature, leaves the root cause investigation starting from zero.
Waiting for the Reporting Deadline to Look
Reviewing emissions data only when a quarterly or annual report is due means any corrective opportunity during the actual drift period has already been missed.
What Changes When Compliance Is Tracked Continuously
Facilities that move from periodic testing to continuous AI monitoring typically see the shift in both compliance exposure and reporting workload within the first reporting cycle.
Perspective From the Field
We found out about our last NOx deviation from the quarterly stack test report, three months after the burner had actually drifted out of tune. Once we had continuous monitoring correlated against our permit limits, the same kind of drift showed up as a Tier 2 alert on the dashboard within days, and the burner got retuned before it ever became a reportable event. Our deviation reports have gotten noticeably shorter to write, and shorter to explain to the state.
— Priya Nair, Environmental Compliance Manager, Gulf Coast Refining Complex
time between the actual burner drift and when the quarterly test previously caught it
time to detection once continuous monitoring and permit cross-referencing were in place
reportable exceedances from that source since the alert-driven retune
Frequently Asked Questions
Does continuous AI monitoring replace our required CEMS and stack testing?
No, CEMS certification and periodic stack testing remain regulatory requirements in their own right for permitted sources. What AI monitoring adds is a continuous compliance layer on top of that existing instrumentation, correlating readings against permit limits and process data in real time so drift gets caught between the required test dates rather than only during them. Book an air quality demo and bring your current CEMS and PEMS list so we can map what's already reusable.
How does the system know which permit limit applies to which source?
Each monitored source is configured against the specific limits and averaging periods written into its own air permit, rather than a generic site-wide threshold, since two heaters on the same site can carry different NOx limits depending on when they were permitted and what control technology they use. This unit-specific mapping is what makes the automated compliance calculation defensible for regulatory reporting.
Can this help with VOC tracking from tanks specifically, or only combustion sources?
Tank working and breathing losses are tracked alongside combustion sources, with flashing loss events during high-throughput filling flagged separately from steady-state venting, since the two have very different magnitudes and different permit treatment. This separation is usually the piece manual VOC accounting struggles with most, since periodic testing rarely captures a short, sharp filling event.
What happens when a reading actually crosses a permit limit?
A crossed limit generates the documentation trail needed for the required deviation or excess emission report automatically, including the process conditions correlated with the event, which is typically the most time-consuming part of assembling a regulatory submission manually. Talk to a specialist about how this fits your specific state agency's reporting format.
How long does it take to get continuous monitoring running across a facility?
Most facilities see their largest sources, typically process heaters and flares, mapped and generating compliance alerts within the first several weeks, with full coverage across tanks and engines following as additional data feeds are connected. Timeline depends mainly on how many separate permits and averaging periods are involved across the site.
Stop Finding Out About Exceedances From the Regulator
Book a 30-minute scoping call and iFactory will map your emission sources, existing CEMS and PEMS data, and permit limits to a rollout plan built around your highest-exposure sources first.